$WHITE Bearish Divergence on MACDAnalysis: $WHITE shows bearish divergence on the 1-hour MACD, with higher price highs but lower MACD peaks near $0.000527. The price is testing a weak support at $0.0005100, and a break could push it to $0.0004300, a prior low. Volume is decreasing, indicating reduced buying pressure.
Key Levels:
Entry: $0.0005100 (on break)
Stop Loss: $0.0005400
Target: $0.0004300 (16% downside)
Risk/Reward: 2.4:1
Enter on a confirmed support break with volume.
WHITEUSDT trade ideas

$WHITE Channel Breakdown ImminentAnalysis: $WHITE is trading in a tight ascending channel on the 30-minute chart, with the price at $0.000527 near the lower trendline. A break below $0.0005200 could confirm a channel breakdown, targeting $0.0004500, the next support zone. RSI is at 48 and falling, with no bullish divergence.
Key Levels:
Entry: $0.0005200 (on break)
Stop Loss: $0.0005350
Target: $0.0004500 (13% downside)
Risk/Reward: 2.2:1
Wait for a decisive break below the channel.

$WHITE Losing Momentum at 50 EMAAnalysis: $WHITE is struggling to break above the 50-period EMA on the 4-hour chart at $0.0005300, forming a bearish rejection wick. RSI is trending down from 55, and the price is at risk of dropping to $0.0004700, a key support level. Declining volume on rallies suggests fading buyer interest.
Key Levels:
Entry: $0.0005250
Stop Loss: $0.0005450
Target: $0.0004700 (10% downside)
Risk/Reward: 2:1
Short on a rejection at the EMA.

$WHITE Head-and-Shoulders Pattern FormingAnalysis: A head-and-shoulders pattern is emerging on the 1-hour chart, with the neckline at $0.0005000. The price at $0.000527 is testing the right shoulder, and a break below the neckline could target $0.0004400, a prior demand zone. MACD is crossing bearish, and volume is thinning on upticks, signaling weak bullish conviction.
Key Levels:
Entry: $0.0005000 (on break)
Stop Loss: $0.0005400
Target: $0.0004400 (12% downside)
Risk/Reward: 2:1
Confirm the pattern completion before entering.

$WHITE Overbought RSI Signals CorrectionAnalysis: $WHITE’s RSI on the 2-hour chart is at 75, indicating overbought conditions after a recent pump to $0.0005579. The price is stalling near $0.000527, with a bearish engulfing candle forming. A correction to $0.0004600, the 0.5 Fibonacci retracement, is likely if momentum fades. Declining OBV (On-Balance Volume) supports seller dominance.
Key Levels:
Entry: $0.0005250
Stop Loss: $0.0005500
Target: $0.0004600 (12% downside)
Risk/Reward: 2:1
Short on a confirmed bearish candle close.

$WHITE Testing Key Support, Breakout to DownsideAnalysis: $WHITE is trading near $0.000527, sitting on a fragile support at $0.0005000. The daily chart shows a descending triangle, with lower highs signaling bearish pressure. A break below $0.0005000 could trigger a move to $0.0004200, aligning with historical support. Stochastic oscillator is overbought at 80, suggesting a reversal.
Key Levels:
Entry: $0.0005000 (on break)
Stop Loss: $0.0005300
Target: $0.0004200 (16% downside)
Risk/Reward: 2.3:1
Monitor volume for confirmation of the breakdown.

$WHITE Rejected at Resistance, Downtrend LikelyAnalysis: $WHITE faced rejection at $0.0005579 (recent high, per X post), forming a double top on the 4-hour chart. The price is struggling to hold $0.000527, with MACD showing bearish divergence. A drop below $0.0005000 could accelerate selling toward $0.0004300, a prior low. RSI is rolling over from 60, supporting a bearish bias.
Key Levels:
Entry: $0.0005250
Stop Loss: $0.0005600
Target: $0.0004300 (18% downside)
Risk/Reward: 2.8:1
Wait for a clean rejection candle to enter.

Short: $WHITE Bearish Crossover Signals PullbackAnalysis: $WHITE is showing a bearish crossover on the 1-hour chart, with the 20-period EMA crossing below the 50-period EMA near $0.000527. Momentum is fading, as RSI drops below 40, indicating seller pressure. A break below $0.0004876 (recent support) could target $0.0004500, the next Fibonacci retracement level (0.618). Declining volume suggests weak buyer defense.
Key Levels:
Entry: $0.0005200
Stop Loss: $0.0005579 (above resistance)
Target: $0.0004500 (14% downside)
Risk/Reward: 2:1
Short on a confirmed break below support.

Long: $WHITE Building Momentum at Support ZoneAnalysis: $WHITE is holding above a critical support zone at $0.0004876-$0.0005000, where buyers stepped in previously (per recent X post). The daily chart shows a rounded bottom forming, with RSI at 45, nearing oversold territory, hinting at a potential reversal. A bounce from this zone could target $0.0006000, the 200-period EMA resistance. Increasing volume on green candles supports accumulation.
Key Levels:
Entry: $0.0005100
Stop Loss: $0.0004750 (below swing low)
Target: $0.0006000 (15% upside)
Risk/Reward: 2.5:1
Watch for a higher low to confirm buyer strength.

$WHITE Poised for Breakout Above Key ResistanceAnalysis: $WHITE is consolidating near $0.000527, forming a bullish pennant on the 4-hour chart. The price is testing the 50-period EMA, which has acted as dynamic support. A breakout above $0.0005579 (recent high) could signal a move toward $0.0006200, aligning with the 1.618 Fibonacci extension from the last swing low. RSI is neutral at 50, suggesting room for upside momentum. Volume spikes on the last push higher support bullish continuation.
Key Levels:
Entry: $0.0005300
Stop Loss: $0.0004876 (below support)
Target: $0.0006200 (18% upside)
Risk/Reward: 3:1
Patience is key—wait for a confirmed breakout with volume.

WHITE’s On-Chain Data – Exchange Netflow Turns NegativeRecent data shows WHITE withdrawals spiking, reducing exchange supply. Historically, this precedes price rallies. Watch for a bullish crossover in MACD to confirm upward momentum.

Fibonacci Retracement Highlights WHITE’s Critical LevelsFrom the ATH (0.0009435)torecentlows,the61.80.0009435)torecentlows,the61.80.000688) aligns with mid-term resistance. A break above $0.000574 (38.2% Fib) is crucial for bullish momentum.

Whale Activity Detected – WHITE/USDT Liquidity HuntLarge limit orders cluster near 0.0009435(ATH)and0.0009435(ATH)and0.000435 (yearly low). Price may swing aggressively to liquidate positions. Scalp traders could capitalize on these liquidity zones.

WHITE/USDT – Descending Triangle Breakdown RiskA descending triangle is forming on the 4H chart, with resistance at 0.000574andlowerhighs.Aclosebelow0.000574andlowerhighs.Aclosebelow0.0005185 could accelerate selling. Short-term traders might short with a target of $0.00048.

KDJ Indicator Flashes Oversold Signal – WHITE Bounce LikelyThe daily KDJ line (K: 18, D: 25) has entered oversold territory, historically preceding 10-15% rebounds. Target
0.000574
–
0.000574–0.00060 if buyers defend $0.00050.

WHITE’s Volume Profile – Key Accumulation Zone IdentifiedHigh volume clusters between 0.00048and0.00048and0.0005185 suggest strong buyer interest. A close above $0.000574 with rising volume may confirm a bullish reversal. Monitor order book depth for confirmation.
Bear Flag Pattern Emerges – Caution Advised for WHITE BullsWHITE/USDT is forming a bear flag on the 1D chart following the 12.53% drop. A breakdown below 0.0005185couldtriggera15−200.0005185couldtriggera15−200.000435. Hold longs only if $0.000574 holds as support.

WHITE Tests Bollinger Band Squeeze – Volatility AheadThe 4H Bollinger Bands have tightened significantly, indicating suppressed volatility. A breakout above 0.000574(upperband)orbelow0.000574(upperband)orbelow0.00048 (lower band) may dictate the next trend. Prepare for sharp moves post-squeeze.

WHITE/USDT – RSI Divergence Signals Potential ReversalWHITE’s RSI (4H) has dipped to 32, nearing oversold territory, while price consolidates above 0.0005185.Bullishdivergenceonthehourlychartsuggestsashort−termreboundtoward0.0005185.Bullishdivergenceonthehourlychartsuggestsashort−termreboundtoward0.000574. Traders could target 5-8% gains with a stop-loss below $0.00050.

WHITE/USDT Technical Breakdown – Key Levels to WatchWhiteRock (WHITE) is testing critical support at **0.0005185∗∗aftera12.530.0005185∗∗aftera12.530.000574, a breach of which could trigger a rally toward $0.0008511.
Volume spikes (541.28M WHITE) indicate accumulation near support. Traders should watch for RSI (not shown) reversals; a dip below 0.000435mayinvalidatebullishsetups.Long−termprospectshingeonreclaiming0.000435mayinvalidatebullishsetups.Long−termprospectshingeonreclaiming0.0009435, aligning with the project’s staking and burn mechanisms. Set stop-losses below $0.00048 for risk management.

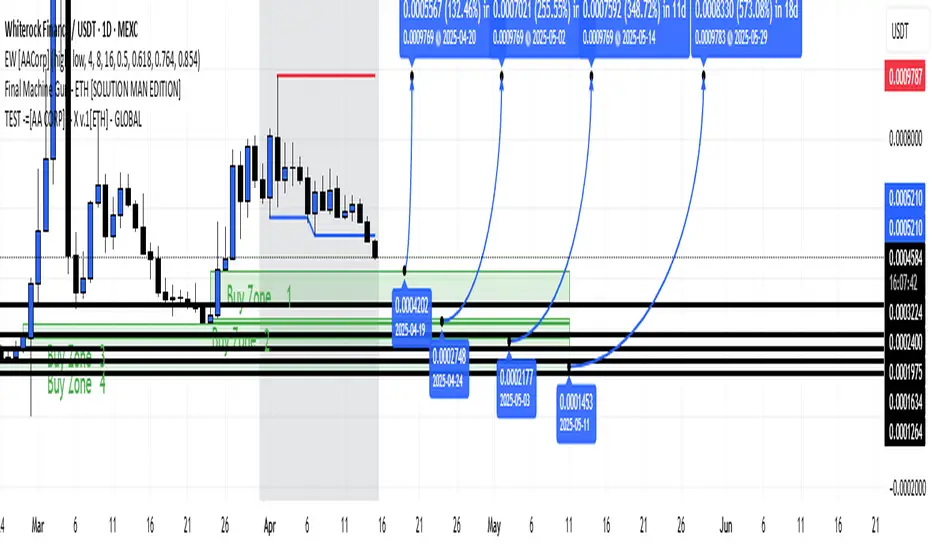
WHITE ROCK's Entry - Buy zone'sThis forecast chart for Ethereum (ETH) against Bitcoin (BTC) on a 4-hour timeframe (EW ) projects potential price movements through 2025. The chart highlights four key "Buy Zones" for ETH/BTC, identified between 0.0001274 and 0.0004022, with specific entry points dated from 2025-04-19 to 2025-11-14. The price is expected to consolidate within these zones before a breakout, targeting a global high of 0.0009797 around 2025-05-29. The forecast also marks a significant resistance at 0.0005210, labeled as the "Final Machine Gun," which aligns with historical highs. The chart suggests a strong bullish trend for ETH/BTC, with a potential 573.8% increase from the lowest buy zone to the peak, spanning an 18-month period. However, the "SOLUTION MAN ENTITY" label and test notation indicate this is a hypothetical or algorithmic projection, not a guaranteed outcome.
Entry: Long at $1,675 (current price on 1m).
Target: $1,839 (FVG and resistance, +9.8% move).
Stop-Loss: $1,650 (below the order block, -1.5% move).