DAX Resilience To Shine ThroughThe DAX Index continues to hold strength just beneath all-time highs, popping higher above 24,000 after three consecutive sessions of gains.
Bulls are keeping control through strong earnings in tech and auto sectors, combined with supportive macro tailwinds. However, the major resistance and previous ATH remain to be tested.
U.S. Interest Rate Path in Focus
The Federal Reserve held rates steady at its July meeting but left the door open for a possible cut in September, should inflation and labor market data soften.
Markets are pricing in an increasing probability of a cut, which is fueling optimism across global equities.
A dovish Fed supports global risk sentiment and weakens the USD, indirectly benefiting European exporters.
ECB Holds, But Dovish Undertone Grows
The European Central Bank left rates unchanged in its latest decision, but ECB President Christine Lagarde acknowledged that “disinflation is progressing” and that further tightening is unlikely.
Forward guidance was interpreted as dovish, with the market now expecting a cut by December, possibly sooner if economic activity remains sluggish.
A dovish ECB lowers borrowing costs and improves equity risk premiums, especially for cyclical-heavy indices like the DAX.
EU–U.S. Trade Tensions
Recent rhetoric from U.S. officials, including renewed tariff threats on European pharmaceutical and automotive exports, has reignited trade tensions.
The EU has signaled its willingness to respond proportionally, but negotiations are ongoing.
While no measures have been enacted yet, uncertainty over trade policy is capping some upside momentum in European equities.
German automakers and industrial exporters are vulnerable to tariffs. Continued trade uncertainty may limit gains unless diplomacy resolves key friction points.
The DAX remains resilient, buoyed by improving fundamentals, strong earnings, and global rate expectations.
The index is coiled just under a key psychological resistance at 24,000, with bulls eyeing a breakout toward the all-time high near 24,639.
Momentum remains favorable, but traders should watch macro headlines and volume closely around resistance zones.
GERMANY40CFD trade ideas

GER4O1. Head of the European Central Bank (ECB)
As of August 2025, Christine Lagarde is the President (head) of the European Central Bank (ECB). She is responsible for leading eurozone monetary policy, representing the ECB at global forums, and setting the tone for financial and economic policy across Europe.
2. Fundamental Drivers of the GER40 (DAX 40)
The GER40, also known as the DAX 40, is Germany's blue-chip stock market index. Its performance is driven by the following key fundamentals in 2025:
Corporate Earnings & Sector Leaders: Major companies like SAP, Siemens, Allianz, and Linde have been driving index gains, contributing a significant portion of the upward momentum due to their market capitalization.
ECB Monetary Policy: Multiple rate cuts by the ECB in 2025 supported German and eurozone equities, lowering yields and easing financing for businesses. Expectations of further rate cuts or stability are closely monitored by the market.
Inflation Dynamics: Falling inflation across the eurozone in 2025 enabled the ECB to move from a restrictive to a more accommodative stance. Latest ECB projections see inflation averaging 2% in 2025 and slightly below target in 2026, allowing monetary loosening to persist.
Energy Prices: Declining natural gas and oil prices provided relief to Germany’s energy-intensive industries, aiding profitability and supporting DAX-listed industrials.
Government Policy & Fiscal Stimulus: Increased defense and infrastructure spending by the new German government under Chancellor Friedrich Merz has boosted selective sectors, including defense (e.g., Rheinmetall).
Global and Domestic Economic Conditions: While the eurozone and German economies have shown resilience with modest GDP growth (ECB forecast: 0.9% growth for 2025), there are headwinds from trade tensions, consumer demand, and sectoral shifts (notably auto and chemicals).
Trade Policy/Geopolitics: Ongoing global trade tensions, new tariffs, and geopolitical uncertainty remain sources of risk and volatility for the index. ECB President Lagarde has repeatedly warned that “trade tariffs are a negative demand shock” and could weigh on German growth prospects.
3. Current Outlook for GER40 (August 2025)
The index gained nearly 22% so far in 2025, surpassing 24,000 and even pushing toward record highs around 24,650. AI-based and institutional forecasters project continued bullish momentum, with most calling for stability or gradual increases but noting the potential for a market correction after strong gains.
Rate cuts, lower energy prices, and corporate strength are the main drivers for the recent rally, while persistent trade risks and sectoral weaknesses remain key downside risks.
Despite economic fragility, especially in manufacturing and energy costs, the DAX/GER40 remains resilient thanks to monetary policy support and selective corporate strength.
4. Recent ECB Actions & Commentary
At the July 2025 meeting, Lagarde and the ECB Governing Council kept rates steady after several cuts earlier in the year, citing moderate growth and disinflation as justification for their stance. The ECB remains “cautiously upbeat,” expecting a 2% average inflation rate and slow but positive economic growth.
The ECB noted that further escalation of trade tensions or unexpected inflation swings could prompt new policy responses.
Summary:
The GER40 is currently driven by accommodative ECB policy under Christine Lagarde, robust earnings from key blue-chip companies, lower energy prices, and government fiscal stimulus. Risks include trade uncertainty, sector-specific downturns, and any reversal in global economic momentum. The ECB’s current president, Christine Lagarde, continues to play a central role in shaping the environment for German and eurozone equities.
WATCH MY DEMAND FLOOR

GER40 – Rebounds Into 23,950 ResistanceFollowing a sharp selloff, GER40 found support near 23,400.00, triggering a strong recovery. Price is now reacting to the 23,950.00 resistance zone, a prior structure level.
Support at: 23,794.52 🔽 | 23,400.00 | 23,025.25
Resistance at: 23,950.00 🔼 | 24,200.00 | 24,300.00 | 24,652.29 (ATH)
🔎 Bias:
🔼 Bullish: Break and close above 23,950.00 opens room for 24,200.00 and higher.
🔽 Bearish: Failure to hold 23,794.52 may expose 23,400.00 and 23,025.25.
📛 Disclaimer: This is not financial advice. Trade at your own risk.


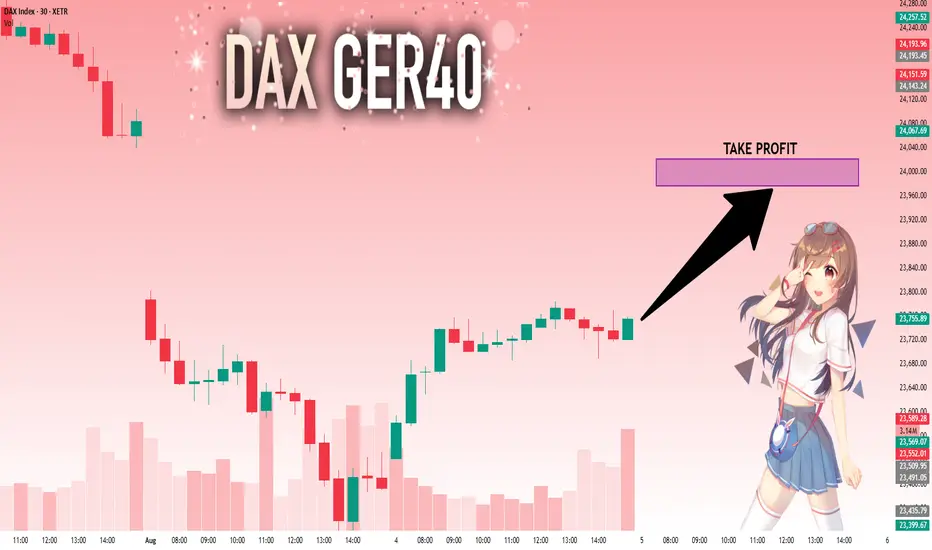
DAX: Bulls Are Winning! Long!
My dear friends,
Today we will analyse DAX together☺️
The market is at an inflection zone and price has now reached an area around 23,755.89 where previous reversals or breakouts have occurred.And a price reaction that we are seeing on multiple timeframes here could signal the next move up so we can enter on confirmation, and target the next key level of 23,976.72.Stop-loss is recommended beyond the inflection zone.
❤️Sending you lots of Love and Hugs❤️
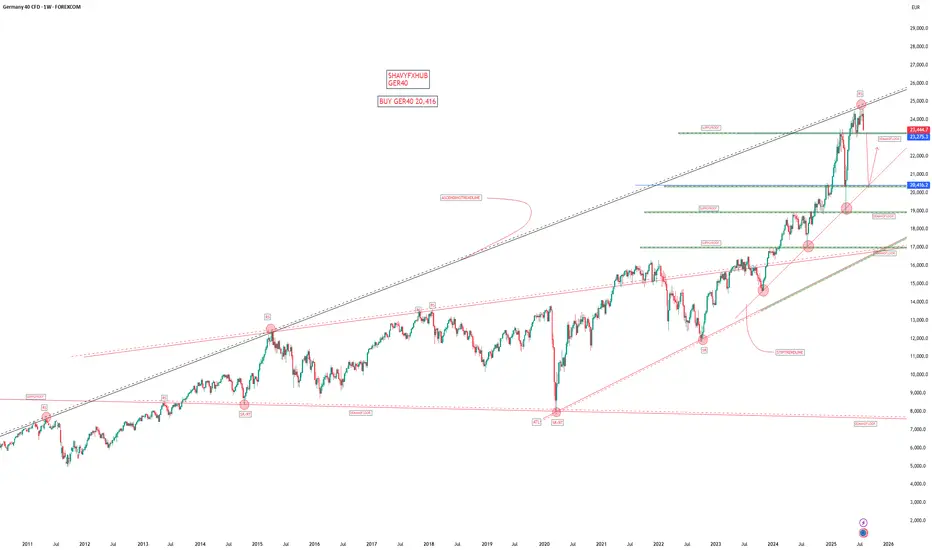
DE40 Breakout Robbery – Bullish Setup Revealed!💣 DE40 / GER40 INDEX BREAKOUT RAID 🚨
🌟 Hi! Hola! Ola! Bonjour! Hallo! Marhaba! 🌟
Dear Market Robbers, Money Makers, and Chart Bandits 🕶️💰💣,
We’re rollin' out our latest Thief Trader Heist Plan based on laser-sharp technical + fundamental recon 🧠💼 on the Germany DE40 / GER40 Index. It’s time to gear up and break the resistance vault 🏦💥
🎯 THE MASTER HEIST SETUP: LONG ONLY 🎯
📈 Entry Setup:
"The heist is on! Wait for breakout & retest near 24600 🔓.
Once confirmed, GO BULLISH and snatch that market loot!"
✅ Use Buy Stop above resistance
✅ (OR) Buy Limit from pullback zones using 15m–30m swing lows/highs
🎯 DCA / Layered limit entries for optimal robbery!
🔔 Set Alerts: Don't sleep on this! Mark your alarms to catch the breakout.
🛑 STOP LOSS: PLAY IT SMART, NOT EMOTIONAL
🗣️ "Don’t drop your SL before the breakout—wait for the confirmation candle. Place it smart based on your entry lot size & risk."
📍Thief SL Plan: Below the recent 4H wick swing low – around 21700
🔒 Protect the loot once you're in the trade!
🏁 TARGET: TIME TO ESCAPE THE SCENE
🎯 Primary Profit Vault: 25500
🛫 Escape earlier if signs of resistance emerge. A clean get-away is the goal!
🔪 SCALPERS MODE: ONLY LONG SIDE
💰 Got the funds? Feel free to enter early.
💼 Otherwise, team up with swing traders. Use Trailing SL to guard your treasure.
🔎 FUNDAMENTALS BACKING THIS HEIST
📊 GER40 shows bullish momentum backed by:
Global macro optimism
Strong Eurozone data
Risk-on flows into European indices
Technical chart breakout formations
📰 Get full market breakdowns (COT, Macro, Intermarket, Sentiment, etc.) – Check your trusted sources and confirm your targets.
🚨 TRADING ALERT: STAY ALERT DURING NEWS
⚠️ Big news = high volatility! Follow the robbery code:
Avoid new trades during major news drops
Trail SLs on running positions
Stay glued to live updates!
❤️ SUPPORT THE THIEF CREW
If this plan helped you, hit that BOOST 🚀
Let’s keep raiding the charts, stacking profits like pros 🏆
Join the Thief Crew, where we rob the market... not dreams.
🎭 Until the next plan… stay sneaky, stay profitable. 🐱👤💸💥

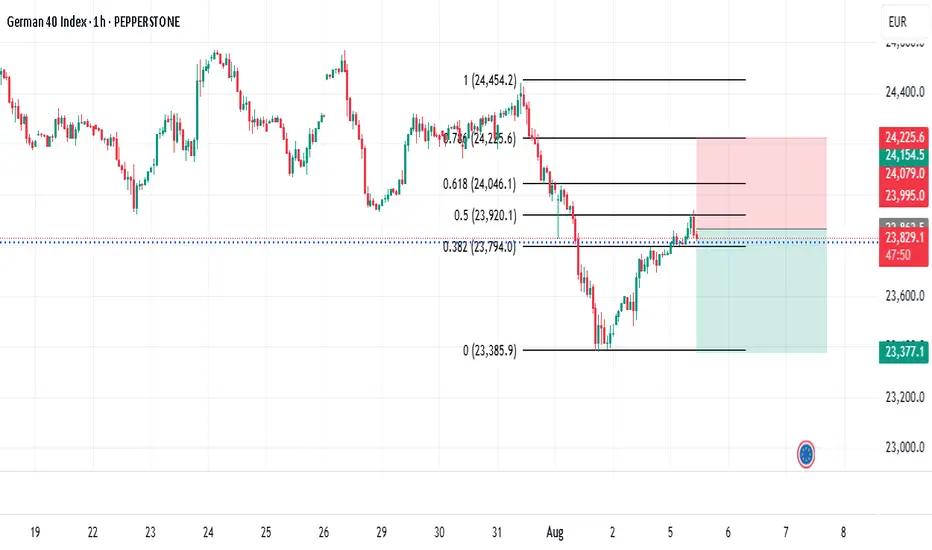
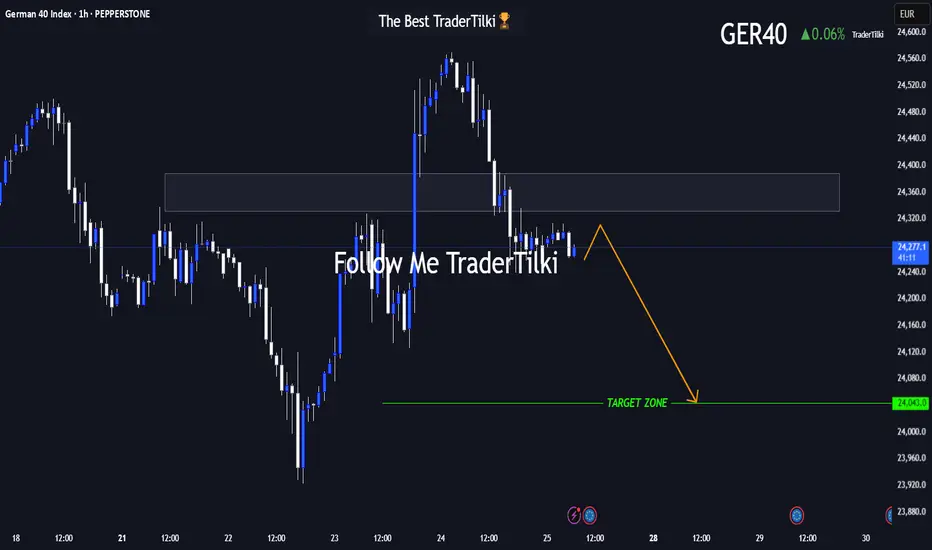
GER40 in Motion: This Setup Speaks Volumes 🌅 Good morning, my friends,
I’ve put together a fresh GER40 analysis just for you. Even if the 1-hour timeframe shows some upward momentum, I fully expect the price to reach my target level of **24,050**.
I'm holding firm until that level is hit.
Every single like from you is a massive source of motivation for me to keep sharing analysis. Huge thanks to everyone supporting with a tap!
Falling WedgeThe price formed a falling wedge after a bullish impulse, now the price has broken out followed by a pullback and now the price looks to continue its bullish run
WE ONLY TRADE PULLBACKS


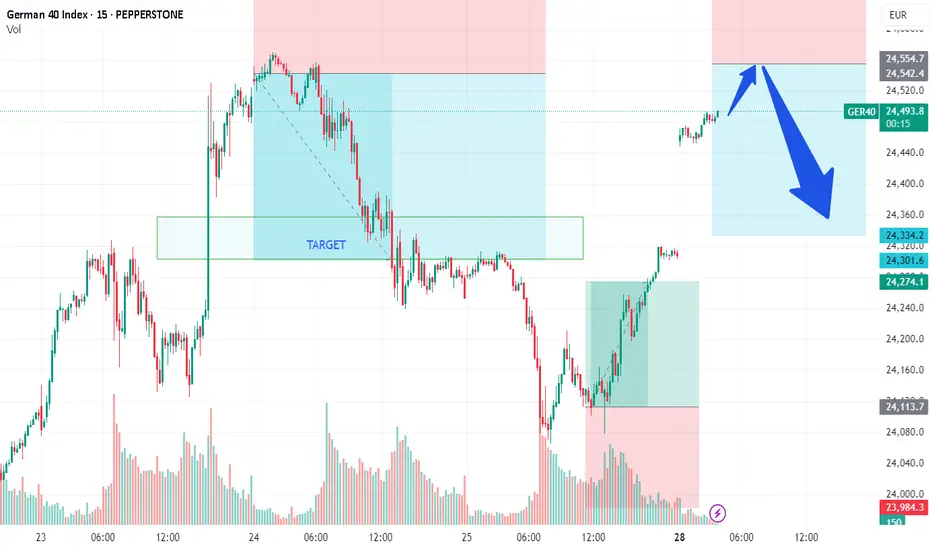
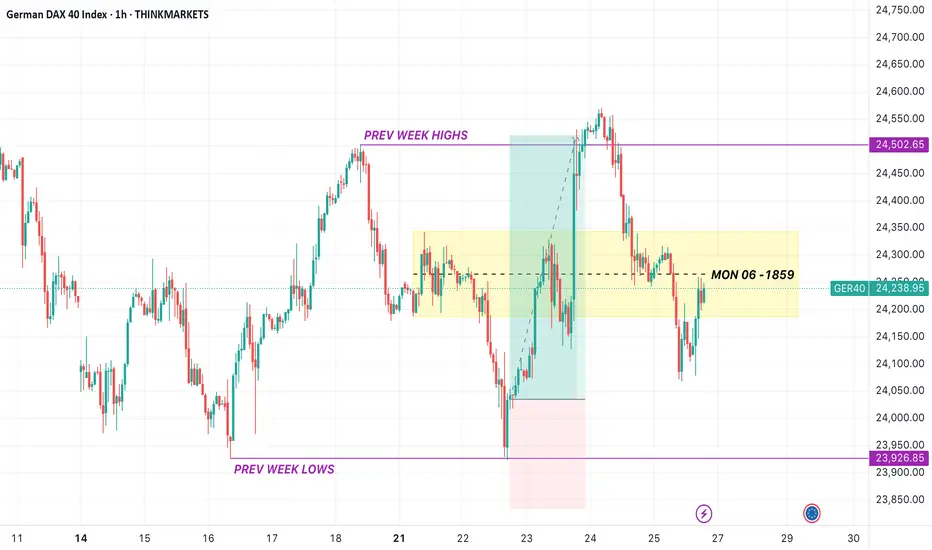
DAX/GER - PREPARE TO SHORT on DAX market opening Team,
We all know that the European Union and the United States agreed on Sunday to a broad trade deal that sets a 15 per cent tariff on most E.U. goods, including cars and pharmaceuticals.
The 27-nation bloc also agreed to increase its investment in the United States by more than $600 billion above current levels.
If the DEAL does not go through, it would be nasty to the market—especially to the Europeans, who are likely to get hurt by the export cost to the United States, especially the Car. The EUROPEAN is currently facing many challenges from Chinese car manufacturing.
We have been trading very well with the DAX in the past. We expect that when the market opens, we should short-range at 24530-60 - GET READY.
Stop loss at 24620-50
Please NOTE: once the price pulls back toward 24475-50, bring our STOP LOSS TO BE (Break even)
Our 1st target at 24425-24400
2nd Target at 24350-24300
Last Friday, in OUR LIVE TRADING, we mentioned that LONG DAX at 24100
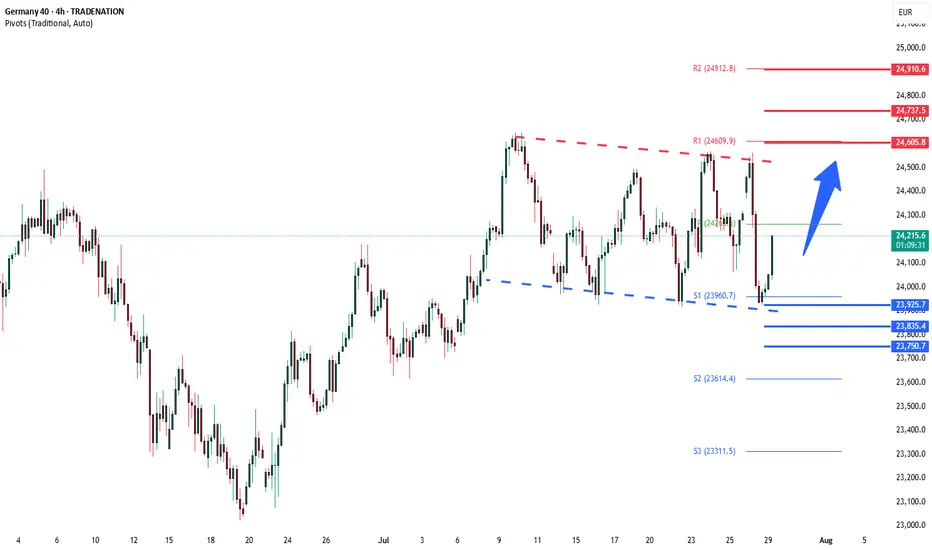
DAX oversold rally support at 23925The DAX remains in a bullish trend, with recent price action showing signs of a corrective pullback within the broader uptrend.
Support Zone: 23925 – a key level from previous consolidation. Price is currently testing or approaching this level.
A bullish rebound from 23925 would confirm ongoing upside momentum, with potential targets at:
24605 – initial resistance
24740 – psychological and structural level
24910 – extended resistance on the longer-term chart
Bearish Scenario:
A confirmed break and daily close below 23925 would weaken the bullish outlook and suggest deeper downside risk toward:
23835 – minor support
23750 – stronger support and potential demand zone
Outlook:
Bullish bias remains intact while the DAX holds above 23925. A sustained break below this level could shift momentum to the downside in the short term.
This communication is for informational purposes only and should not be viewed as any form of recommendation as to a particular course of action or as investment advice. It is not intended as an offer or solicitation for the purchase or sale of any financial instrument or as an official confirmation of any transaction. Opinions, estimates and assumptions expressed herein are made as of the date of this communication and are subject to change without notice. This communication has been prepared based upon information, including market prices, data and other information, believed to be reliable; however, Trade Nation does not warrant its completeness or accuracy. All market prices and market data contained in or attached to this communication are indicative and subject to change without notice.
GER40 | Consolidation Range 24,600 – 24,000 With Breakout TargetGER40 is consolidating within a clear range between 24,600 resistance and 24,000 support. The lower boundary (24,000) aligns with the 61.8% Fibonacci retracement from the 23,050 → 24,600 impulse leg. A confirmed breakout above the range projects a measured move target of 25,197.2, which is derived from the 600-point height of the range between 24,000 and 24,600.
Support at: 24,000.00 / 23,678.5 / 23,050.00 🔽
Resistance at: 24,600.00 🔼
Range Target: 25,197.2 🎯
🔎 Bias:
🔼 Bullish: Clean break and hold above 24,600 confirms range breakout with target at 25,197.2.
🔽 Bearish: Break below 24,000 brings 23,678.5 and 23,050 into view.
📛 Disclaimer: This is not financial advice. Trade at your own risk.

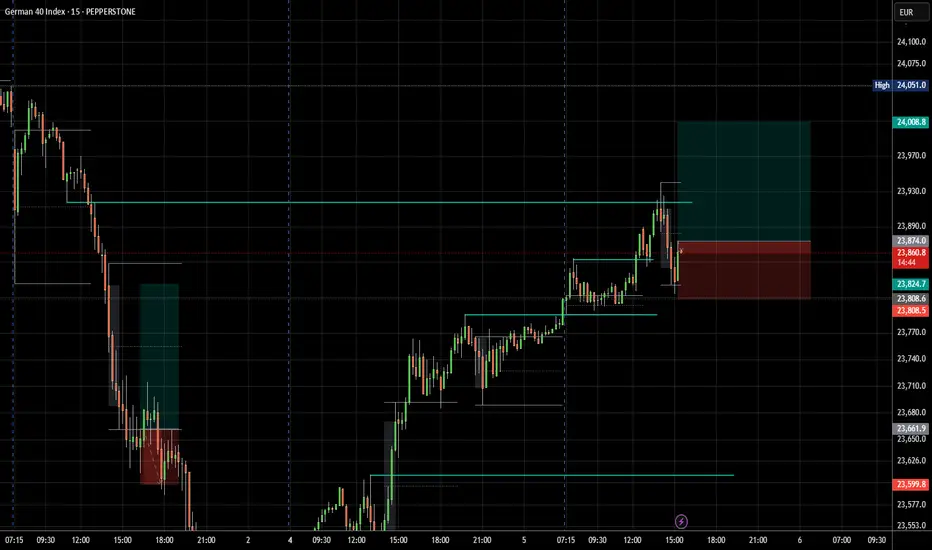
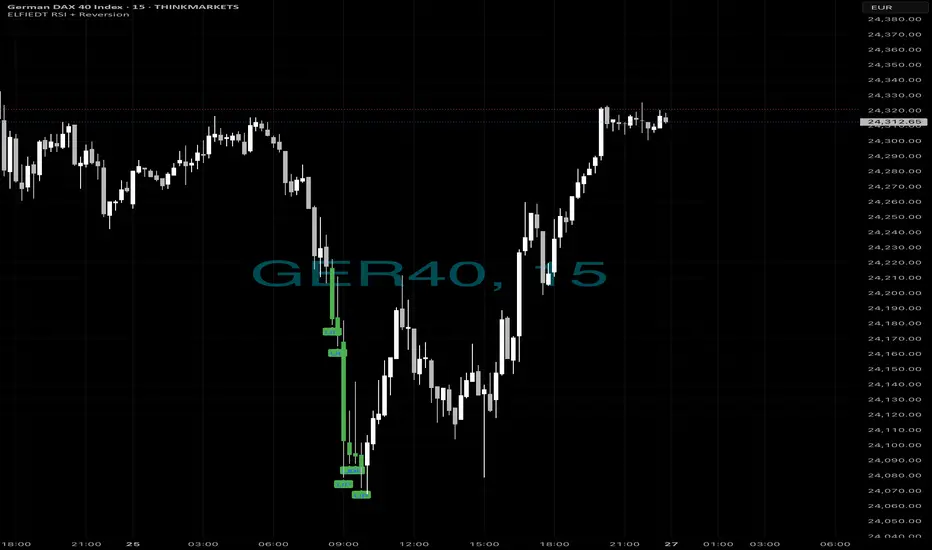
Same as always….📈 The Market Crashed. We Bought the Bottom. Again. 💥
Just another 15-minute chart… or is it?
While panic hit the DAX this morning, ELFIEDT RSI + Reversion was calmly printing BUY after BUY at the dead low. No guessing. No hype. Just precision.
✅ 5 Buy signals within minutes
✅ Picture-perfect mean reversion
✅ Price soared right after
✅ ZERO lag. ZERO repaint.
If you missed this move, don’t worry — this is what my system does.
🧠 Want to learn the logic behind this?
💰 Want to use it live on your own charts?
👉 Drop a 🔥 below if you want access.
👉 DM me “ELFIEDT” to test it out.
👉 Follow for real, repeatable setups.
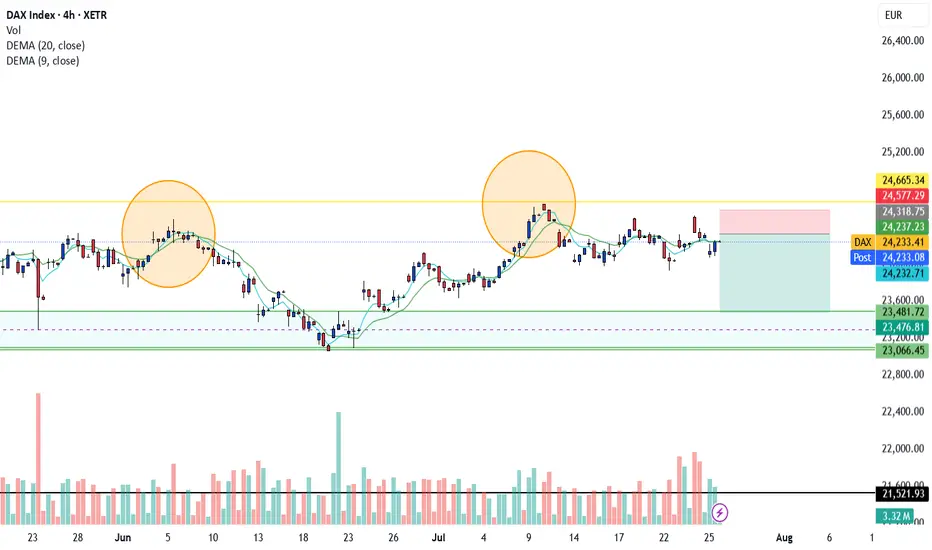
DAX Bearichthe complete set up shoxs that Dax is ranging inside the internal zone , creating a double top on the 4H time frame, witing for the smal trigger to short the position
Trendline BreakThe price has broken a bullish trendline followed by a pullback and now the price looks to go short
WE ONLY TRADE PULLBACKS

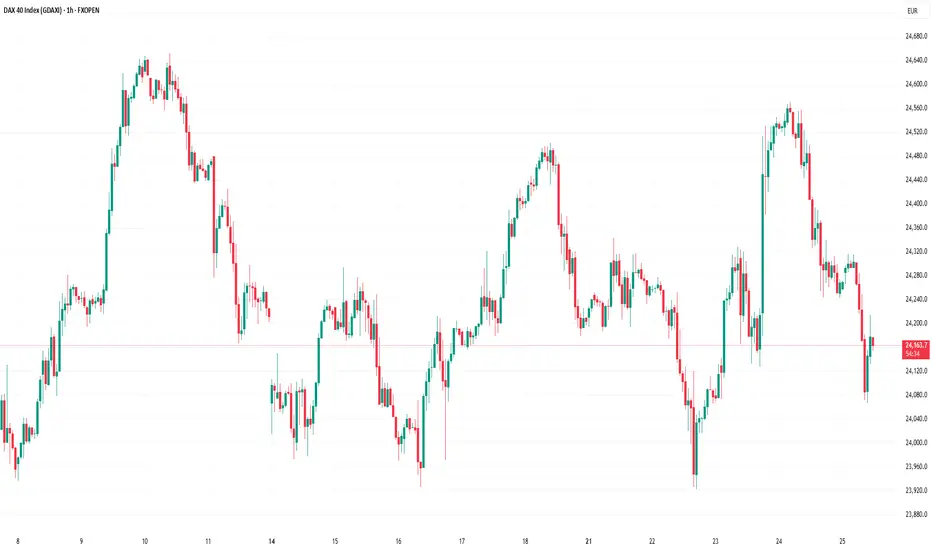
The DAX Index Is Losing Its Bullish MomentumThe DAX Index Is Losing Its Bullish Momentum
At the end of May, we noted that the German stock index DAX 40 was exhibiting significantly stronger performance compared to other global equity indices. However, we also highlighted the 24,100 level as a strong resistance zone.
Two months have passed, and the chart now suggests that bearish signals are intensifying.
From a technical analysis perspective, the DAX 40 formed an ascending channel in July (outlined in blue). However, each time the bulls attempted to push the price above the 24,460 level (which corresponds to the May high), they encountered resistance.
It is worth noting the nature of the bearish reversals (indicated by arrows) – the price declined sharply, often without intermediate recoveries, signalling strong selling pressure. It is likely that major market participants used the proximity to the all-time high to reduce their long positions.
From a fundamental standpoint, several factors are weighing on the DAX 40:
→ Ongoing uncertainty surrounding the US–EU trade agreement, which has yet to be finalised (with the deadline approaching next week);
→ Corporate news, including disappointing earnings reports from Puma, Volkswagen, and several other German companies.
Given the above, it is reasonable to assume that bearish activity could result in an attempt to break below the lower boundary of the ascending blue channel.
This article represents the opinion of the Companies operating under the FXOpen brand only. It is not to be construed as an offer, solicitation, or recommendation with respect to products and services provided by the Companies operating under the FXOpen brand, nor is it to be considered financial advice.
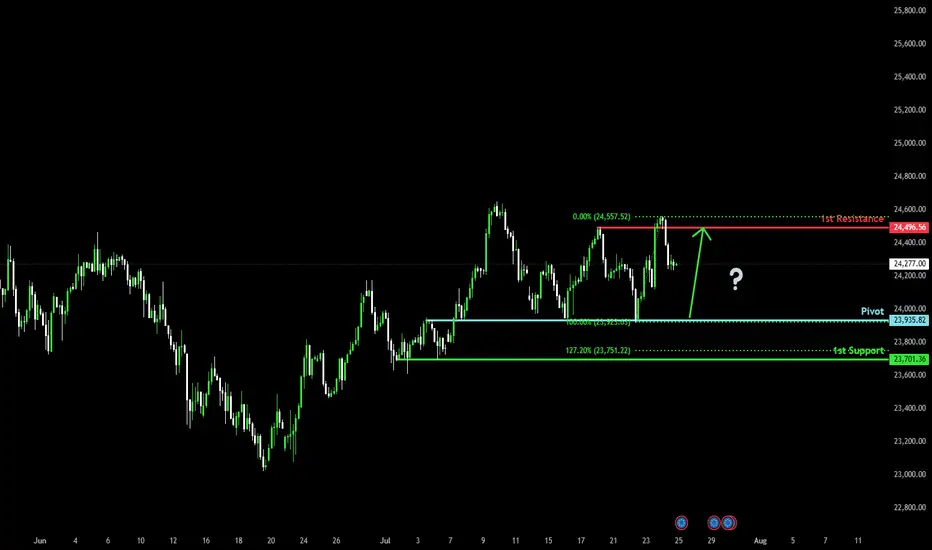
Bullish bounce off major support?DAX40 (DE40) is falling towards the pivot, which has been identified as an overlap support and could bounce to the 1st resistance.
Pivot: 23,935.82
1st Support: 23,701.36
1st Resistance: 24,496.56
Risk Warning:
Trading Forex and CFDs carries a high level of risk to your capital and you should only trade with money you can afford to lose. Trading Forex and CFDs may not be suitable for all investors, so please ensure that you fully understand the risks involved and seek independent advice if necessary.
Disclaimer:
The above opinions given constitute general market commentary, and do not constitute the opinion or advice of IC Markets or any form of personal or investment advice.
Any opinions, news, research, analyses, prices, other information, or links to third-party sites contained on this website are provided on an "as-is" basis, are intended only to be informative, is not an advice nor a recommendation, nor research, or a record of our trading prices, or an offer of, or solicitation for a transaction in any financial instrument and thus should not be treated as such. The information provided does not involve any specific investment objectives, financial situation and needs of any specific person who may receive it. Please be aware, that past performance is not a reliable indicator of future performance and/or results. Past Performance or Forward-looking scenarios based upon the reasonable beliefs of the third-party provider are not a guarantee of future performance. Actual results may differ materially from those anticipated in forward-looking or past performance statements. IC Markets makes no representation or warranty and assumes no liability as to the accuracy or completeness of the information provided, nor any loss arising from any investment based on a recommendation, forecast or any information supplied by any third-party.
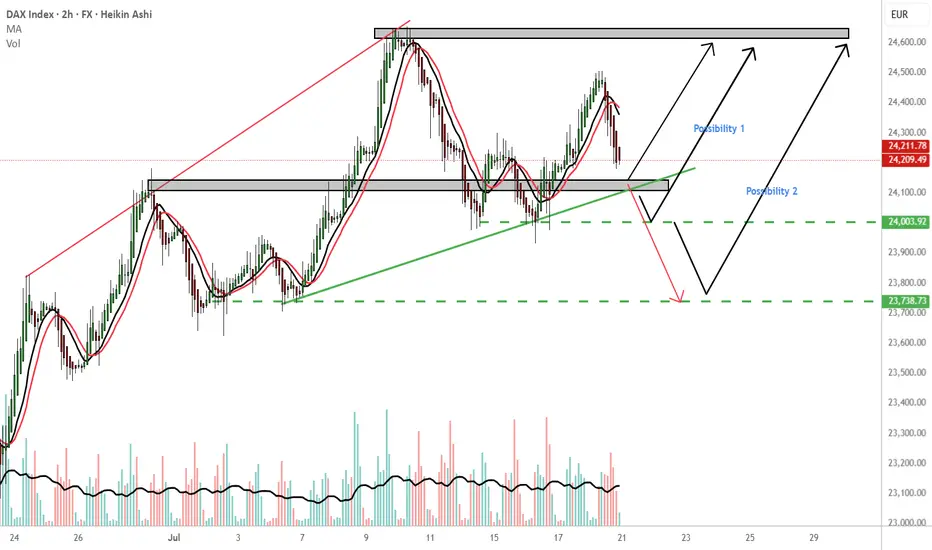
GER 30 endless possibilitiesMy most immediate outcome is reversal 24,140 price area. TP:24,600
Possibility 1: If Ger 30 holds the 24,000 price area i would consider a buy to 24,600.
Possibility 2: If Ger30 holds the 23,730 price area that would be another possibility for a buy. TP 24,600.
WCS: Worst case scenario, continuation downwards from the 24140 PL. Consider the red arrow. The 24,140 is a important price area please wait for confirmation
Please follow your trading plan.
THOUGHTS????
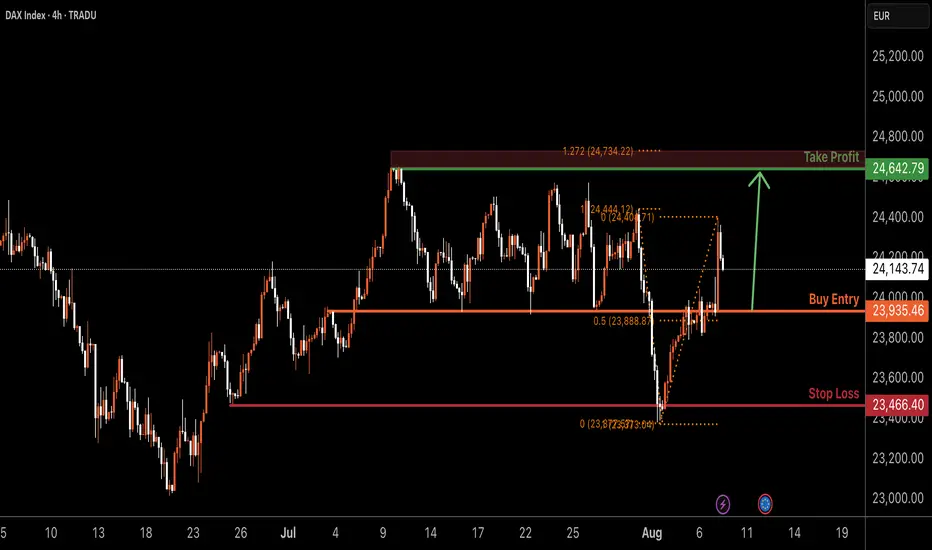
GER30 H4 | Bullish bounce off overlap supportGER30 is falling towards the buy entry at 23,935.46, which is an overlap support that lines up with the 50% Fibonacci retracement and could bounce from this level to the upside.
Stop loss is at 23,466.40, which is a multi-swing low support.
Take profit is at 24,642.79, which is a swing high resistance that is slightly below the 127.2% Fibonacci extension.
High Risk Investment Warning
Trading Forex/CFDs on margin carries a high level of risk and may not be suitable for all investors. Leverage can work against you.
Stratos Markets Limited (tradu.com ):
CFDs are complex instruments and come with a high risk of losing money rapidly due to leverage. 65% of retail investor accounts lose money when trading CFDs with this provider. You should consider whether you understand how CFDs work and whether you can afford to take the high risk of losing your money.
Stratos Europe Ltd (tradu.com ):
CFDs are complex instruments and come with a high risk of losing money rapidly due to leverage. 66% of retail investor accounts lose money when trading CFDs with this provider. You should consider whether you understand how CFDs work and whether you can afford to take the high risk of losing your money.
Stratos Global LLC (tradu.com ):
Losses can exceed deposits.
Please be advised that the information presented on TradingView is provided to Tradu (‘Company’, ‘we’) by a third-party provider (‘TFA Global Pte Ltd’). Please be reminded that you are solely responsible for the trading decisions on your account. There is a very high degree of risk involved in trading. Any information and/or content is intended entirely for research, educational and informational purposes only and does not constitute investment or consultation advice or investment strategy. The information is not tailored to the investment needs of any specific person and therefore does not involve a consideration of any of the investment objectives, financial situation or needs of any viewer that may receive it. Kindly also note that past performance is not a reliable indicator of future results. Actual results may differ materially from those anticipated in forward-looking or past performance statements. We assume no liability as to the accuracy or completeness of any of the information and/or content provided herein and the Company cannot be held responsible for any omission, mistake nor for any loss or damage including without limitation to any loss of profit which may arise from reliance on any information supplied by TFA Global Pte Ltd.
The speaker(s) is neither an employee, agent nor representative of Tradu and is therefore acting independently. The opinions given are their own, constitute general market commentary, and do not constitute the opinion or advice of Tradu or any form of personal or investment advice. Tradu neither endorses nor guarantees offerings of third-party speakers, nor is Tradu responsible for the content, veracity or opinions of third-party speakers, presenters or participants.