NASDAQ 100 Long 21,900Target to the upside 21,900. We initially highlighted NASDAQ will reach 22,000 then see a bearish turn. Refer to linked Idea.
USTECH100CFD trade ideas

NAS100 Bullish Trend Still IntactPrice being in resistance zones should not be an automatic sign that we should start selling. The trend is still bullish until we see clear signs of a reversal.

USNAS100 | Breakout or Breakdown?USNAS100 | OVERVIEW
The price is currently stabilizing below the pivot level at 21790, suggesting continued bearish momentum.
📉 As long as the index remains below 21790, we expect a decline toward 21635. A confirmed 1H candle close below this level could extend the bearish trend toward 21470.
📈 A shift to bullish momentum will require a 1H candle close above 21820, which could open the way to 22090 and potentially a new all-time high at 22200.
Support Lines: 21635, 21470
Resistance Lines: 21930, 22090, 22200


NDX its a short for like month?this is only an Idea !
due to many fvg's and gaps this is more likely to happen
you can see the long 30d / 40d target on chart

NASDAQ Potential UpsidesHey Traders, in today's trading session we are monitoring NAS100 for a buying opportunity around 21,700 zone, NASDAQ is trading in an uptrend and currently is in a correction phase in which it is approaching the trend at 21,700 support and resistance area.
Trade safe, Joe.


BUY POSITIONToday im looking at buy positions to the highlighted target continue to make higher highs

NasDaq100 CPI Break-Down NasDaq100 price broke resistance level at $22,006. We waited for price to correct back to resistance level then we entered buy's when continued above $22,006.


Staircase seen in real chartsFor the most part OANDA:NAS100USD has exhibited a near perfect staircase up so far.
It does appear fairly extended right now, but with rotation out of safe havens into risk on assets again, what remains to be seen is how much fuel is in the tank, and how far can the tailwind take it.

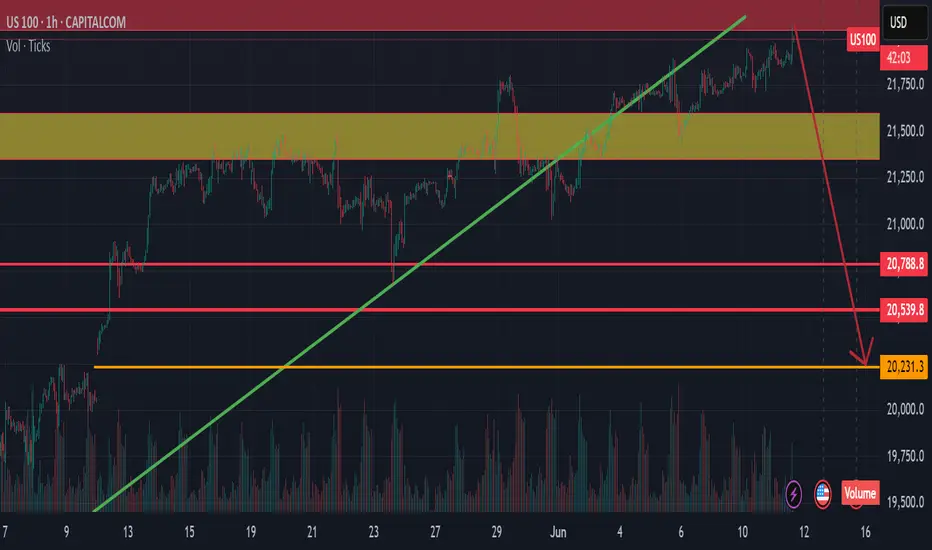
Sell NAS100 market resetSelloff has started at the 22000 zone
Should the GAP at 20231 zone fail to hold we will see more sellers coming in.
Hoping bears win this one.

NSDQ100 INTRADAY awaits US CPI data Trade:
The US and China agreed on a basic plan to restart trade in sensitive goods. China will speed up rare earth exports, and the US may ease some export rules. The deal still needs approval from Trump and Xi. A court also ruled Trump can keep his global tariffs for now. Markets dipped due to the lack of details, and focus is now on US inflation data.
Protests:
LA had a quieter night after setting a downtown curfew. Anti-ICE protests spread to more cities. Trump’s move to send the military to LA is drawing controversy.
Key Support and Resistance Levels
Resistance Level 1: 22070
Resistance Level 2: 22370
Resistance Level 3: 22680
Support Level 1: 21300
Support Level 2: 21060
Support Level 3: 20820
This communication is for informational purposes only and should not be viewed as any form of recommendation as to a particular course of action or as investment advice. It is not intended as an offer or solicitation for the purchase or sale of any financial instrument or as an official confirmation of any transaction. Opinions, estimates and assumptions expressed herein are made as of the date of this communication and are subject to change without notice. This communication has been prepared based upon information, including market prices, data and other information, believed to be reliable; however, Trade Nation does not warrant its completeness or accuracy. All market prices and market data contained in or attached to this communication are indicative and subject to change without notice.

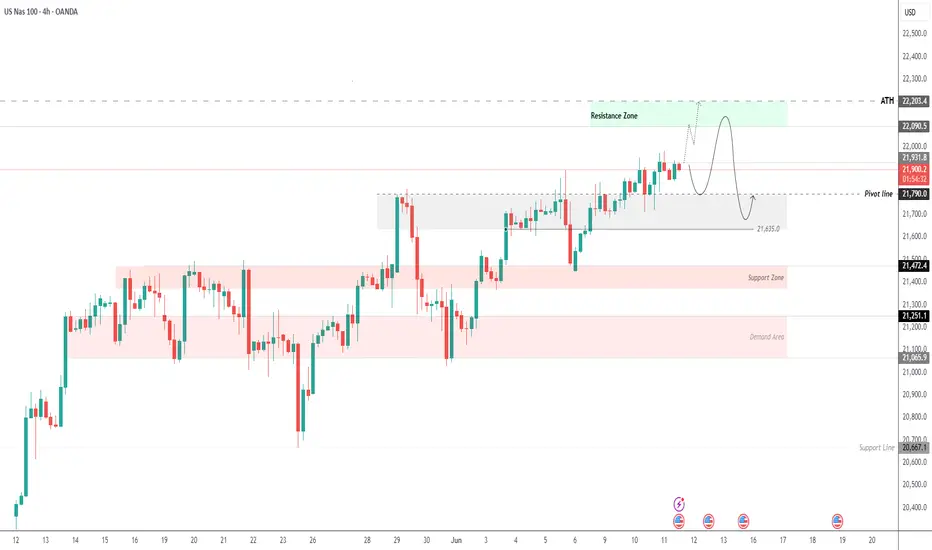
USNAS100 | CPI Data to Drive Next Move – Key Pivot at 21790USNAS100 | OVERVIEW
The index is showing sensitive price action, especially after stabilizing above the pivot level at 21790. The release of U.S. CPI data will likely dominate today's movements.
If CPI > 2.5%:
Stronger inflation could pressure the index lower. A drop toward 21790 is expected, and a break below this level may extend the bearish trend toward 21635, and possibly 21480. However, holding above 21790 may keep the bullish structure intact.
If CPI < 2.5%:
Weaker-than-expected inflation would support bullish momentum, with potential to push higher toward 22090 and test the all-time high at 22200.
Support Lines: 21790, 21635, 21480
Resistance Lines: 22090, 22200
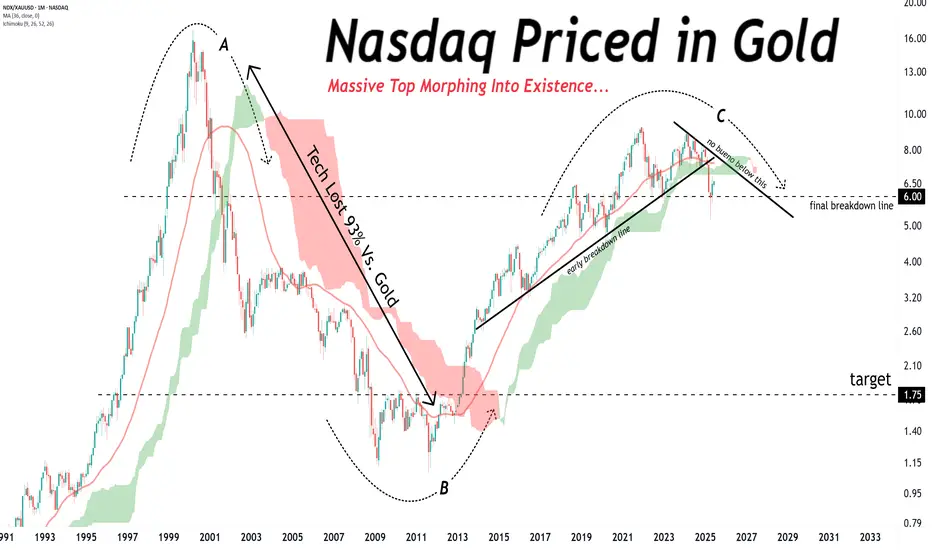
NASDAQ PRICED IN GOLD FORMING A MASSIVE TOP.NASDAQ PRICED IN GOLD FORMING A MASSIVE TOP.
If history rhymes… tech could bleed value while Gold continues to shine.
Final breakdown nearing, where you would expect the Nasdaq to fall as this gets confirmed.
Nasdaq 100 Approaching Breakout Zone! | Key Levels to Watch The Nasdaq 100 has been on a steady bullish trend since mid-April, respecting a beautiful ascending trendline shown in blue. As of now, the price is sitting at 21,905, right under a critical resistance zone around 21,920–21,950.
Here are the key levels marked on the chart:
🔹 Resistance:
21,920–21,950 (current testing zone)
21,139.82 (previous local high)
🔹 Support Zones:
20,599.44
20,056.10
19,889.50
18,161.32 (major swing low)
🔹 Trendline Support:
Starting from April lows, this trendline continues to hold as dynamic support, adding to the bullish momentum.
---
📊 Price Action Insights:
✅ Bullish structure with higher highs and higher lows
✅ Strong bullish candles leading into resistance
✅ Consolidation near the highs — potential breakout brewing
✅ Price staying above the 20,599 and 20,056 key support zones
---
🧨 Potential Trade Setups:
📈 Bullish Breakout Scenario:
A clean break and close above 21,950 on the 4H could trigger a bullish run toward 22,200+.
📉 Rejection Scenario:
Failure to break above this zone might lead to a retest of 20,599.44 or the trendline support for a better entry.
---
📌 Key Events to Watch:
🇺🇸 US Market Holidays and Data Releases (circled in red) could add volatility — stay alert!
---
🗣️ What’s Your Bias?
🔽 Do you think Nasdaq will break higher or retrace back to the trendline support?
💬 Drop your analysis below! Let’s discuss 💬
👍 Like & Follow if you find this helpful – more setups coming soon!
#NASDAQ100 #NDQ100 #TechnicalAnalysis #PriceAction #TradingView #StockMarket #BreakoutTrading #Trendline #SupportAndResistance #FrankFx14

US100 Local Short! Sell!
Hello,Traders!
US100 keeps growing but
The index will soon hit a
Horizontal resistance
Of 22,243 so after the
Retest we will be expecting
A local pullback and a
Local move down
Sell!
Comment and subscribe to help us grow!
Check out other forecasts below too!
Disclosure: I am part of Trade Nation's Influencer program and receive a monthly fee for using their TradingView charts in my analysis.

USTECUSTEC price is now near the resistance zone 21916-22226. If the price cannot break through the 22226 level, it is expected that the price will drop. Consider selling the red zone.
🔥Trading futures, forex, CFDs and stocks carries a risk of loss.
Please consider carefully whether such trading is suitable for you.
>>GooD Luck 😊
❤️ Like and subscribe to never miss a new idea!

Sniper Smart money NASDAQ 🎯 SNIPER SIGNAL – NASDAQ (NAS100)
📅 Date: June 11, 2025
⏱ Timeframe: 1H (H1)
📉 Type: Sell
📍 Entry (SELL): 21,950 – 21,970
⛔ Stop Loss: 22,050
🎯 Take Profit 1: 21,700
🎯 Take Profit 2: 21,450
📊 Risk/Reward ≈ 1:2
🧠 Smart Money Analysis:
✅ Liquidity sweep above 21,950–21,970
✅ Bearish BOS confirmed on 1H
✅ H1 imbalance zone not filled
✅ RSI shows bearish divergence
✅ Order block rejection at 21,900–21,950
💬 Confirmation: await H1 close below ~21,900
🔒 Always use effective risk management
📌 Signal by: **@Talion-Promosale**
(Personal analysis – not financial advice)
#NAS100 #NASDAQ #SniperSignal #SmartMoney #TradingView #TalionPromosale

Sniper NASDAQ 🎯 SNIPER SIGNAL – NASDAQ (NAS100)
📅 Date: June 11, 2025
⏱ Timeframe: 1H (H1)
📉 Type: Sell
📍 Entry (SELL): 19,270 – 19,300
⛔ Stop Loss: 19,370
🎯 Take Profit 1: 19,100
🎯 Take Profit 2: 18,950
📊 Risk/Reward ≈ 1:2
🧠 Smart Money Analysis:
✅ Liquidity grab above the 19,300 key level
✅ Bearish Break of Structure (BOS) confirmed on 1H
✅ H1 imbalance zone not yet mitigated
✅ Bearish RSI divergence
✅ Strong rejection from institutional order block on H1
💬 Confirmation: Wait for 1H candle to close below 19,250 for extra confirmation
🔒 Risk management is essential
📌 Signal posted by: **@Talion-Promosale**
(Personal analysis – not financial advice)
#NAS100 #NASDAQ #SniperSignal #SmartMoney #TradingView #TalionPromosale

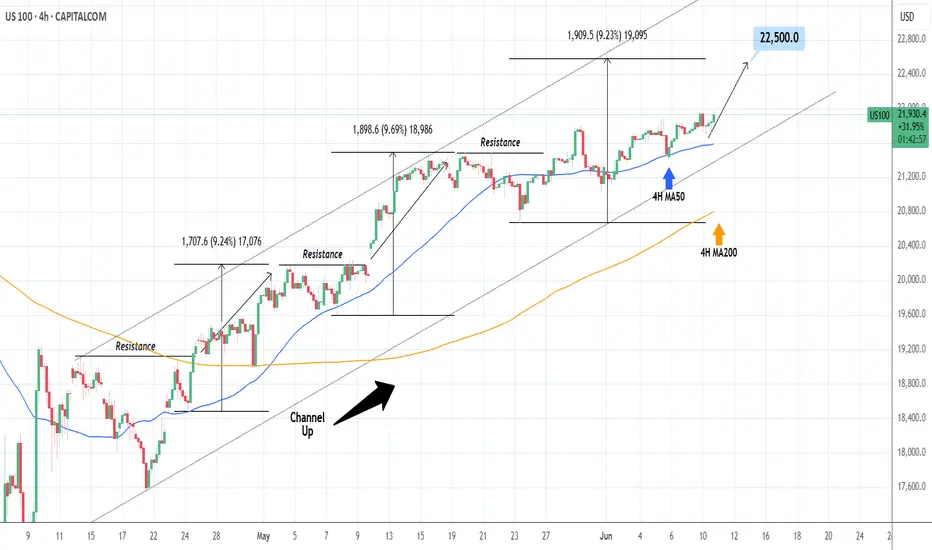
NASDAQ: Close to a strong bounce.Nasdaq is about to turn overbought on its 1D technical outlook (RSI = 68.736, MACD = 505.460, ADX = 18.046) as it is extending an uptrend since the 4H MA50 test/bounce. Such low paced price increase typically precedes strong breakouts. Since the long term pattern is a Channel Up, we are still on its 3rd bullish wave overall. The prior ones were +9.50% on avg, so we remain bullish on the short term, TP = 22,500.
## If you like our free content follow our profile to get more daily ideas. ##
## Comments and likes are greatly appreciated. ##
Hanzo / Nas100 15 Min ( Accurate Tactical Bullish Break Out )🔥 Nas100 – 15 Min Scalping Analysis
⚡️ Objective: Precision Breakout Execution
Time Frame: 15-Minute Warfare
Entry Mode: Only after verified breakout — no emotion, no gamble.
👌Bullish After Break : 21920 / Break out done
Price must break liquidity with high volume to confirm the move.
☄️ Hanzo Protocol: Dual-Direction Entry Intel
➕ Zone Activated: Strategic liquidity layer detected — mapped through refined supply/demand mechanics. Volatility now rising. This isn’t noise — this is bait for the untrained. We're not them.
