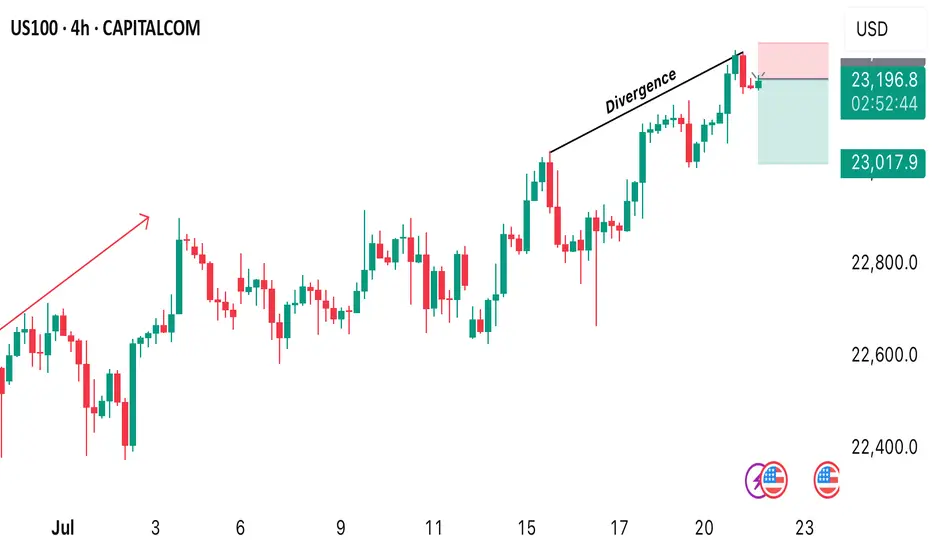
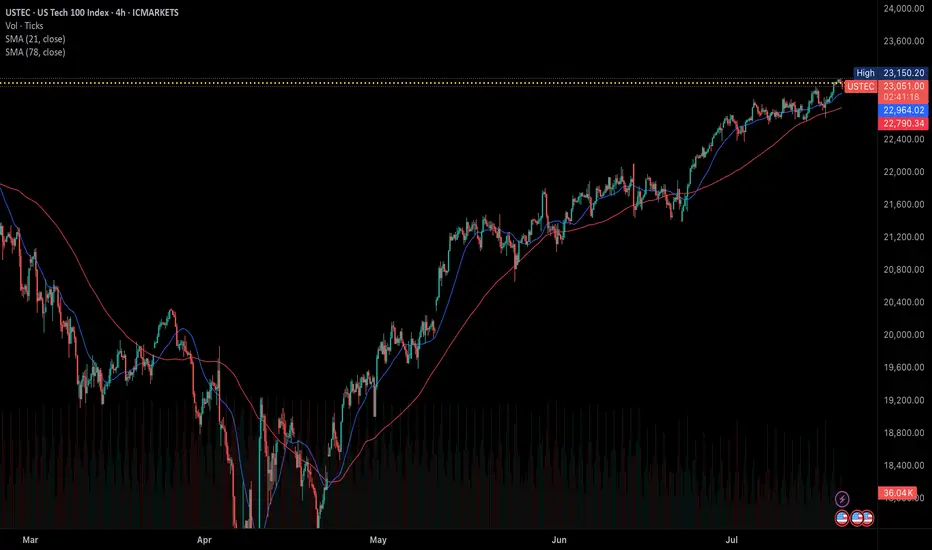
Nasdaq Index (US100 / NASDAQ):The Nasdaq index continues to move in a medium- to long-term uptrend, recently testing the 23,000 support zone and bouncing upward.
🔹 Bearish Scenario:
If the price breaks and closes below 23,000, it may lead to a decline toward 22,920, followed by a deeper move toward 22,650.
🔹 Bullish Scenario:
If the price holds above 23,200, further upside toward a new high around 23,400 is likely.
⚠️ Disclaimer:
This analysis is for educational purposes only and does not constitute financial advice. Always monitor the markets and perform your own due diligence before making any investment decisions.
USTECH100CFD trade ideas

NASDAQ Potential UpsidesHey Traders, in tomorrow's trading session we are monitoring NAS100 for a buying opportunity around 22,780 zone, NASDAQ is trading in an uptrend and currently is in a correction phase in which it is approaching the trend at 22,780 support and resistance area.
Trade safe, Joe.

NasdaqCOT data shows large speculators increasing net long positions on the Nasdaq-100, reflecting rising institutional confidence in tech and growth sectors. This positioning supports a bullish bias, especially as price holds above key moving averages and market breadth improves.

NAS 100 Potential PullbackHi there,
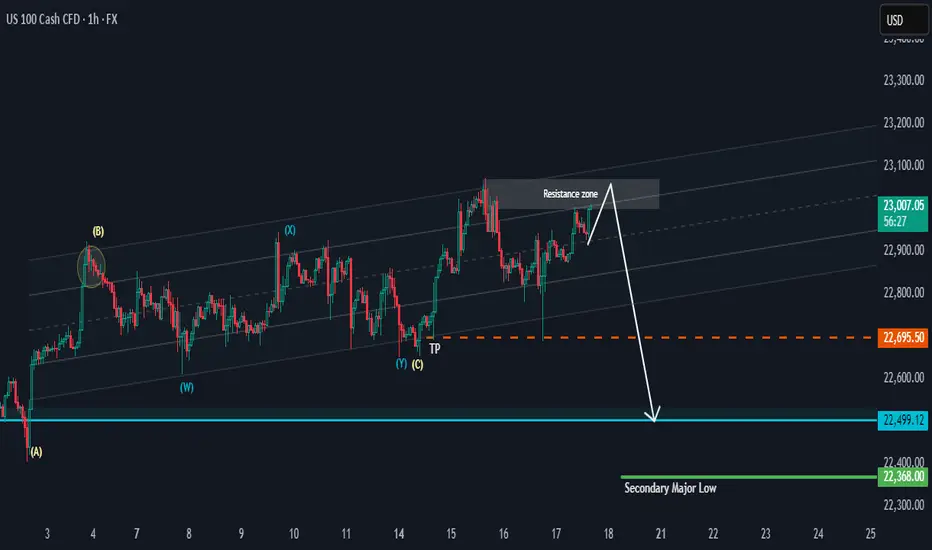
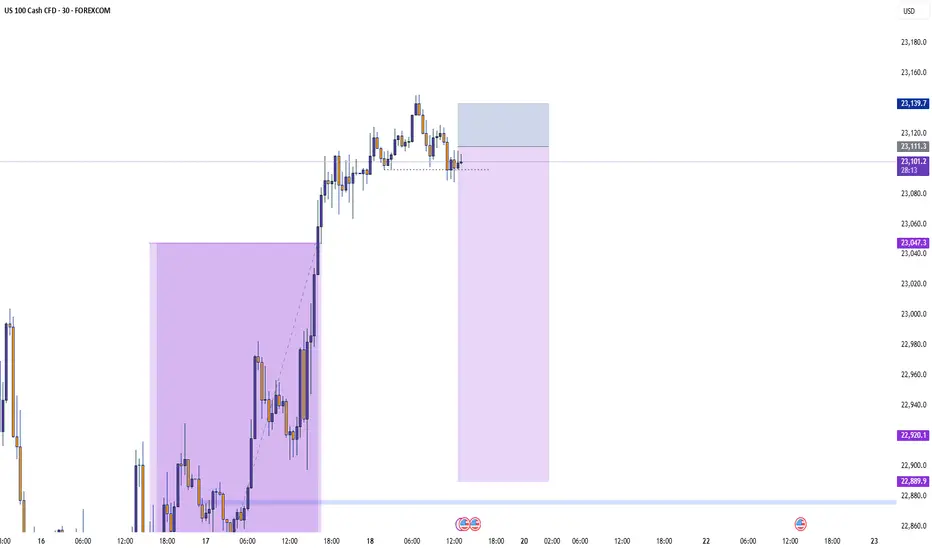
NAS100 has the potential to drop as it keeps testing the resistance zone in the range of 23100. This looks more like bull exhaustion than a reversal. The 22695.50 is the target for a bias of 22499.12
The overall bigger trend is bullish, with price highs aiming as far as 23717.44, 24837.28, and 26222.31, making this a potentially massive bullish trend, and it will take time to reach those highs.
Happy Trading, 🌟
K.
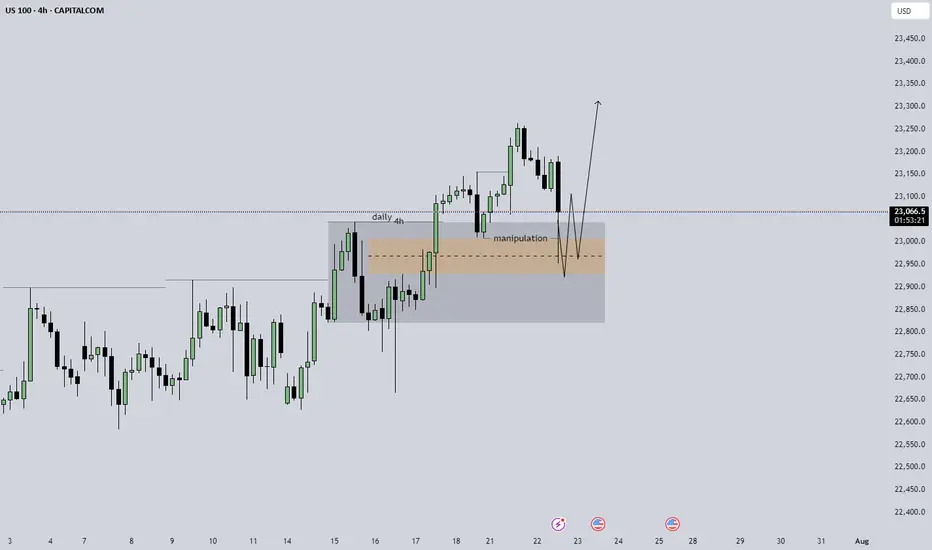
US100 expecting smth like this daily is strongly bullish, 4h is showing some sort of manipulation in the short, i am expecting something like the arrow that i pointed to happen on the m5 structure to try and take an entry, without that kind of circumstance stay out of the trade.
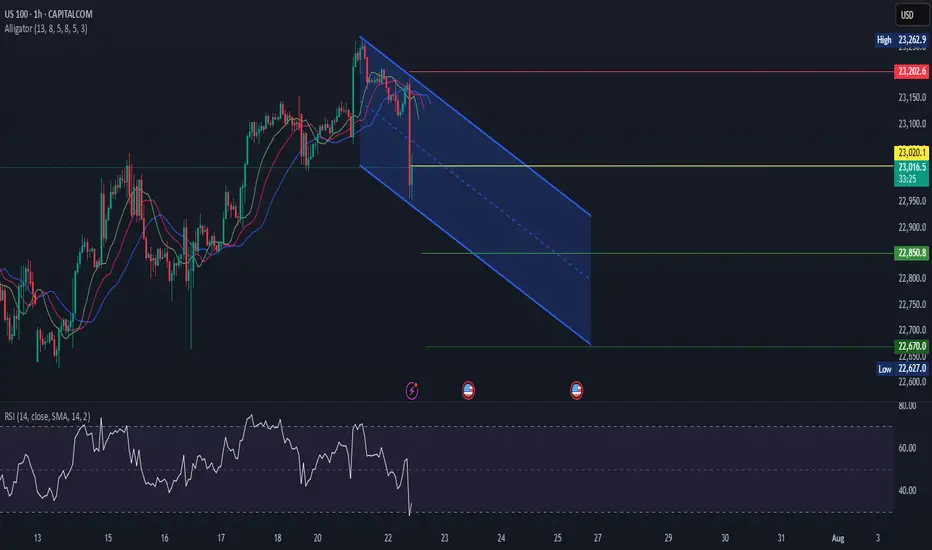
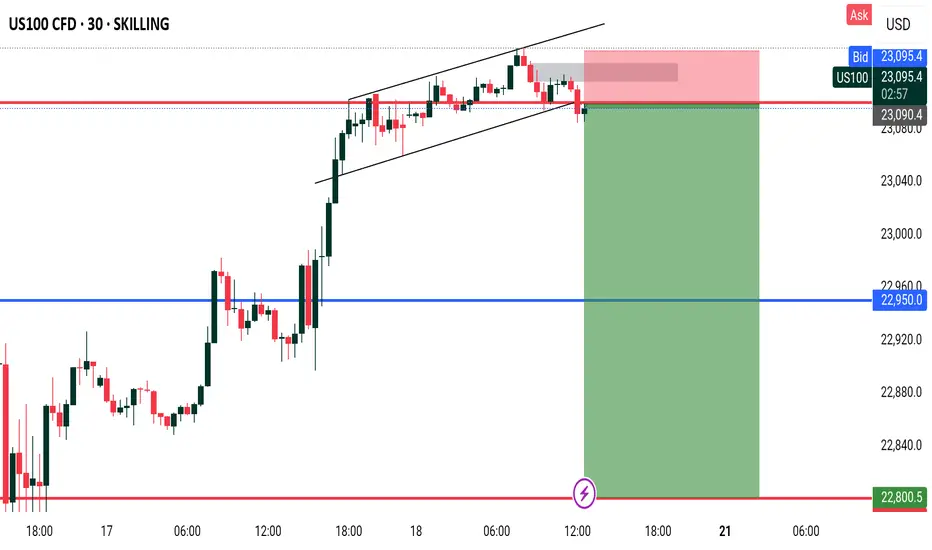
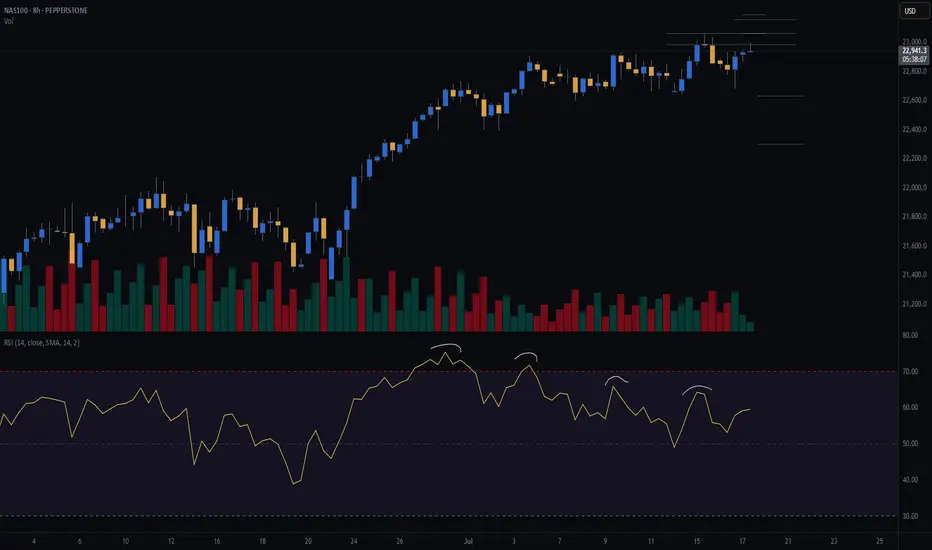
US100US100 is in bearish trend.
Printing LH and LL>
Bearish divergence also shown in RSI.
Alligator mouth open which indicates trend will go downward.
We sell at CMP.
NasdaqThis is 3-5 day buy setup. Followed by a M formation. Inside day formation
Great to scale in near High of day & low of the day after a clear detailed setup with confirmations.

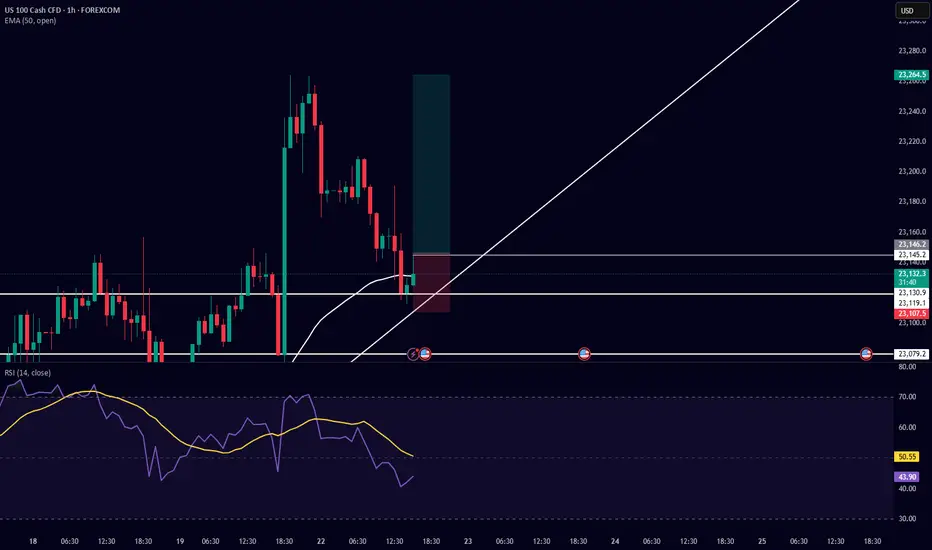
Trade Setup Description (Buy Side) – US100 (Nasdaq 100) 5-MinuteI am taking a buy-side trade on US100 based on the following confluences:
Support & Trendline Respect:
Price respected a horizontal support level near 23,079.2 and is currently bouncing from a rising trendline, showing potential for a bullish move.
Bullish Candlestick Reaction:
After testing the trendline, bullish candles formed, indicating buying interest at this zone.
EMA 50 Reclaim Potential:
Price is attempting to reclaim the 50 EMA (currently at 23,141.3). A successful break and hold above it would confirm bullish momentum.
RSI Confirmation:
RSI is currently around 47 and curving upwards, indicating a potential reversal from oversold/neutral territory. The RSI yellow moving average is also turning up.
Risk-Reward Ratio:
The setup has a favorable risk-to-reward ratio with the stop loss placed just below the trendline and recent wick low, and the target placed above the recent high around 23,264.5.
US100 SELL OPPORTUNITY Price is trading at 22204 and it provides us with a sell opportunity after market formed a divergence. A sell opportunity is envisaged from the current market price.
Properly navigating this ATH run in NASDAQ - No supply yetEverything is explained quickly in the video.
Main points:
1) Lows and bullish imbalances respected
2) It's very difficult to short without supply
3) May get cyclical take profit like previous years
Be sure to let me know what you think!

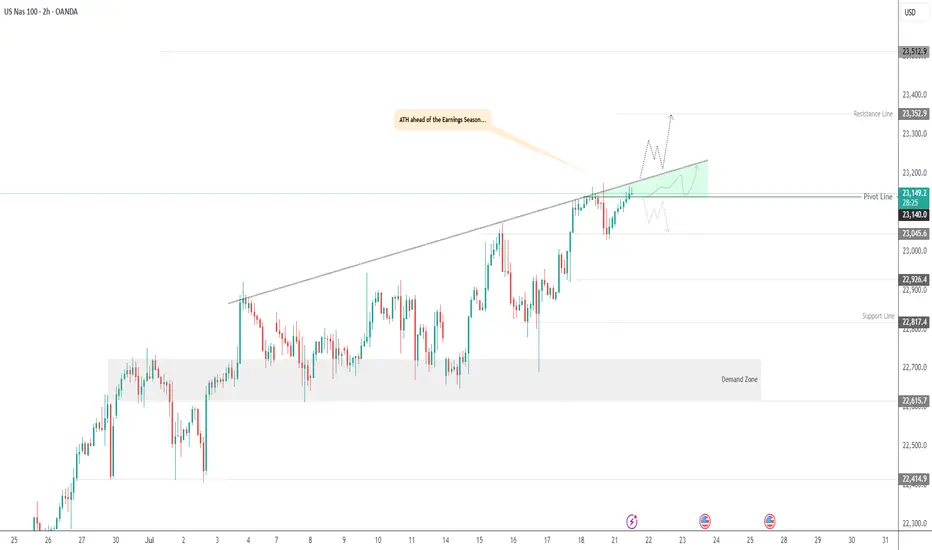
USNAS100 | Bullish Setup Ahead of Tech Earnings & Trade RiskUSNAS100 | Bullish Setup Ahead of Tech Earnings & Trade Risk
U.S. equity markets are entering a pivotal week with big-tech earnings and renewed focus on Trump’s proposed trade tariffs. Both the S&P 500 and Nasdaq are hovering near record highs, but new catalysts are required for continuation.
Technical Outlook:
The price has stabilized above 23140, breaking the pivot and confirming bullish momentum. As long as the price holds above this level, the trend remains bullish, especially if it breaks the green triangle resistance structure.
A sustained move above 23140 opens the path toward 23250 and 23350, with further extension possible to 23510.
However, a 4H close below 23140 may activate a bearish correction toward 23045, and possibly deeper toward 22920 and 22820.
Resistance Levels: 23250 · 23350 · 23510
Support Levels: 23045 · 22920 · 22820
Bias: Bullish above 23140
Nas Long to clear HH liquidity before correctionHTF Context – Monthly / Weekly / Daily
• Big Beautiful Bill (Trump Tax + Spending Bill)
o Passed July 4th, acting as a stimulus.
o Markets historically rally on fiscal stimulus expectations (tax cuts + spending packages).
o This fuels bullish sentiment short-term, but long-term raises debt, inflation risk, and rate hike concerns.
• Seasonality
o July is typically strong for equities, especially tech, with mid-July often marking local tops before August pullbacks.
• Monthly structure
o Strong bullish monthly candles.
o Next major fib retracements if rejected: 38.2% ~20,398, 50% ~19,625, 61.8% ~18,852.
• Weekly / Daily structure
o HH-HL sequence continues.
o Price in premium zone, approaching major supply block 23,200–23,300.
o Daily BOS not broken downwards yet.
________________________________________
Key Levels
• Major supply / liquidity magnet: 23,200–23,300 (sell-side OB in futures, uncollected liquidity above HH)
• Recent swing high: 22,900
• Daily pivot: 22,470
• Intraday demand zone: 22,450–22,350 (4H wedge base + VWAP)
• Weekly support shelf: 22,100–22,200 (if lost, major trend shift bearish)
________________________________________
My View – Most Likely Path
1. Price is likely to sweep the liquidity above recent highs into the 23,200–23,300 supply zone.
o Why? Market rarely leaves liquidity uncollected. This move traps breakout buyers and hits stops above HHs.
o Big Beautiful Bill fuels the final squeeze higher as algorithms price in fiscal stimulus.
2. After liquidity sweep above 23,200–23,300:
o Expect strong rejection from that zone.
o Institutions offload positions into trapped retail longs.
o Price pulls back towards daily and weekly support zones for reaccumulation.
3. Alternate scenario (less likely)
o Immediate sell-off from current levels without sweeping HH.
o Weak move; would still expect a revisit higher later to clear liquidity before a proper downtrend.
________________________________________
Trade Setups – Intraday & Swing
Intraday Long (Most Likely)
• Bias: Bullish continuation
• Entry Zone: 22,450–22,350 (4H demand + VWAP)
• Trigger: 5m/15m BOS up
• Stop: Below 22,300.
• Targets: First at 22,615, next at 22,845, final at 23,200–23,300.
________________________________________
Intraday Short (Countertrend / Liquidity Sweep Reversal)
• Bias: Short from supply after liquidity grab
• Entry Zone: 23,200–23,300
• Trigger: Sweep of HH with rejection wick or bearish engulfing candle
• Stop: Above 23,350 (structure invalidation).
• Targets: First at 22,845, then 22,600, extend to 22,450 if momentum accelerates.
________________________________________
Swing Long (Continuation)
• Bias: Bullish trend intact
• Entry: After retest of daily pivot (22,470) or 4H demand (22,350–22,450) with 4H CHoCH + BOS up.
• Stop: Below 22,200 (weekly support break invalidates).
• Targets: 22,845 then 23,200–23,300. Blue sky if above.
________________________________________
Swing Short (Only if structure breaks)
• Trigger: Daily close below 22,200
• Bias: Bearish trend shift
• Targets: 21,800 first, then 21,000 major fib cluster and weekly MA.
________________________________________
Summary – My Final Opinion
Price is in a strong uptrend fuelled by fiscal stimulus, rate cuts and tarrif hopes . I think it will sweep the liquidity above 23,200–23,300 before any deeper pullback or trend reversal. Any rejection from that supply zone will be the cue to short for a structural retracement. Until then, I’ll keep buying dips aligned with the HTF bullish structure.
NAS100 - Bullish Trend Continuation Setup• Pair: NAS100 (Nasdaq)
• Bias: Bullish
• HTF Overview (4H):
• Strong bullish structure and momentum from last week.
• Price consistently printing higher highs with no signs of reversal.
• MTF Refinement (30M):
• Waiting for a clean sweep of SSL (sell-side liquidity).
• Looking for price to dip into 30M OB for continuation opportunity.
• Entry Zone:
• Watch 30M OB — once price sweeps liquidity and confirms, execute long.
• Targets:
• Structure highs / previous weekly highs.
• Mindset Note:
• Simple execution plan — ride the trend, trust the structure.
• Wait for confirmation before switching from analyst to trader mode.
Bless Trading!
US consumer sentiment improved in Jun could boost US indices The US July Michigan Consumer Sentiment Index increased to 61.8 from 60.7, while the 12-month inflation expectation decreased to 3.6% from 4% in the previous month. This suggests an easing of inflation concerns and improved consumption optimism.
This data, coupled with recent stronger Retail Sales figures, continues to support expectations for robust US economic growth amidst trade tariff uncertainties. Inflation is anticipated to have a limited short-term impact. Concurrently, the approval for AMD and Nvidia (NVDA) to export AI chips to China further bolsters the US tech sector.
The USTEC is currently in an upward trend, having reached a new high before a slight retreat. It is trading above both the EMA21 and EMA78, indicating higher highs and higher lows, suggesting the rally could persist.
Should the USTEC continue its surge, the index may test the resistance level at 23,200. Conversely, a failure to maintain above the trendline could trigger a decline towards the next support at 22,600.
By Van Ha Trinh - Financial Market Strategist from Exness
NASDAQ Short OpportunityPrice formed a distribution schematic 1 and currently forming the LPSY at OTE Level

NASDAQ100 Hits Target at 23170 – Watch for Breakout or PullbackNASDAQ100 Tests ATH – Key Decision Zone at 23170
New ATH Achieved:
NASDAQ100 recorded a new All-Time High (ATH), hitting our target at 23170 precisely as projected.
Currently, price is consolidating below 23170. Sustained rejection at this level could trigger a short-term bearish pullback toward 23010. A deeper correction may extend to 22900 or even 22815.
However, a clean breakout above 23170 would confirm bullish continuation, with the next target at 23350.
Key Levels
• Pivot: 23170
• Resistance: 23250 / 23350
• Support: 23010 / 22900 / 22815
Outlook:
• Bullish above 23170
• Bearish below 23170 (short-term pullback zone)

SellRejection Level
Daily Volume
Market Structure Shift
London US Session
Trend Line Break
Untapped Order Point
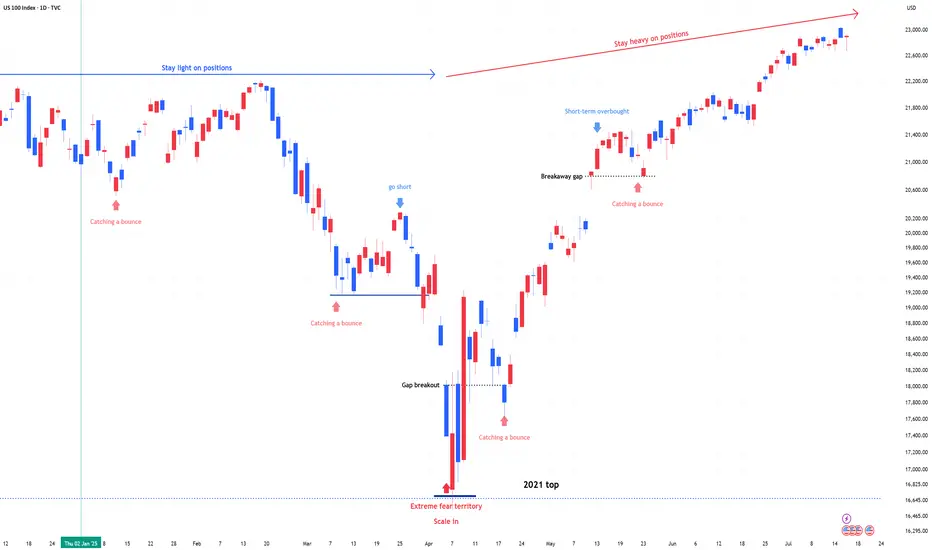
US 100 (NDQ) : Stay Heavy on Positions1) April Fear & Buy Signals
In early April, the Nasdaq 100 experienced a sharp sell-off, triggering extreme fear sentiment across the market.
At that point, scale-in buy signals appeared—classic "buy the fear" conditions.
2) Current Market State: No More Fear, but Watching
Since then, the market has stabilized.
The fear has disappeared, but we are still in a wait-and-see mode as traders assess the next move.
Momentum is holding, but participation remains cautious.
3) Stay Heavy on Positions
Despite short-term uncertainty, I’m maintaining an overweight position on the Nasdaq 100.
As long as we don’t see a major breakdown, the bias remains bullish.
NAS100 (CASH100) SHORT - Double Top H8Risk/reward = 4.6
Entry price = 23 063
Stop loss price = 23 190
Take profit level 1 (50%) = 22 635
Take profit level 2 (50%) = 22 303
Still waiting for confirmation on some variables.
For example, need H8 candle to close in range and volume to validate, amongst other variables.
NASDAQ LONG NOWDaily break of structure provided me a view of the daily support at 22,960.
My entry is also supported by the 50-MA at the left chart. Im targeting 23,800 with 1:6 risk reward.

$NDX 3rd Bearish EngulfingSlowly but surely we are seeing deteriorating conditions in every major indices.
NASDAQ:NDX closed and formed the 3rd BEARISH engulfing in 2 weeks, RARE!
Light volume so it's not definitive, but alarming.
TVC:DJI keeps weakening.
SP:SPX many RED candles & bearish engulfing as well.
Light volume though.

Trend Lines AnalysisThe current target is 22143 and after small correction the price will continue towards 24023 target and will proceed further towards 25000 level. If the price fail to break 22143 and price fall sharply from that level then expect it to fall back to 19800 price level where is the yearly pivot point lying.
