NASDAQ: Almost overbought but with no stop on this uptrend.Nasdaq is about to turn overbought on its 1D technical outlook (RSI = 68.420, MACD = 402.410, ADX = 22.800) but the current bullish wave shows no signs of stopping yet. The Channel Up since the April bottom indicates that a +9.50% rise is very likely before the next technical pullback, especially as long as the 1D MA50 is holding. Stay long, TP = 23,400.
## If you like our free content follow our profile to get more daily ideas. ##
## Comments and likes are greatly appreciated. ##
USTECH100MINICFD trade ideas

MAOR HEAD N SHOULDER TOP FORMATION I AM 100 % SHORT NOW The chart posted is that on the NDX 100 .This is my view of what has formed . best of trades WAVETIMER

NASDAQ| - Continuation Setup Fueled by Momentum📌 Pair: NAS100 (NASDAQ)
📈 Bias: Bullish
🕰 HTF View (4H):
Strong bullish momentum unfolding with structure showing clear intent to continue higher. No major signs of reversal—smart money appears to be driving price up.
🧭 MTF View (30M → 2H clarity):
Using the 2H for cleaner narrative. Waiting for a clean sweep of sell-side liquidity (SSL) into a refined OB to continue the move. 30M showing structural alignment with the bullish bias.
🎯 Entry Criteria:
LTF CHoCH → Liquidity sweep → OB mitigation
Confirm the shift and execute on the return.
🎯 Target: Structure highs above
🧠 Mindset Note:
Momentum is your ally—but don’t let speed replace structure. Follow your confirmation sequence, stay surgical, and let price do the work.
Bless Trading!

The Nasdaq rally might be reaching its limits… The Nasdaq rally might be reaching its limits…
When priced in gold, a massive topping structure is morphing into existence.
Final breakdown coming?

Tesla Drop Pressures Nasdaq – 22,470 Key to Hold RecoveryUSNAS100 | Overview
Tesla dropped approximately 5%, weighing heavily on the Nasdaq, amid public tensions between Elon Musk and Donald Trump.
Yesterday, the price declined below 22,610 due to the impact of Tesla’s fall but remained above 22,470. As long as it trades above this level, a recovery attempt is likely, with the price expected to break through the consolidation zone between 22,615 and 22,740.
However, if the 1h candle closes below 22,470, the bearish trend is expected to continue toward 22,280 and potentially lower.
Pivot: 22,470
Resistance: 22,615 – 22,740 –23,000
Support: 22,280 – 22,200

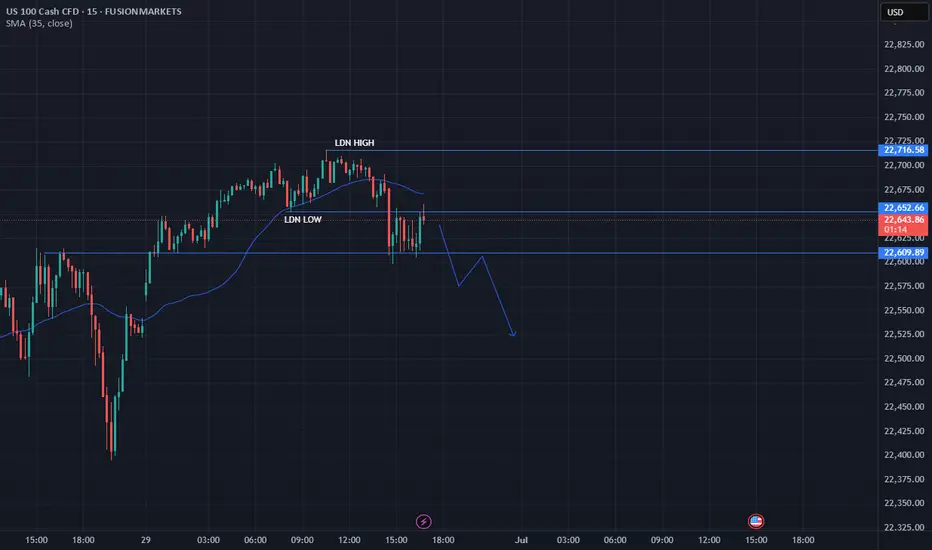
London session long 01/07/2025Clear AMD, london manipulates into remaining 15min fvg, aim for asian highs.

NAS100 – Short from Premium Post-ATH Liquidity Sweep (27-06-25)
Buyside liquidity swept at 22,554.05 after fresh ATHs. Short triggered on a strong bearish news candle from premium territory. TP set at 22,423.99 near a Bright Gold HeatMap cluster. SL at 22,585.01 above structural highs. Trade thesis driven by Box Theory, liquidity targeting, and expected short-term correction from overextended highs.

US100 POSSIBLE SELL OPPORTUNITY!!We’re going to see a possible sell opportunity on US100 from the current market price. SL 22594 take profit at 22178

USNAS100 |Bullish Trend Holds Above Pivot – Eyeing 22790 & 23000USNAS100 | Bullish Movement
The price has stabilized above the key pivot level at 22640, confirming a continuation of the bullish trend toward the next resistance at 22790.
As long as the index remains above 22640, the uptrend is expected to extend toward 22790 and potentially 23000, with minor pullbacks likely to retest the pivot.
Currently, USNAS100 is consolidating between 22640 and 22790.
A 1H candle close below 22640 would signal a bearish correction toward 22520 and possibly 22410.
Pivot Line: 22640
Resistance Levels: 22790, 23000
Support Levels: 22520, 22410
previous idea:

NAS SETUPNas 100 setup using smart money concepts. A change in the state of price delivery has occured at level 22,518.48 then we wait for entry cnfirmation when price either touch the bearish order lock at level 22,519.23 or when it comes back to the fair value gap to rebalance price at level 22,560.67 ....hence we are shorting the market when our rules are met

USNAS10 Faces Key Test at 22,615 Ahead of NFP VolatilityUSNAS100 – Key Levels Ahead of Major News
Today’s economic data releases (NFP, Unemployment Rate, etc.) are expected to drive volatility in the market. Traders should watch key levels closely.
Technical Outlook (USNAS10):
• Price is attempting to test 22,615.
• If it holds above 22,615, the bullish momentum is likely to continue.
• However, if price stabilizes below 22,615 on the 1H chart, further downside toward 22,420 is expected before a potential bullish reversal begins.
A breakout above 22,740 could trigger further upside toward 23,000
Key Levels:
• Resistance: 23,000 / 23,100
• Support: 22,420 / 22,280

Nas100With speculation about no rate cuts we can expect to see Nas100 plumet with Fed Powells upcoming speech.
If we look at the technical side we can see that Nas has been somewhat consolidating over the past 2 days creating a fair amount of Sell side liquidity. We can expect Powell to speak about rat cuts today in his upcoming speech and we will use this to our advantage waiting for early buyers to push up the market triggering our setup.
We can look for a plus minus 100 pip move before Nas turns around, we will however closely monitor the movement of Nas now until the speech so that we can execute a trade with the least amount of risk.
Remember to like and subscribe for more A+ setups.

WRONG!, THIS IS A BAD IDEA, SHORT INDEXESYa know... as the title says. It's wrong, nothing about this idea is sensical... but that's where it just might pay off. Non-sense. One special person to take the bull by the horns and say "I want in at better prices"...
This is not trading advice nor a valid idea, nothin says the chart will reverse... being early and being right eventually doesn't usually pay... but watch for signs... they may come.

NAS100 weekly BiasI will be interested to see Monday drop to the Weekly Opening Gap and maybe retrace lower for the Friday low since high has been taken and from thereon we will see if the daily Bias will offer continuation or reversal going forth

US100 update market The chart you've shared is a 2-hour timeframe for the US 100 index (NASDAQ 100) with a clear bearish outlook marked by projected price levels and potential demand zones.
Key Observations:
1. Current Price:
22,478.5 (near-term consolidation with recent bearish pressure)
2. Highlighted Zones:
Resistance Zone: Around 22,750–22,800 — where price previously reversed.
First Demand Zone: Around 22,100–22,200 — potential support.
Second Demand Zone: Around 21,500–21,600 — deeper support level.
Third Major Demand Zone: Near 21,200 — long-term support.
3. Bearish Structure:
Price has broken below recent support levels.
Black dotted line shows a projected move toward lower demand zones.
Momentum appears to be weakening after a strong bullish rally from June 21–28.
4. Technical Bias:
This is a bearish correction or possible trend reversal setup.
The presence of strong demand zones suggests potential bounce zones if price reaches those levels.
---
Summary:
This chart implies a bearish move is underway on the US 100 with expected targets near 22,100, then 21,600, and potentially 21,200. Watch for bullish reaction or reversal signals at those zones. If price reclaims 22,800+, bearish outlook would be invalidated.
Let me know if you want a trade setup or confirmation strategy based on this analysis.

NSDQ100 lower after ADP Employment shrank to 33K in JuneTrump Trade Tensions:
Donald Trump reaffirmed his July 9 deadline for higher tariffs, intensifying criticism of Japan, particularly over auto sector issues. While Japan insists talks are in good faith, market fears of a breakdown are rising.
US Tax Policy in Focus:
Trump’s “Big Beautiful” tax and spending bill faces potential resistance in the House despite narrowly passing the Senate. The proposal’s scale and political friction are drawing investor attention.
Apple Supply Chain Worry:
Foxconn has pulled hundreds of Chinese staff from its Indian iPhone factories, sparking fresh concerns about Apple’s supply chain and Wall Street’s potentially overheated tech optimism.
Paramount Settlement:
Paramount resolved a lawsuit with Trump over alleged election interference via CBS’s coverage. Meanwhile, the company awaits FCC approval for its Skydance merger.
Auto Sector Weakness:
Stellantis reported a 10% drop in U.S. Q2 deliveries despite some brand gains. Tesla is expected to post a 12% annual decline in vehicle deliveries, reinforcing signs of cooling demand in the sector.
Conclusion:
Markets remain cautious but resilient amid political tensions, supply chain disruptions, and weaker auto sales. Attention is now turning to upcoming trade deadlines, policy decisions, and Q2 corporate results.
Key Support and Resistance Levels
Resistance Level 1: 22710
Resistance Level 2: 22820
Resistance Level 3: 22930
Support Level 1: 22190
Support Level 2: 22040
Support Level 3: 21900
This communication is for informational purposes only and should not be viewed as any form of recommendation as to a particular course of action or as investment advice. It is not intended as an offer or solicitation for the purchase or sale of any financial instrument or as an official confirmation of any transaction. Opinions, estimates and assumptions expressed herein are made as of the date of this communication and are subject to change without notice. This communication has been prepared based upon information, including market prices, data and other information, believed to be reliable; however, Trade Nation does not warrant its completeness or accuracy. All market prices and market data contained in or attached to this communication are indicative and subject to change without notice.

NAS100 - Potential TargetsDear Friends in Trading,
How I see it,
Severely bullish extension - Potential correction
Prevailing Rally - "LONG" Targets:
1] 22636.00
2] 23220.00
Potential Correction - "SHORT" Targets:
1] 22173.00
2] 22000.00
"ONLY IN CASE CORRECTION ZONE IS BREACHED!"
3] 21450.00
Keynote:
I would refer from looking for shorting setups in such a strong bullish environment.
Wait for the market to come to you.
I sincerely hope my point of view offers a valued insight.
Thank you for taking the time to study my analysis.


US100 — New ATH Trading SetupThe price recently previous ATH at the 22730 level. Current ATH is marked near 22,800, with a POC at 22,640.
Potential support around 22,500, below POC.
Watch for a bounce or further rise beyond 22,920.
Buyers probably will push right through 23,000 level today on Micros and Minis.

Weekly highs swept, aiming for weekly lows now.Liquidity Grab above Weekly Highs
Bearish Rejection Wicks
Trendline Break
Imbalance / Fair Value Gaps below
Reversion to Mean / Higher Timeframe Discount Zones

NAS100 LongNow that we have an official strong bullish close breaking previous highs on the weekly and monthly time frame. We will look for a potential pullback. The 3M candle is currently on track to closing as a strong bullish engulfing. Also, a 1M morning start followed up by a bullish momentum candle.

US100Price broke daily resistance last week and now looks like a retracement is on the way. H4 gave a double top at the rising channel resistance. Pulling back to retest the neckline. target is 22,200.
