US100 Very Strong Uptrend!
HI,Traders !
#US100 is trading in a
Very strong uptrend and
broke a key horizontal
Level around 22688.6 which
Is now a support and we
Are already seeing a rebound
So we are bullish biased
And we will be expecting
A further move up !
Comment and subscribe to help us grow !
USTECH100MINICFD trade ideas

USNAS100 Eyes New ATH as Fed Rate Cut Bets &Ceasefire Fuel Rally USNAS100 OVERVIEW
Wall Street Gains as Rate Cut Hopes and Ceasefire Boost Sentiment
U.S. indices surged on Monday as growing expectations for a potential Federal Reserve rate cut in July helped offset market concerns over Middle East tensions.
The ceasefire agreement between Israel and Iran further eased geopolitical risk, supporting bullish momentum on Wall Street.
Forward Outlook:
A combination of dovish monetary policy expectations and geopolitical de-escalation continues to support upside potential in U.S. equities.
TECHNICAL OUTLOOK – (USNAS100)
The price has stabilized above 22,090, signaling strength and opening the path toward a new All-Time High (ATH) and beyond.
As long as the price holds above 22,090, the bullish trend remains in control.
A break and stabilization below 22,090 would suggest a bearish correction may be underway.
Resistance Levels: 22,210 → 22,280 → 22,460
Support Levels: 21,930 → 21,850

USNAS100 Technical Setup: Watching 21635 and 21835 LevelsUSNAS100 – Technical Outlook
The price has stabilized above the key pivot level at 21635, indicating potential short-term upside toward the resistance at 21835.
However, as long as the price trades below 21835, the broader bias remains bearish. A confirmed 1H close below 21635 would reintroduce downside pressure, targeting 21470 and potentially extending toward 21375 and 21250.
Pivot Level: 21635
Support: 21470, 21375, 21250
Resistance: 21835, 21930, 22090
previous idea:

Nas100 ShortWe've seen Nasdaq consolidating to the upside for today we do have jobless claims and GDP coming up.
From a fundamental view there is some speculation that the GDP will come out significantly lower and therefore could possibly draw price down.
From a price action point of view we should see price drop to test our recent swing low.
Trade with caution and please do subscribe for more Setups

NASDAQ Will the 4H MA200 support the Channel Up?Nasdaq (NDX) has been trading within a Channel Up since mid-May and today almost touched the pattern's bottom, making a Higher Low. At the same time, the 4H MA200 (orange trend-line) is right below it, the medium-term's natural Support.
Since the 4H RSI also bounced on the 32.20 Support, which is where the pattern bottomed on May 23, we expect the new Bullish Leg to start, as long as of course the 4H MA200 holds. The Target is the 1.382 Fibonacci extension at 22300.
-------------------------------------------------------------------------------
** Please LIKE 👍, FOLLOW ✅, SHARE 🙌 and COMMENT ✍ if you enjoy this idea! Also share your ideas and charts in the comments section below! This is best way to keep it relevant, support us, keep the content here free and allow the idea to reach as many people as possible. **
-------------------------------------------------------------------------------
Disclosure: I am part of Trade Nation's Influencer program and receive a monthly fee for using their TradingView charts in my analysis.
💸💸💸💸💸💸
👇 👇 👇 👇 👇 👇

#NDQ - Monthly Targets: 23721.73 or 21387.86?Date: 03-07-2025
#NDQ - Current Price: 22641.89
Pivot Point: 22554.80 Support: 22276.15 Resistance: 22835.11
Upside Targets:
Target 1: 23028.36
Target 2: 23221.62
Target 3: 23471.67
Target 4: 23721.73
Downside Targets:
Target 1: 22082.06
Target 2: 21887.98
Target 3: 21637.92
Target 4: 21387.86

NASDAQ, USTECUSTEC price is currently near the main resistance level of 22168-22229. If the price cannot break through the level of 22229, it is expected that the price will have a chance to go down. Consider selling the red zone.
🔥Trading futures, forex, CFDs and stocks carries a risk of loss.
Please consider carefully whether such trading is suitable for you.
>>GooD Luck 😊
❤️ Like and subscribe to never miss a new idea!

"NASDAQ 100: THE TECH ROBBERY! – Quick Profits Before Reversal?"🔥 "The NDX NASDAQ 100 INDEX Heist: Bullish Loot & Escape Before the Trap!" 🔥
🌟 Hi! Hola! Ola! Bonjour! Hallo! Marhaba! 🌟
Dear Money Makers & Market Robbers, 🤑💰💸✈️
Based on the 🔥Thief Trading Style🔥 (technical + fundamental analysis), here’s our master plan to heist the NDX - NASDAQ 100 INDEX. Follow the strategy on the chart—long entry is the play! Aim to escape near the high-risk RED Zone (overbought, consolidation, potential reversal). The bears are lurking, so take profits and treat yourself—you’ve earned it! 💪🏆🎉
🚀Entry (The Vault is Open!)
"Swipe the bullish loot at any price!"
For precision, place buy limit orders within 15-30min timeframe (recent swing lows/highs).
Set alerts! Don’t miss the heist.
🛑 Stop Loss (Safety Net)
Thief-style SL at nearest swing low (4H timeframe) → 21,000.00 (adjust based on risk/lot size).
🏴☠️ Target 🎯: 22,800.00
Bullish momentum is fueling this heist—ride the wave but exit before the trap!
📰 Fundamental Backing (Why This Heist Works)
Macroeconomic trends, COT data, geopolitics, and sentiment align for bullish moves.
Full analysis? Check our bio0 linkk! 👉🔗🌎
⚠️ Trading Alerts (News & Risk Mgmt)
Avoid new trades during high-impact news (volatility = danger).
Use trailing stops to lock profits and dodge sudden reversals.
💥 Boost This Heist!
Hit 👍 (Boost Button) to strengthen our robbery squad!
More heists = More profits—stay tuned for the next steal! 🚀🤑
See you soon, fellow thieves! 🤝🎉

Trade alert triggered! Tiqgpt setupAnalyzing the US Tech 100 CFD across multiple timeframes, we observe a consistent bullish momentum from the daily down to the 1-minute chart. The daily and 4-hour charts show a series of strong bullish candles, indicating a robust institutional buying presence. The 1-hour chart confirms this trend with a continuation of bullish candles, although there's a slight pullback visible, suggesting a temporary liquidity grab before further upward movement. The 15-minute charts show a more detailed view of this pullback, which appears to be a healthy correction within a broader bullish trend. The 1-minute chart shows increased volatility and some consolidation, typical of lower timeframes where retail traders are more active.
INSTITUTIONAL THESIS: Institutions are likely in a phase of accumulation and distribution, using pullbacks to gather more positions before pushing the price higher. The consistent higher highs and higher lows across timeframes suggest a strong bullish bias. The recent pullbacks on lower timeframes are likely temporary, serving to trap bearish retail traders before continuation of the uptrend.
LEARNING POINT: The pullback seen on the 1-hour and 15-minute charts can be interpreted as a liquidity grab, where institutions are likely stopping out weak bearish positions before continuing the bullish trend. This is a classic example of "stop hunt" before trend continuation.
SIGNAL: BUY SYMBOL: US Tech 100 CFD ENTRY PRICE: $22,500.0 STOP LOSS: $22,480.0 (Below the recent minor pullback on the 15-minute chart) TARGET PRICE: $22,600.0 (Just below the recent highs to ensure liquidity for exit) CONDITION: Buy limit order at $22,500.0 following a confirmed bullish reaction off the $22,500.0 level on the 15-minute chart RATIONALE:
Market Structure: Consistent higher highs and lows across all timeframes.
Order Flow: Institutional buying evident from large bullish candles.
Liquidity Behavior: Recent pullbacks likely represent liquidity grabs.
Pressure Analysis: Strong bullish candles indicate institutional pressure.
Strategies Used: Liquidity grab and continuation, intraday accumulation. URGENCY: MEDIUM TIMEFRAME: Short-term CONFIDENCE SCORE: 85% (Based on the clear bullish structure and institutional buying signs) **RISK/REWARD RATIO: Risk=$20.00, Reward=$100.00, Ratio=1:5.0
Risk = $22,500.0 - $22,480.0 = $20.0
Reward = $22,600.0 - $22,500.0 = $100.0
Ratio = $100.0 / $20.0 = 5.0

NASDAQ: Short-lived pullback ahead of major breakout.Nasdaq has entered strong bullish territory on its 1D technical outlook (RSI = 66.290, MACD = 331.080, ADX = 18.600). Despite that, it remains inside a slow moving Channel Up for the past month in contrast to the more aggressive bullish waves of the Channel Up in April and May. The 4H RSI peak may be similar to May 12th and April 24th. We believe that at least a +9.69% rally will emerge to approach the top of this 3 month Channel Up. Stay bullish, TP = 23,400.
## If you like our free content follow our profile to get more daily ideas. ##
## Comments and likes are greatly appreciated. ##

Nasdaq shortI think it is time to take the lows on the lower time frame.
Time for a small reversal.
1min entry and bos .

NAS100 Potential ReversalHi there,
The NAS100 is slightly bullish and fairly stagnant. It is consolidating between two key levels (orange lines). A break below the price might fall into deeper demand zones.
Short Notes
- **Elliott Wave**: 5-wave structure appears complete at resistance (22,137.8), signalling a possible reversal.
- **Liquidity Zones**: Price is at/near a major liquidity zone, increasing reversal risk.
- **Break High**: There's a potential for a false breakout above wave 5 before dropping.
- **Support Levels**: The 21,800.6 (previous day high) and 21,146.2 (previous day low) for first support.
- **Demand Zones**: Strong demand below 21,146.2, with deeper support near 20,000 and 18,800.
- **Overview: A possible bearish move ahead from current highs, targeting lower demand zones.
Happy Trading,
K.
Not trading advice

US100 (NASDAQ) BREAKOUT BLUEPRINT: LOOT LIKE A SMART TRADER!🔥 NASDAQ 100 HEIST: STEAL THE TREND LIKE A MARKET BANDIT! 🚨💰
Locked & loaded for the US100 (NASDAQ 100) heist? This slick blueprint cracks the code to loot profits—blending killer technicals with macro intel. Ride the bullish wave, but dodge traps near the Overbought Zone. Bears lurk, so secure your bag before the reversal hits! 🐻💨
🎯 ENTRY: STRIKE LIKE A PRO THIEF
Long the breakout near 21,500.0 (or ambush pullbacks at 20,400.0 & 19600.0).
Set stealth alerts to catch moves in real-time. 🕶️🔔
🛡️ STOP LOSS: ESCAPE ALIVE
Hide stops under the last 4H swing low/wick—no reckless bets!
Adjust for your risk—survivors play smart. ⚡
💸 TAKE PROFIT: VANISH WITH THE LOOT
Main Target: 22,250.0 (or bail early if momentum fades).
Scalpers: Trail stops & ghost out with quick wins. 🏃♂️💨
📡 WHY THIS HEIST WORKS
NASDAQ 100’s on fire: Fundamentals + COT data + macro tides align.
Sentiment’s bullish, but stay sharp—links below for the full intel. 🔍🌐
⚠️ WARNING: NEWS = POLICE SIRENS
Avoid new trades during high-impact news. 📢
Lock profits with trailing stops if you’re already in. 🔐
🤝 JOIN THE TRADING MAFIA
Smash LIKE, drop a comment, & let’s dominate the US100! �
Ready for the next big move? Stay tuned. 👀
Happy hunting, chart pirates! 🏴☠️📉

NAS100 Breakout – Eyeing Bullish Extensions or False Break?The NAS100 (US100) is in full breakout mode on the daily, surging past previous highs near 22,140 with strong momentum. Price is now trading at ~22,550, decisively above prior resistance, which could now act as support if we retest.
🔎 Multi-Timeframe Breakdown:
✅ Daily Chart:
• Massive bullish structure intact.
• Clean breakout above horizontal resistance at 22,140.
• Price riding an aggressive ascending trendline — watching for sustained closes above breakout level.
✅ 4H Chart:
• Higher lows and bullish impulsive candles confirm buyers in control.
• Multiple support zones below (22,300, 22,100) for potential retests.
• Key short-term resistance formed near 22,650 — a rejection here could trigger correction.
✅ 1H & 23m Charts:
• Micro pullback seen after tagging fresh highs; price still holding above short-term trendlines.
• Consolidation zone between 22,500–22,600 could be decisive for next move.
⸻
📌 Key Zones to Watch:
• Support: 22,300 / 22,140
• Resistance: 22,650 / 22,800
• A breakout retest could confirm continuation; otherwise, failure to hold support might signal a fakeout.
⸻
📈 Bias: Bullish (Long)
While momentum remains strong, be prepared for potential sharp corrections given overextension.
⸻
What do you think? Drop your thoughts below! 🚀👇

US100 (NASDAQ 100 Index) – Breakout with Clear Upside ProjectionUS100 has broken out cleanly above the key resistance at 22,097.1, indicating bullish continuation. The breakout is supported by strong upward momentum, targeting the next key level around 23,441.9, as illustrated by the projected range.
Support at: 22,097.1 🔽 | 20,750.0 🔽
Resistance at: 23,441.9 🔼
🔎 Bias:
🔼 Bullish: Sustained price action above 22,097.1 keeps the bullish breakout valid, aiming toward 23,441.9.
🔽 Bearish: A drop back below 22,097.1 would invalidate the breakout, possibly pulling price toward 20,750.0.
📛 Disclaimer: This is not financial advice. Trade at your own risk.

US 100 – Potential For Further Geo-Political Volatility AheadEarly trading this Monday morning has been dominated by President Trump's surprise weekend decision to launch airstrikes on three nuclear sites in Iran, which may increase the potential for a wider conflict in the Middle East.
After closing at 21,652 on Friday, this news led the US 100 to a gap open lower to 21,375 in early Asian trading, however, this drop didn't last long and the index has since recovered to trade back up to 21600 again at the time of writing (0800 BST).
Looking forward, the focus for traders may continue to be on Iran's next move. So far they have confined their retaliation to missile attacks on Israel, but they did issue a statement saying they reserve all options to defend themselves.
Fresh attacks on US bases in the region, or deciding to close the Strait of Hormuz, a vital shipping supply route for Oil and Gas from the region, may undermine risk sentiment which could lead to renewed selling of the US 100, while any options suggesting a potential quicker resolution to this conflict may be seized upon by traders to push the index back up to higher levels seen in the middle of last week.
There are scheduled events released across the week that may also be relevant, these include the testimony of Federal Reserve (Fed) Chairman Jerome Powell to congress at 1500 BST on Tuesday and Wednesday, as well as the next US PCE Index update at 1330 BST on Friday, which is the Fed's preferred inflation gauge.
Technical Update: Assessing Support and Resistance Levels
Escalation of hostilities in the middle east over the weekend may leave traders uncertain as to the direction of the next price activity for the US 100 moving forward.
However, technical analysis can help to outline potential support and resistance levels, which if broken to the up or downside, might offer clues on where the index may move.
Potential Support Levels:
Looking at the chart of the US 100 index below, it could be argued that Monday’s lower opening level has already tested what traders may be viewing as support at 21373. This level is equal to half the May 23rd to June 11th phase of price strength.
Having seen an initial recovery following tests of this 21373 level, it may now have been strengthened as a support focus. This means closing breaks below 21373, while not a guarantee of further price declines, may suggest tests of the next support at 20666, which is the May 23rd price low, even 20360, the 38% Fibonacci retracement level, could be possible.
Potential Resistance Levels:
In terms of resistance levels to monitor this week, as the chart shows, Friday’s activity did see a sell-off from its 21905 session high. This confirms sellers have been active at this level previously and may prove to be again.
As such, traders may now be watching the defence of this 21905 level on a closing basis, as breaks above this resistance may now be required to see attempts to push to higher levels which may include a challenge of resistance at 22074, the June 11th session upside extreme, possibly then 2226, the February 18th high.
The material provided here has not been prepared
accordance with legal requirements designed to promote the independence of investment research and as such is considered to be a marketing communication. Whilst it is not subject to any prohibition on dealing ahead of the dissemination of investment research, we will not seek to take any advantage before providing it to our clients.
Pepperstone doesn’t represent that the material provided here is accurate, current or complete, and therefore shouldn’t be relied upon as such. The information, whether from a third party or not, isn’t to be considered as a recommendation; or an offer to buy or sell; or the solicitation of an offer to buy or sell any security, financial product or instrument; or to participate in any particular trading strategy. It does not take into account readers’ financial situation or investment objectives. We advise any readers of this content to seek their own advice. Without the approval of Pepperstone, reproduction or redistribution of this information isn’t permitted.

US Tech 100 CFD broke the Resistance level 22,365.0 range👀Possible scenario:
U.S. stock futures climbed on June 27, with the S\&P 500 and Nasdaq nearing record highs as investors awaited May’s PCE inflation report — the Fed’s preferred gauge — due at 8:30 a.m. ET.
Rate cut expectations grew following reports that President Trump may replace Fed Chair Powell by fall. The odds of a July rate cut rose to 20.7%, up from 14.5% last week. Soft GDP growth, rising jobless claims, and a rare earth trade agreement with China added to the dovish outlook. Also due June 27 final June consumer sentiment data and remarks from several Fed officials.
✅Support and Resistance Levels
Support level is now located at 21,360.0
Now, the resistance level is located at 22,570.0

Nasdaq 100: A New All-Time HighNasdaq 100: A New All-Time High
As shown on the Nasdaq 100 chart (US Tech 100 mini on FXOpen), the value of the technology stock index has risen above its February peak, setting a new historical high.
Bullish sentiment may be supported by:
→ Easing concerns over potential US involvement in a Middle East war, as the ceasefire between Israel and Iran remains in effect.
→ Media reports suggesting that Donald Trump is considering replacing Federal Reserve Chair Jerome Powell by September or October, in an effort to influence a rate cut that could accelerate economic growth (though this also raises the risk of a new inflationary wave).
Technical Analysis of the Nasdaq 100 Chart
Price fluctuations in May and June have formed an ascending channel (highlighted in blue), with the following observations:
→ The decline (marked by red lines) appears to be an interim correction forming a bullish flag pattern;
→ The 22K level, which acted as resistance mid-month, was breached by a strong bullish impulse (indicated by the arrow) from the week's low.
This leaves the market vulnerable to a potential correction, which seems possible given:
→ Proximity to the upper boundary of the ascending channel;
→ Overbought conditions indicated by the RSI.
If the market corrects, a retest of the 22K level may happen.
This article represents the opinion of the Companies operating under the FXOpen brand only. It is not to be construed as an offer, solicitation, or recommendation with respect to products and services provided by the Companies operating under the FXOpen brand, nor is it to be considered financial advice.

NAS100 Rejection at Trendline Resistance: Pullback ExpectedThe NAS100 (4H chart) shows a rejection near the upward sloping trendline resistance and the marked stop-loss zone around 22,335.4. After a strong bullish rally, price failed to break above the resistance and is now showing signs of a pullback. A correction toward the previous breakout zone and target level of 22,012.1 is anticipated. This move aligns with typical price behavior following a resistance rejection, offering a potential short opportunity with tight risk control.

Nasdaq Surges on Ceasefire Hopes – New All-Time Highs Ahead?By analyzing the #Nasdaq chart on the weekly timeframe, we can see that the index experienced a strong rally following the ceasefire announcement between Iran and Israel, climbing as high as 22,200 so far. If the ceasefire holds and tensions continue to ease, we could see a new all-time high for the Nasdaq.
Potential bullish targets for this move are 22,400, 23,200, and 24,000.
Please support me with your likes and comments to motivate me to share more analysis with you and share your opinion about the possible trend of this chart with me !
Best Regards , Arman Shaban

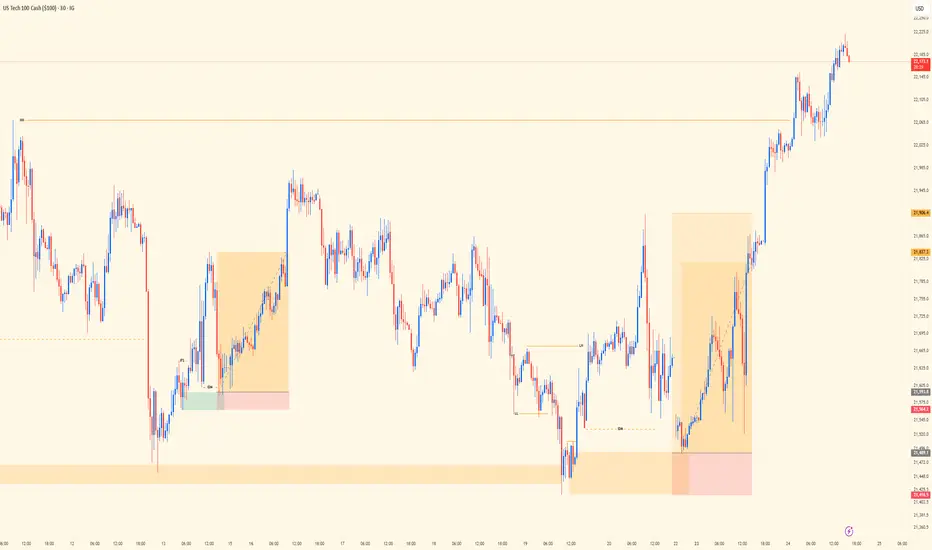
NASDAQ Midweek Review | Trend, Liquidity, PrecisionSingle-chart post today showing the execution trail behind two solid wins on NASDAQ.
Top-down bias was aligned — bulls clearly in control, so I stuck with trend direction. No need to fight momentum. As a trend trader, I don’t counter — that mindset shift alone is what keeps me consistent and clean with entries.
Chart shows the 30M view — where structure, liquidity, and timing came together. Both setups were built off elite structure reads. Liquidity played its part: manipulation, sweep, confirmation, and execution.
Bias: Bullish
HTF Alignment: Bullish trend continuation
Entry Frame: 30M precision
Key Insight: Liquidity isn’t noise — it’s narrative.
Mindset Note: Counter-trading is a shortcut to inconsistency. Stay with flow, respect structure.
Bless Trading!
NASDAQ100 SELL POTENTIAL!Looking at the market structure in US100 from the daily timeframe, we’re seeing a possible sell opportunity as price is beginning to form a distribution stage
Therefore, I anticipate a drop in price. A sell opportunity is envisaged

NASDAQ Long-term looks brighter than ever!Nasdaq (NDX) has been trading within a massive Channel Up since the bottom of the 2008 U.S. Housing Crisis and during the April 07 2025 bottom, a very distinct bullish signal emerged.
The index hit its 3W MA50 (blue trend-line) for the first time since May 2023. As you can see, since the 2008 Crisis, every time the market rebounded after hitting the 3W MA50, it posted a rise of at least +62.06% before the next time it touched it (and that was on the highly irregular COVID crash).
As a result, we expect to see NDX hit at least 26500 (+62.06%) before a new 3W MA50 test. Chances are we see the market move much higher though.
Note also the incredible bounce it made on the 3W RSI 14-year Support Zone.
-------------------------------------------------------------------------------
** Please LIKE 👍, FOLLOW ✅, SHARE 🙌 and COMMENT ✍ if you enjoy this idea! Also share your ideas and charts in the comments section below! This is best way to keep it relevant, support us, keep the content here free and allow the idea to reach as many people as possible. **
-------------------------------------------------------------------------------
💸💸💸💸💸💸
👇 👇 👇 👇 👇 👇
