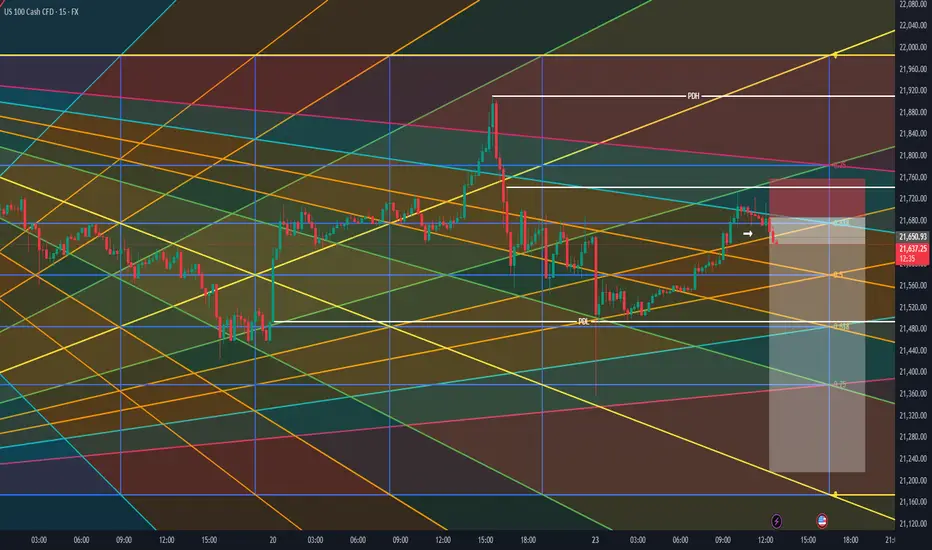
NASDAQ Analysis Stalking shorts on the Daily - nearby.
My weekly sentiment is bearish cause of technical factors.
Among the catalysts is bullish performance on the US Dollar index and price action compared to the US30 & US500.
Look to sell near 4H swing high, entry using the 15M bearish ChoCh only after three legs of bullish correction on the 1H frame into the highlighted levels of the swing high.
Anticipation is for the third leg to react bearish and the fourth leg to deliver impulse to the sell side.
USTECH100MINICFD trade ideas

Nasdaq - This starts the next +50% rally!Nasdaq - TVC:NDQ - might break out soon:
(click chart above to see the in depth analysis👆🏻)
Despite the quite harsh correction of about -25% which we saw in the beginning of 2025, the Nasdaq is clearly heading for new all time highs. It sounds almost incredible but if the Nasdaq breaks above the current confluence of resistance, a breakout rally of +50% will follow thereafter.
Levels to watch: $21.500, $33.000
Keep your long term vision!
Philip (BasicTrading)

Market Structure Breakdown on NASDAQ: What Traders Should Watch📉 NASDAQ (NAS100, US100) Analysis 🧠💼
I’m currently keeping a close eye on the NASDAQ (NAS100) — price action is telling a story worth watching.
📆 Last week, the index came under clear pressure, and now on the 4H timeframe, we’re seeing a defined bearish structure with consistent lower highs and lower lows 📉🔻. This recent expansion to the downside has led to a break in market structure (BOS), and price is now pulling back into equilibrium 🔄.
⏳ For now, it’s a waiting game. I’m watching to see if this pullback finds resistance at a premium level and rotates back to the downside, which would present a potential short setup 🎯📊.
🕒 On the 30-minute chart, I’m monitoring for a clear structural shift — a change in momentum that confirms bearish intent. Should the NASDAQ resume its downward move, it could trigger risk-off sentiment, bringing strength into the JPY pairs 💴🚨 as capital flows out of risk assets.
⚠️ Disclaimer:
This analysis is for educational purposes only and should not be considered financial advice. Always conduct your own research and consult with a licensed financial advisor before making any trading decisions. 📚💼

Nasdaq continuation sellsH4: STILL BULLISH INTERNALLY WITH OUR LAST SIGNIFICANT HL AT 21000
-Possible major chOch on H4 is very possible due to the HTF major zone we at
-Wait for proper H1 & lower tineframe confirmations before jumping in any trades
H1: BEARISH MARKET STRUCTURE STARTING TO PLAY WITH LAST LH AT 21925
-Potential continuation of sells all the way down to take out H4 hl a 21000
-We recently broke below a buying range on H1 & created a selling range
-Possible pullback buys before sells within that range are imminent
M15: We have a nice supply+fvg for sells at 21835
-Wait for price to pullback in there then M1 chOch then attack

US100 / NASDAQ TodayUS100 Today is still bearish
My SSM structure is still down
I'm waiting to open US and looking good entry
Nasdaq shortAiming for asian lows.
let us see if there is at least a small pullback .
1:2 risk reward ratio.

"History repeats itself, first as tragedy, second as farce"CAPITALCOM:US100 How do you call it when price makes a HH but its RSI doesn't follow? And what is going to happen after that?

USNAS100- Geopolitical Pressure Builds,NAS at Key Decision PointUSNAS100 – Technical Overview
🔻 Bearish Outlook:
The price is currently testing 21780. A 4H candle close below this level would confirm downside continuation toward 21635.
A break below 21635 would further strengthen the bearish trend, targeting 21470 and 21375.
🔺 Bullish Scenario:
Bullish momentum may return if the price breaks and holds above 21780 on the 4H timeframe, with upside targets at 21930, and potentially 22090.
• Support: 21635/ 21475 / 21375
• Resistance: 21780 / 21930 / 22090

NASDAQ Potential UpsidesHey Traders, in the coming week we are monitoring NAS100 for a buying opportunity around 21,500 zone, NASDAQ is trading in an uptrend and currently is in a correction phase in which it is approaching the trend at 21,500 support and resistance area.
Trade safe, Joe.

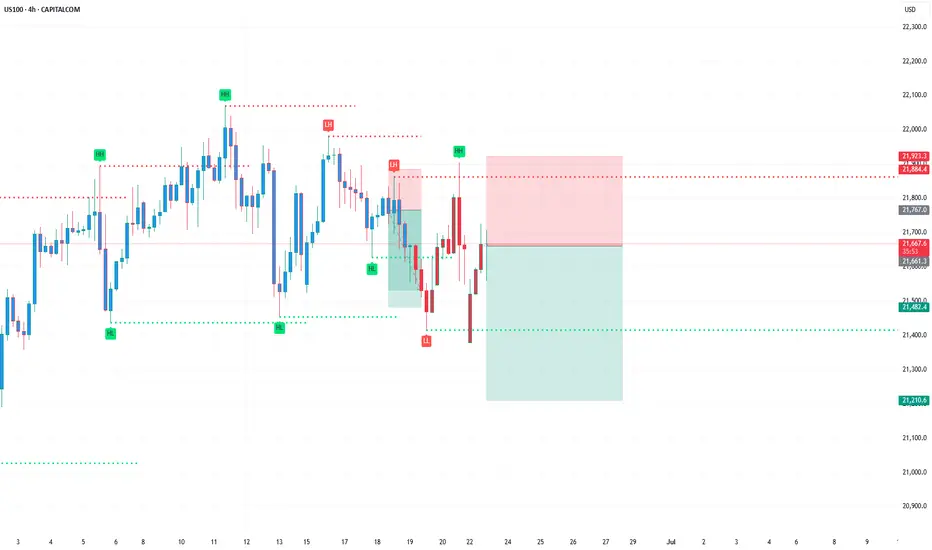
Nas100/US100 Short Setup based on Fundamentals
Hello everyone. We have seen the Nasdaq form a new local top at the 22k area and is now heading back down.
There are many reasons why price is falling but remember this only a temporary sell off as the master trend on the highest time frame is up not down.
Today (Friday 20th June) is OPEX. $6.6 Trillion of options are set to expire today and the Max Pain level is 21,500. Price could drive there to render most options worthless.
Institutions and hedge funds have increasingly added short positions or are sitting on the side lines. Indicating lack of buying from the larger players for the time being.
Buying volume is lower than the selling volume at the top of this rally.
We have 2 weeks roughly until trump tarrifs are implemented and not many trade deals have been made.
Iran-Israel conflict with a possible US involvement.
FED is leaning towards a more hawkish approach due to tarrifs but says the US economy is still growing.
How I am looking at this for the near future. In the chart I have marked my entry, My SL, My Max TP and where I would take partials on the way down. I may also even scale in more if I see the opportunity.
Thanks for reading.

My View on NAS1001. Price has been trending up for a long time.
2. A possible Reversal Pattern spotted
3. Head and Shoulder Pattern
4. Almost all elements of the Pattern have appeared
5. Refer to the Chart for entry details
6. Apply proper risk management based on your account size.
"Direction is Better than Speed"
Aliyu Gital

NAS100 WILL FALLLooking at this H4 charts, as we can see it, FUSIONMARKETS:NAS100 lost the backup of our H4 50EMA, im expecting a clean bounce at the retest of these 50EMA. Targeting the below 200EMA for TP.

USTECH H4 AnalysisUSTECH Showing a bullish Flag. If it breaks this zone above, Most probably can fly up to 22,106.35 and higher TO 23,200. If no, Can rally between 20,800, 20,400 or even lower. Trading Analysis from 23-06-25 to 27-06-25. Take your risk under control and wait for market to break support or resistance on smaller time frame. Best of luck everyone and happy trading.🤗

XAUUSD
🚨 Smart Money Sniper Signal – XAU/USD (Gold)
🕒 Timeframe: M15 or H1
📅 Date: June 25, 2025
---
🔍 Market Context
Current price: ~$3,326
Market structure: Bullish on H1
Liquidity grab zone: Observed around $3,322
Order block support: $3,318 – $3,322
RSI: Above 50 (bullish momentum)
---
🟢 Buy Setup (Sniper Entry)
Entry zone: $3,322 – $3,324 (on bullish confirmation)
Confirmation: Bullish engulfing or strong bullish candle on M15
Stop Loss: Below $3,318
Take Profit targets:
TP1: $3,330
TP2: $3,336
TP3: $3,344
🧠 Tip: Use a Risk:Reward ratio of at least 1:2. Set trailing stop once TP1 is reached.
---
🔴 Sell Scenario (If invalidation)
If price breaks below $3,318 with volume:
→ Wait for a retest of the zone and enter SELL
TP1: $3,312
TP2: $3,304
---
🔔 For TalionPromosal (TradingView page)
Use this caption for your idea post:
> 💥 Smart Money Signal (Gold – M15/H1)
Bullish structure still valid. Looking for sniper entry near $3,322 with OB + RSI confluence.
SL below $3,318. TP targets $3,330 / $3,336 / $3,344.
Risk-managed & institutionally aligned setup.
#SmartMoney #XAUUSD #Gold #SniperEntry #TalionPromosal #TradingView

NASDAQ Short-Term Outlook (Study Purpose Only)The NASDAQ index is showing signs of short-term weakness following a rejection near the 22,000–22,200 resistance zone. The recent breakdown from the consolidation range suggests bearish sentiment is building.
🔻 Key Observations:
Stop Loss Zone: 22,192
Price should ideally remain below this level for a bearish setup to remain valid. A move above this zone may invalidate the downside scenario.
Immediate Support Level: 21,010
If selling pressure continues, this is the first potential bounce zone. Watch price behavior closely here.
Deeper Support Target: 20,223
A break below 21,000 could open the door for a drop toward the 20,200 area — a previous accumulation/support level.
⚠️ Risk Management:
Traders may consider this type of setup if looking for short positions, but only with tight risk controls and clear confirmation of trend continuation.
📝 Disclaimer:
This analysis is strictly for study and educational purposes. It is not financial advice or a recommendation to take a trading position. Please consult a licensed financial advisor before making any investment decisions.

sell to buystructure narrative.
order flow; weak swings and failed zones.
liquidity; sweeps and inducements.
point of interests: order blocks(+/-)


Nasdaq: Bull flag breakout on daily chart, testing ATHsBeen a while since I last posted. So figured I'd share this quick chart. Market undoubtedly have been incredibly volatile this month. However luckily, the Nasdaq has been forming bull flag on the daily chart. This follows a strong prior uptrend. The breakout took place today, sending the index to test ATHs.
Notable stocks making a move are names like NASDAQ:AMZN and NASDAQ:NVDA , mainly due to the broader market strength. Other indices, such as the S&P 500 ( SP:SPX ) also are breaking out as they form a similar bull flag pattern.
At ATHs, this is a deciding factor of where the market goes next. Either it bounces off to near-term support, or the market rallies to a new all-time high until next cooldown.
Note: not financial advice

NAS100 SHORTElite Live Analysis
Market Structure: Bullish across the Weekly, Daily, and 4H timeframes.
Key Level: Price has reached a significant zone where a potential reversal is expected.
Confirmation: Transitional switch confirmed on the 1-Min, 3-Min, and 5-Min timeframes.
Execution: Entry based on the 5-Min confirmation.
Targets:
Structured liquidity levels
Lower liquidity pools resting beneath current price

USTECH Long opportunity USTECH is currently on a bullish impulse move, sitting at the resistance level of 22,000. price is trading above the 50 SMA and we can see momentum favors the bulls with the RSI above the 55 level
Expecting a drop in price, based on the technical analysis, where we could potentially see a retest of of the 21,800 price level before the bullish trend resumes beyond 22,000.
Fundamentals with the Iran Israel cease fire support further bullish indices with confidence coming back into the markets.

Can Geopolitics Power Tech's Ascent?The Nasdaq index recently experienced a significant surge, driven largely by an unexpected de-escalation of tensions between Israel and Iran. Following a weekend where U.S. forces reportedly attacked Iranian nuclear sites, investors braced for a volatile Monday. However, Iran's measured response - a missile strike on a U.S. base in Qatar, notably without casualties or significant damage - signaled a clear intent to avoid wider conflict. This pivotal moment culminated in President Trump's announcement of a "Complete and Total CEASEFIRE" on Truth Social, which immediately sent U.S. stock futures, including the Nasdaq, soaring. This rapid shift from geopolitical brinkmanship to a declared truce fundamentally altered risk perceptions, alleviating immediate concerns that had weighed on global markets.
This geopolitical calm proved particularly beneficial for the Nasdaq, an index heavily weighted towards technology and growth stocks. These companies, often characterized by global supply chains and reliance on stable international markets, thrive in environments of reduced uncertainty. Unlike sectors tied to commodity prices, tech firms derive their value from innovation, data, and software assets, which are less susceptible to direct geopolitical disruptions when tensions ease. The perceived de-escalation of conflict not only boosted investor confidence in these growth-oriented companies but also potentially reduced pressure on the Federal Reserve regarding future monetary policy, a factor that profoundly impacts the borrowing costs and valuations of high-growth technology firms.
Beyond the immediate geopolitical relief, other crucial factors are shaping the market's trajectory. Federal Reserve Chair Jerome Powell's upcoming testimony before the House Financial Services Committee, where he will discuss monetary policy, remains a key focus. Investors are closely scrutinizing his remarks for any indications regarding future interest rate adjustments, particularly given current expectations for potential rate cuts in 2025. Additionally, significant corporate earnings reports from major companies like Carnival Corporation (CCL), FedEx (FDX), and BlackBerry (BB) are due. These reports will offer vital insights into various sectors' health, providing a more granular understanding of consumer spending, global logistics, and software security, thereby influencing overall market sentiment and the Nasdaq's continued performance.