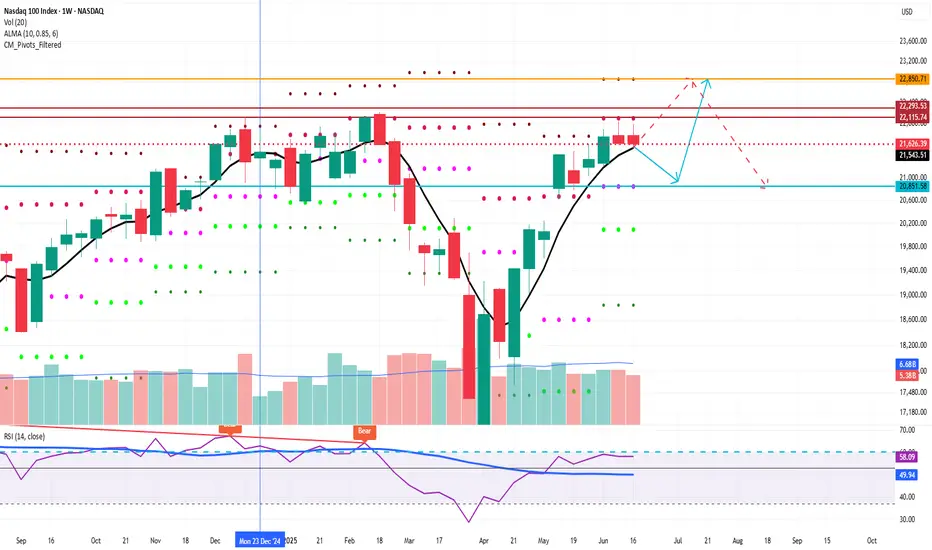
Nasdaq 100 Near Breakout – Eyes on 22,200 ResistanceThe Nasdaq 100 is approaching a critical technical level at 22,200. This resistance marks the upper boundary of recent consolidation and aligns with prior rejection zones. A clean break above this threshold could trigger a sharp upside move, possibly propelling the index into uncharted territory.
Geopolitical tensions have eased, and the dollar’s renewed weakness is supporting risk appetite, particularly in the tech-heavy Nasdaq. Strong earnings from key sectors are reinforcing bullish sentiment, with investors increasingly pricing in a favorable macro backdrop.
Technically, momentum is building. Price action has formed a series of higher lows, and buying pressure is intensifying near resistance. A breakout above 22,200 could ignite a strong rally, driven by stop orders and fresh bullish entries.
That said, traders should remain cautious. While the breakout setup is promising, a retracement toward support zones—such as 21,500 or the 20-day moving average—remains possible, especially if upcoming inflation or macro data disappoints.
For now, the 22,200 level remains the key to watch. A daily close above this level would shift the bias clearly higher, confirming breakout strength and potentially accelerating gains toward 22,800 or beyond.
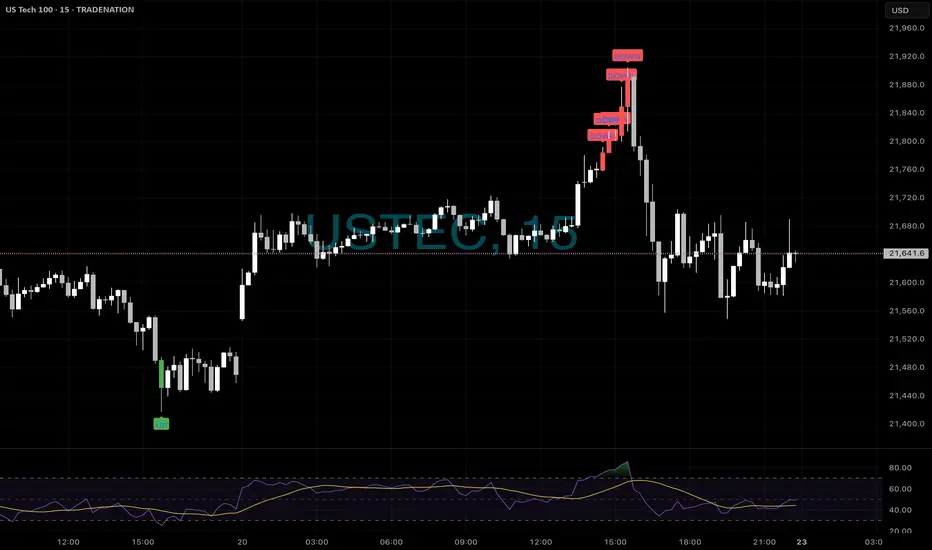
USTECH100MINICFD trade ideas


XAUUSD
🚨 Smart Money Sniper Signal – XAU/USD (Gold)
🕒 Timeframe: M15 or H1
📅 Date: June 25, 2025
---
🔍 Market Context
Current price: ~$3,326
Market structure: Bullish on H1
Liquidity grab zone: Observed around $3,322
Order block support: $3,318 – $3,322
RSI: Above 50 (bullish momentum)
---
🟢 Buy Setup (Sniper Entry)
Entry zone: $3,322 – $3,324 (on bullish confirmation)
Confirmation: Bullish engulfing or strong bullish candle on M15
Stop Loss: Below $3,318
Take Profit targets:
TP1: $3,330
TP2: $3,336
TP3: $3,344
🧠 Tip: Use a Risk:Reward ratio of at least 1:2. Set trailing stop once TP1 is reached.
---
🔴 Sell Scenario (If invalidation)
If price breaks below $3,318 with volume:
→ Wait for a retest of the zone and enter SELL
TP1: $3,312
TP2: $3,304
---
🔔 For TalionPromosal (TradingView page)
Use this caption for your idea post:
> 💥 Smart Money Signal (Gold – M15/H1)
Bullish structure still valid. Looking for sniper entry near $3,322 with OB + RSI confluence.
SL below $3,318. TP targets $3,330 / $3,336 / $3,344.
Risk-managed & institutionally aligned setup.
#SmartMoney #XAUUSD #Gold #SniperEntry #TalionPromosal #TradingView

Nasdaq: Bull flag breakout on daily chart, testing ATHsBeen a while since I last posted. So figured I'd share this quick chart. Market undoubtedly have been incredibly volatile this month. However luckily, the Nasdaq has been forming bull flag on the daily chart. This follows a strong prior uptrend. The breakout took place today, sending the index to test ATHs.
Notable stocks making a move are names like NASDAQ:AMZN and NASDAQ:NVDA , mainly due to the broader market strength. Other indices, such as the S&P 500 ( SP:SPX ) also are breaking out as they form a similar bull flag pattern.
At ATHs, this is a deciding factor of where the market goes next. Either it bounces off to near-term support, or the market rallies to a new all-time high until next cooldown.
Note: not financial advice

NAS100 | LTF viewpointWe are currently caught between 2 LQC candles that have both swept LQ and we are waiting for the break of the trend to the upside as we have tapped into to 68 & 72% fib levels
So the is a high chance we continue to the upside with NASDAQ BUT if market decides to disregard that setup o9f UPSIDE momentum the is a chance of sellers stepping into the market only if of LQC(liquidity swept candle) decides to not hold then we can begin looking for SELLING OPPORTUNITIES
FEEL FREE TO DROP A FEW ADVICES IN THE COMMENT SECTION IF YOU HAVE SOMETHING SIMILAR THAT SUPPORTS MY ANALYSIS OR IF YOU ARE SEEING SOMETHING DIFFERENT

USTECH Long opportunity USTECH is currently on a bullish impulse move, sitting at the resistance level of 22,000. price is trading above the 50 SMA and we can see momentum favors the bulls with the RSI above the 55 level
Expecting a drop in price, based on the technical analysis, where we could potentially see a retest of of the 21,800 price level before the bullish trend resumes beyond 22,000.
Fundamentals with the Iran Israel cease fire support further bullish indices with confidence coming back into the markets.

NAS Might Drop Due to Middle East TensionsWild times, eh?
In the midst of a new war in the Middle East, the NASDAQ (like most other indices) is bursting with symbolic strength.
Will it do well? One may doubt it.
Here is a short idea with a conservative target, supported by clearly bearish RSI divergences.

"NASDAQ 100: THE TECH ROBBERY! – Quick Profits Before Reversal?"🔥 "The NDX NASDAQ 100 INDEX Heist: Bullish Loot & Escape Before the Trap!" 🔥
🌟 Hi! Hola! Ola! Bonjour! Hallo! Marhaba! 🌟
Dear Money Makers & Market Robbers, 🤑💰💸✈️
Based on the 🔥Thief Trading Style🔥 (technical + fundamental analysis), here’s our master plan to heist the NDX - NASDAQ 100 INDEX. Follow the strategy on the chart—long entry is the play! Aim to escape near the high-risk RED Zone (overbought, consolidation, potential reversal). The bears are lurking, so take profits and treat yourself—you’ve earned it! 💪🏆🎉
🚀Entry (The Vault is Open!)
"Swipe the bullish loot at any price!"
For precision, place buy limit orders within 15-30min timeframe (recent swing lows/highs).
Set alerts! Don’t miss the heist.
🛑 Stop Loss (Safety Net)
Thief-style SL at nearest swing low (4H timeframe) → 21,770.00 (adjust based on risk/lot size).
🏴☠️ Target 🎯: 22,800.00
Bullish momentum is fueling this heist—ride the wave but exit before the trap!
📰 Fundamental Backing (Why This Heist Works)
Macroeconomic trends, COT data, geopolitics, and sentiment align for bullish moves.
Full analysis? Check 👉🔗🌎
⚠️ Trading Alerts (News & Risk Mgmt)
Avoid new trades during high-impact news (volatility = danger).
Use trailing stops to lock profits and dodge sudden reversals.
💥 Boost This Heist!
Hit 👍 (Boost Button) to strengthen our robbery squad!
More heists = More profits—stay tuned for the next steal! 🚀🤑
See you soon, fellow thieves! 🤝🎉

NASDAQ Potential UpsidesHey Traders, in the coming week we are monitoring NAS100 for a buying opportunity around 21,500 zone, NASDAQ is trading in an uptrend and currently is in a correction phase in which it is approaching the trend at 21,500 support and resistance area.
Trade safe, Joe.

NASDAQ may retrace till 26850 before making an upmove NASDAQ may retrace till 26850 before making an upmove that can be round 22850 in next few weeks. This is a weekly chart.
This is not a recommendation, but a study.
NAS100 Analysis – Structure Breakout or Trap?📍 Levels Marked: 22,101 Resistance | 21,880 Mid-Level | 21,375 Channel Support
⸻
📊 Technical Breakdown:
The NAS100 has surged into the 22,000+ range, breaking above the mid-level channel boundary after consolidating beneath it for days. This breakout takes us right back into an untested supply zone from March.
On the lower timeframes (1H & 23min), price cleanly cleared multiple lower highs with aggressive bullish momentum, printing a new intraday high at 22,015. However, structure is still trapped inside a long-term ascending channel on the 4H and D1 — and this move could be setting up a liquidity grab before reversal.
Key zone to watch:
• 22,101 – 22,200 (daily resistance + equal highs)
• 21,880 – 21,920 (possible retest zone)
• 21,375 (channel base support)
⸻
📉 Trade Ideas:
• Short Bias if price rejects the 22,100–22,200 area with bearish confirmation on lower timeframes. Target: 21,800 – 21,600.
• Long Bias only if price gives a bullish retest of the 21,880–21,920 zone with clean structure. Target: 22,222+ with tight risk.
⸻
💡 Final Thoughts:
A textbook case of a channel edge breakout — but breakout or fakeout? Always wait for confirmation and let structure guide the setup. We’re either about to print new highs or see a sharp correction.
📌 Mark your levels. Watch the retest. Execute with confidence.

NAS100 | Intraday buy setupTimeframe: M15
🔸 Bias: Short-term bullish (scalp to premium zone)
Price just tapped into a fresh M15 demand zone following a strong impulsive leg and is now showing early signs of a reaction (entry model confirmation ✅). Liquidity has been taken beneath the short-term low, and I'm now looking for a short-term push back into the premium supply area near 21,800.
🧩 Confluences:
Bullish BOS + Demand zone reaction
Liquidity sweep below Asian session low
Entry model + candle shift on M15
Potential reversal from discount → premium
🎯 Target: 21,800 zone
❌ Invalidation: Clean break & hold below 21,675
⏳ Type: Intraday scalp / short-term swing
“Risk managed. Liquidity collected. Now we let price tell the rest of the story.” 🚀

NASDAQ READY TO CONTINUE THE LONG-TERM WEEKLY BULLISH RUN
FX:NAS100
I just entered this buy trade on Nasdaq on the daily time frame.
The trade setup is a Swing trade following the monthly and weekly orderflow.
The Monthly is bullish, the weekly is also bullish, so I entered on the daily time frame retracement.
My overall take profit is a risk reward of 1:4.

Nasdaq continuation sellsH4: STILL BULLISH INTERNALLY WITH OUR LAST SIGNIFICANT HL AT 21000
-Possible major chOch on H4 is very possible due to the HTF major zone we at
-Wait for proper H1 & lower tineframe confirmations before jumping in any trades
H1: BEARISH MARKET STRUCTURE STARTING TO PLAY WITH LAST LH AT 21925
-Potential continuation of sells all the way down to take out H4 hl a 21000
-We recently broke below a buying range on H1 & created a selling range
-Possible pullback buys before sells within that range are imminent
M15: We have a nice supply+fvg for sells at 21835
-Wait for price to pullback in there then M1 chOch then attack

Triple Top Forming on NAS100? Reversal Attempt BrewingNAS100 may be carving out a triple top or micro head-and-shoulders, hinting at a potential short-term reversal. A confirmed break of the current range is still required to validate downside momentum. With heightened geopolitical risk (U.S. strike on Iran), capital may rotate into gold and oil, weighing on equities. This is a low-risk, short-term idea only—more structure and confirmation needed before hunting larger trend moves.

NASS1001. Nasdaq 100 (NASS100) Performance
As of mid-June 2025, the Nasdaq 100 index is around 21,600 to 21,700 points, showing moderate volatility with recent declines amid geopolitical tensions and trade concerns.
Technology stocks, including semiconductor giants like NVIDIA and Broadcom, remain influential on Nasdaq movements.
Market sentiment is cautious due to escalating Middle East conflicts and US-China trade uncertainties.
2. US 10-Year Treasury Yield (US10Y)
The US 10-year Treasury yield is hovering around 4.3% to 4.4% in June 2025.
Yields have edged up recently, reflecting inflation expectations and Federal Reserve monetary policy stance.
Rising yields often pressure growth stocks, including tech-heavy Nasdaq components, due to higher discount rates on future earnings.
3. US Dollar Index (DXY) Dynamics
The DXY has been relatively stable but showed some weakening in 2025 despite rising Treasury yields, reflecting complex market dynamics including geopolitical risks and shifts in capital flows.
A weaker dollar can support Nasdaq by boosting earnings of multinational tech firms through favorable currency translation, while a stronger dollar can weigh on exports and earnings.
4. Interplay Between NASS100, US10Y, and DXY
Rising US10Y yields tend to put downward pressure on Nasdaq 100 due to increased discount rates and borrowing costs for growth companies.
DXY movements influence Nasdaq via currency effects on multinational revenues and investor risk appetite.
Recent geopolitical tensions and trade uncertainties have increased market volatility, occasionally decoupling typical correlations.
Softer inflation and weak labor data have temporarily boosted investor sentiment, supporting modest Nasdaq gains despite yield pressures.
Conclusion
the Nasdaq 100 faces pressure from rising US 10-year Treasury yields, which increase discount rates on tech stocks, while geopolitical tensions and trade uncertainties add volatility. The US Dollar Index’s relative weakness provides some support to Nasdaq earnings, partially offsetting yield headwinds. Market participants remain cautious, balancing inflation data, Fed policy, and global risks in their outlook.
#NASS100

sell to buystructure narrative.
order flow; weak swings and failed zones.
liquidity; sweeps and inducements.
point of interests: order blocks(+/-)

Pullback before next leg up
NASDAQ’s looking weak short term. We’ve seen multiple rejections from the highs, an M pattern forming on the daily, and RSI divergence creeping in on the daily — momentum is clearly fading. I already took profit around 21980. And a few small swings between the range since 3rd of June.
The rally off the tariff drop was sharp, but it feels mechanical. Bulls look tired here. You can see price is stalling — pushing into the same highs but getting nowhere. Classic signs of distribution.
That said, this isn’t the start of a full-blown bear market. The long-term trend remains bullish. AI investment is still piling into the U.S., tech’s still leading globally, and structurally we haven’t broken down yet. Some weakness is starting to show though.
But short term, I think we see a pullback. The Fed’s still sitting on the fence with rate cuts, which is creating uncertainty. Add that to the current geopolitical tensions, and there’s enough on the table to justify a temporary risk-off move.
If price breaks and closes above 21,860, I’ll reassess and potentially shift back to a bullish bias. Until then, I’m leaning short and letting price action do the talking.
My key downside levels:
TP1: 21,483 — scale out and protect.
TP2: 21,322 — potential bounce from this area.
TP3: 21,145 — structure starts to weaken.
TP4: 20,894 — bears starting to control and a deeper flush, I’ll reassess bias at this level.
SL @ 21850 on my second entry short
Short term: pullback likely.
Big picture: still bullish — but bulls need to reset before any next leg up.
NASDAQ - Shorts📉 Perfect Friday Reversal Call – NAS100 15min
Another clean short setup from our ELFIEDT – X-REVERSION system on Friday’s rally top.
🟥 Just look at the stacked “DOWN” signals — not one, not two, but multiple confirmations printed right at the exhaustion high.
These are standalone signals, meaning you don’t need anything else to act — just place your stop above the signal candle and let price do the rest.
💡 Bonus: Notice how the RSI printed divergence just before the top?
This is how our system combines statistical reversion + momentum analysis — no fluff, no guesswork.
💬 If you’re tired of chasing trades and getting dumped on the wrong side of a move…
👉 It’s time you trade with logic, timing, and precision.
📲 Message us if you’re ready to use this indicator and start making money from real market structure and turning points.
We’ve shown it time and again — let the results speak.
⸻
#NAS100 #ReversalTrading #ShortSetup #ELFIEDT #SmartMoney #NoLag #TradingViewIndicators #TechnicalAnalysis #PriceAction #RSIDivergence #ReversionStrategy #FridayMoves #TradeTheTurn #EarnFromMarkets #ProToolsForTraders
NASDAQ Bread and Butter & Turtle Soup Example XIIaight, so im gonna break down a trade i took on nasdaq today using a setup i picked out myself from the ict concepts. just my own flavor of it, ya know
before i knock out at night, i open up the charts real quick — just tryna see if there's any clean liquidity chillin’ nearby. if there aint, i shut it down and catch some solid sleep. but if there is... bingo baby
this basically means i might just wake up rich tomorrow, bro. on the daily, im seeing two strong green days back to back, and right above that boom some equal highs just sitting there, begging to get run. they are even cleaner on the 1h. bias locked in. im waking up tomorrow and hunting longs, simple as that.
i mark up the daily open first thing. if im lookin for longs, i wanna see some turtle soup under the open. if im hunting shorts, i need that setup above the open. thats just how i roll.
if there is a swing low, trend liquidity, or some equal lows carryin over from yesterday, im locked in on those levels for turtle soup. if not, im just chillin, waitin for price to build some fresh liquidity during the day and then snatch it.
in this setup, i got some leftover liquidity from yesterday plus a clean 4h fvg sittin there like a neon sign.
next, i check the time. liquidity grabs usually hit during one of the killzones depends on the pair, but im watchin asia, london, or new york sessions.
then i scope out if there is any news droppin around that time, especially stuff that could move the pair. no point in getting blindsided.
and yeah, i always peep correlated pairs too sometimes they snitch before your chart even says a word.
when all the stars and planets line up just right, that is when I drop down to the 15m and wait for a clean csd to show up. but here is the thing i dont jump in the second i see it. i wanna see price actually leave the liquidity zone.
yeah, it might lower my rr a bit, but the win rate goes way up. It keeps me outta those fake-ass turtle soups that look good at first but just wanna wreck your stop.
once im in the trade, i usually try to close out half the position the same day take profits where the chance of price reversing is damn near zero. then i let the other half ride toward my target liquidity. just lettin it breathe, do its thing.
thats it, peace out

Nasdaq is facing tough resistance at Triple TopNasdaq is facing tough resistance at Triple Top. Market sentiments are also negative due to Iran- Israel conflict.
