US100 Update This is a 45-minute chart of the US 100 (NASDAQ Index) from CAPITAL.COM, and it presents a bullish continuation scenario.
---
Key Highlights:
Current Price: 22,254.6
Change: +72.7 points (+0.33%)
---
Chart Structure:
Support Zone (Lower Blue Box): ~21,950–22,050
Resistance Zone (Upper Blue Box): ~22,400–22,500
Dotted Path Projection: Suggests the following potential move:
1. Climb toward the upper resistance zone
2. Brief pullback
3. Continuation breakout above 22,500 to around 22,600
---
Interpretation:
Current Trend: Bullish, with a strong series of higher lows and gradual build-up
Market Bias: Expecting continuation of the uptrend as long as price holds above 22,050
Potential Trade Idea:
Buy on Dip: Near 22,100–22,150 zone (if a pullback happens)
Target: 22,500–22,600
Stop-Loss: Below 22,000
---
Summary:
Trend: Bullish
Setup Type: Breakout Continuation
Watch for: Consolidation near 22,400 before a push higher
Would you like me to compile trade parameters (entry, stop, target) for all three setups (Gold, BTC, NASDAQ) in one place?
USTECH100MINICFD trade ideas

Bullish IdeaExplained on graph. I justify the bull using OB and FVG and sweeps of Liquidity from London lows, if all aligns I will take this trade.

Buy NasAfter breaking the recent H4 resistance we hoping that Nas is reaching for the Daily higher high and probably breaking it.
Bearish SentimentIf structure follows, I will be looking to take reversal post NY open and short this once Buy Side liquidity gets taken out.
TP's will target Liquidity from the London session lows.

NAS100 - Will the stock market continue to rise?!The index is trading in its short-term descending channel on the four-hour timeframe between EMA200 and EMA50. If there is no re-up and the channel is broken, I expect a correction to form, the target of which can be the bottom of the descending channel.
If the channel top is broken, we can expect a new ATH to be recorded in the Nasdaq index. It is better to wait for confirmation in case of a breakdown in order to control the risk further.
Over the past week, the Nasdaq has managed to stay within a stable range, especially despite geopolitical pressures, mixed signals from the Federal Reserve, and some concerns in the semiconductor sector. This stability is largely due to the strong fundamentals of large technology companies, the reduction in distribution days (selling pressure) in the market, and renewed expectations of interest rate cuts later in the year.
At a structural level, the number of distribution days, which indicate selling pressure from large institutions, has reached a relatively low number of 3 days in the Nasdaq over the past month. This is a sign of the weakness of heavy selling at price peaks and the market's willingness to maintain long positions. Unlike trends seen in previous years, this time the market has shown no signs of widespread divergence or fundamental weakness, even despite strong inflation data or concerns about new trade restrictions with China.
This trend is largely supported by the stellar performance of companies such as Nvidia, Microsoft, Apple and other major players in the artificial intelligence and technology sectors. Revenue growth, increased investment in AI infrastructure, as well as the return of institutional investors’ confidence in technology stocks, have led the Nasdaq to record significant returns since the beginning of 2025. Analysts from major financial institutions such as Goldman Sachs and Morgan Stanley, while warning of potential selling pressure on the index, remain positive about continued growth, of course, assuming that economic data does not deviate from the expected path.
However, some risks are clearly visible in the trading week ahead. The most important of them is the possibility of geopolitical tensions again affecting the market. In recent days, oil prices have risen and financial markets have experienced moments of fear after tensions in the Middle East escalated and the US political response to Iran and Israel's moves. Although the Nasdaq was able to withstand these fluctuations, the market remains very sensitive to energy price spikes and their impact on inflation.
Important data in the coming week could also determine the market's direction. The release of the Core PCE index, the Fed's preferred inflation measure, as well as data on unemployment insurance claims, both play a key role in the interest rate outlook. If inflation data is lower than expected, the likelihood that the Fed will start cutting rates in September or November increases, which would be a bullish stimulus for the stock market and especially the Nasdaq.
On the other hand, potential pressure on the semiconductor group - especially if new restrictions on technology exports to China are imposed - could disrupt the market trend. Last Friday, just one news report on the possibility of restricting exports of advanced chipsets caused the Nasdaq to fall by more than 0.6%. If this trend becomes official US government policy, it could cause a correction in stocks of companies such as Nvidia, AMD and ASML, which are heavy weights in the Nasdaq index.
In addition to these factors, next week will also see the release of quarterly reports from major companies such as Micron, FedEx and Nike. The results of these reports, especially in the area of sales and cost forecasts, could affect economic growth expectations. If the figures are better than expected, the Nasdaq could move towards new highs. However, if the data is released, the market could enter a short-term correction phase.
In terms of correlation with monetary policy, the Nasdaq index has become more sensitive than ever to interest rates and cash flows. The dollar price, real interest rates, and the direction of Treasury bonds all now have a direct impact on the valuation of technology companies. As a result, any change in the path of monetary tightening or easing is immediately reflected in the Nasdaq’s performance. However, analysts believe that the market will remain in a “wait and see” phase until the official data is released in July. In summary, the Nasdaq index is currently in a situation where its fundamentals are supported by the profitability of large technology companies, the easing of institutional selling pressure, and the possibility of a rate cut. At the same time, the market remains highly sensitive to major geopolitical news, trade policy, and economic data. As a result, the week ahead can be considered a “two-sided” period, where opportunities and threats are in a delicate balance, and only economic data and quarterly results can tip the balance in the direction of an increase or a correction.

Market Structure 1hr According to what's happening between Iran and Isreal and Trump has attacked Iran in my anticipation and what I do see in the marketplace honestly right now and how the markets has been moving its so terrible so being more careful is important but am anticipating lower prices in this market NAS100 Index, that's not calling it for anybody to short but that's what am thinking is going to happen, it's going to be a nice week ahead at Sunday opening and there we shall see where we want to roll to

NASDAQ Short-Term Outlook (Study Purpose Only)The NASDAQ index is showing signs of short-term weakness following a rejection near the 22,000–22,200 resistance zone. The recent breakdown from the consolidation range suggests bearish sentiment is building.
🔻 Key Observations:
Stop Loss Zone: 22,192
Price should ideally remain below this level for a bearish setup to remain valid. A move above this zone may invalidate the downside scenario.
Immediate Support Level: 21,010
If selling pressure continues, this is the first potential bounce zone. Watch price behavior closely here.
Deeper Support Target: 20,223
A break below 21,000 could open the door for a drop toward the 20,200 area — a previous accumulation/support level.
⚠️ Risk Management:
Traders may consider this type of setup if looking for short positions, but only with tight risk controls and clear confirmation of trend continuation.
📝 Disclaimer:
This analysis is strictly for study and educational purposes. It is not financial advice or a recommendation to take a trading position. Please consult a licensed financial advisor before making any investment decisions.

Weekly Market Analysis for US100
OMFA Strategy. OMFA means Overcoming FOMO through Order, Mastery, Focus and Abundance!

NAS100 Bullish Breakout SetupNAS100 Bullish Breakout Setup 🚀
🧠 Chart Analysis (H4 timeframe)
🔹 Ascending Channel:
Price has been trending inside a clear ascending channel (blue zone), supported by higher highs and higher lows.
🔹 Support & Resistance:
Support: Around 21,635.32 – tested multiple times (highlighted by 🔵 arrows).
Resistance: Around 22,265.19 – recent highs and psychological barrier.
🔹 Double Bottom Formation 👣:
Near support zone, a potential double bottom (bullish reversal pattern) is visible. The neckline has been challenged.
🔹 Breakout Confirmation 🟢:
Price has broken above the descending neckline of the double bottom and is hovering near 21,644, indicating potential bullish continuation if sustained.
🔹 Target 🎯:
Projected breakout target lies at 22,265.19, aligning with the previous resistance zone.
🔹 Volume & Momentum 📊:
While not shown, a breakout above the neckline generally needs strong volume confirmation to validate the move.
📌 Conclusion:
If price sustains above the 21,635 – 21,644 area and gains momentum, the path to 22,265 looks likely ✅. However, a false breakout could drag the price back into the channel.

NAS100...Ever The Bullish Instrument (Part 41)We are entering week 12 since the market signaled it's lowest point of 2025...and the 2nd week of the upper level consolidation between the last Daily Low and the current daily High...
This was confirmed by the the daily consolidation point created by the lowest point of last week on Thursday at 9:49 am... (See M1 Chart)
The market then bought 4,700 for a nice consolidatory trend move in favor of the bulls.
This was followed up with a quick hard sell which is expected in consolidated market such as we have.
There will be lot's of great opportunities favoring buyers and sellers, however the main moves for me are always the buys from my largest HL and the market has proven that over the last 11 weeks the lows have been intact.
Just remember any sells in the market are only temporary retracements to another HL on the largest timeframe.
I do not react to news as the market only trades the defined structure...any craziness that happens in the world only creates volatility within an already established market structure.
So for this week...it's business as usual...I wait for my next entry at the HL just below 21449.0 or at the next confirmed HL.
Happy trading...
My strategy is and will always be:
HL's to HH's Guaranteed!
#oneauberstrategy

Fractal to move UPAs you can see the fractal it seems like the price now so if that true we will se up movement before correction again to make new highs

NASDAQ Bullish Play into Liquidity Before Potential ReversalForecast:
NOTE: At this moment, this is a forecast and trades will be taken dependent on live PA.
Price has reacted strongly off the 21,410–21,430 Daily Order Block, suggesting bullish intent. If bullish structure holds, I expect a move into the 22,060–22,130 liquidity zone, where sell-side setups could form.
This is a classic Buy to Sell model:
Buy from OB at ~21,420
Target liquidity above recent highs (~22,100+)
Look for shorts after sweep into 22,130–22,220 range
Invalidation: Break and close below 21,410 suggests the OB failed — potential deeper drop toward 20,700.

*NAS100| Weekly Breakdown - Structure Is PriceWhew—Nasdaq was a wild one this week, but once you master structure, liquidity, and OBs, the chaos turns into clarity.
Price held my 30M demand zone, even after a sketchy wick-based reaction early on. First long position? Quick scalp to the highs—in and out, no burger 🍔.
Didn’t wait for a full mitigation at first—anticipated the bullish momentum by staying aligned with structure. Later, price came back and mitigated the zone with body closes, confirming the intent for another long setup into next week.
Yes, I hold trades over weekends—because here’s what I’ve figured out:
“Price is structure. Structure is price. Master that, and it flows exactly how it should.”
This week was just another example of that.
Bless Trading!

NSDQ100 bullish continuation supported at 21300Markets & Geopolitics:
Investors are holding back as Trump may try diplomacy before acting against Iran. Oil prices dropped, European stocks rose, and the dollar slipped.
Tensions remain high: Israel hit Iranian missile and nuclear sites, and Iran’s president demanded Israel stop unconditionally. Iran’s foreign minister is in Geneva for talks, and the country is speeding up oil exports.
Technology:
SoftBank’s founder Masayoshi Son wants to partner with TSMC to build a huge AI and robotics hub in Arizona. It’s unclear if TSMC will join, as it’s already investing $165 billion in the US.
US Politics & Immigration:
A court backed Trump’s use of the National Guard during LA protests, despite pushback from California’s governor. A deeper report looks at how immigration raids affect workers.
Trade & Business:
Canada may raise tariffs on US steel and aluminum if trade talks stall. Meanwhile, Temu’s US sales are falling as it cuts back on ads. A Fidelity manager says markets have likely priced in Trump’s tariff threats and sees opportunity in mid-sized companies.
Key Trading Levels:
Resistance Level 1: 22070
Resistance Level 2: 22370
Resistance Level 3: 22780
Support Level 1: 21300
Support Level 2: 21060
Support Level 3: 20820
This communication is for informational purposes only and should not be viewed as any form of recommendation as to a particular course of action or as investment advice. It is not intended as an offer or solicitation for the purchase or sale of any financial instrument or as an official confirmation of any transaction. Opinions, estimates and assumptions expressed herein are made as of the date of this communication and are subject to change without notice. This communication has been prepared based upon information, including market prices, data and other information, believed to be reliable; however, Trade Nation does not warrant its completeness or accuracy. All market prices and market data contained in or attached to this communication are indicative and subject to change without notice.

USNAS100- Geopolitical Pressure Builds,NAS at Key Decision PointUSNAS100 – Technical Overview
🔻 Bearish Outlook:
The price is currently testing 21780. A 4H candle close below this level would confirm downside continuation toward 21635.
A break below 21635 would further strengthen the bearish trend, targeting 21470 and 21375.
🔺 Bullish Scenario:
Bullish momentum may return if the price breaks and holds above 21780 on the 4H timeframe, with upside targets at 21930, and potentially 22090.
• Support: 21635/ 21475 / 21375
• Resistance: 21780 / 21930 / 22090

SELL NAS100 - TEXT BOOK SET UPFollowing the trend. The trend has been making LHs and LLs. I am just following the trend nothing much.

Who got in?🟢 NAS100 15min – Bottom Sniped to Perfection!
Another textbook bounce called in real-time by the ELFIEDT – X-REVERSION indicator.
✅ The UP signal printed at the exact low
📈 Price launched shortly after with a near vertical reaction
💥 No hesitation. No lag. No repainting.
⸻
🔍 Still watching from the sidelines?
This is what precision looks like when momentum, volatility and structure all align — and we’ve automated that edge into one system.
📌 Just follow the rules:
• Enter on the signal close
• SL below the signal bar
• Let the market do the rest
⸻
🔥 If you’re still hesitating… you might just be watching these trades instead of catching them.
Time to load up the ELFIEDT – X-REVERSION tool and trade with confidence.

Reversal in Play or Institutional Continuation? | NAS100USDCritical Zone with VEP Trader ⚠️
Nasdaq 100 (NAS100USD) is showing mixed signals — and it’s exactly in these types of setups that our VEP Trader strategy shines. Here's what I'm seeing and how we're breaking it down step by step.
🔍 1. Trend Confirmation (1D)
On the daily timeframe, NAS100USD is showing a weak bullish trend based on the Support & Resistance and the Squeeze Momentum indicators.
📉 However, the most recent daily candle swept liquidity from two key days:
📅 June 6
📅 June 13
This triggers an alert in our VEP strategy: liquidity taken = institutional zone possibly in play.
💧 2. Liquidity Sweep + FVG (Fair Value Gap)
After the sweep, switching to the 1-hour timeframe (1H) reveals a large Fair Value Gap (FVG) just below the cleared liquidity zone.
This offers a potential setup — only if price returns to that FVG, and the structure validates the trade:
Retest the FVG zone
Show signs of reversal structure
Confirm with bullish Squeeze Momentum on lower timeframes
🛠️ 3. Execution with VEP Trader
🎯 If price pulls back into the FVG, we’ll be watching for:
Bullish reaction after liquidity has been swept
Clear bullish divergence in momentum
Previous support and EMA alignment in 5M/2M charts
🟢 If all conditions align → possible CALL entry based on VEP structure.
⛔ Stop Loss & 🎯 Take Profits (VEP Guidelines)
Suggested SL: below the FVG or last clean low
TP1: immediate reaction zone or recent high
TP2: next liquidity zone above. Up to four TP
Or target the last pullback for a more secure exit
✅ Final Thoughts
This is a classic scenario where we don’t guess — we wait for institutional confirmation.
The VEP Trader Strategy guides us with Vision, Execution, and Precision.
👉 What do you think?
Is NAS100USD gearing up for a new leg up — or was that just a liquidity flush before a deeper move?
Drop your take in the comments 👇
#NAS100USD
#VEPTrader
#FairValueGap
#LiquiditySweep
#SmartMoneyConcepts
#PriceAction
#TechnicalAnalysis
#InstitutionalTrading
#MarketStructure
#CleanSetup
#DivergenceSetup
#MomentumAnalysis
#GapTrading
#TradeWhatYouSee
#ScalpingForex
#AlgoPro
#ForexNAS100
#LiquidityZones
#SqueezeMomentum
#IntradaySetup
#BreakdownStrategy
#SupportResistance
#ReversalWatch
#PrecisionTrading
#TradingPlanReady

NAS100 WILL FALLLooking at this H4 charts, as we can see it, FUSIONMARKETS:NAS100 lost the backup of our H4 50EMA, im expecting a clean bounce at the retest of these 50EMA. Targeting the below 200EMA for TP.

June 19th - 1st combine tradeGreat trade
Need more confidence to trust my analysis and hold the trade to full TP
Fill Gap model trade

Hanzo / Nas100 30 Min ( Accurate Tactical Break Out Zones )🔥 Nas100 – 30 Min Scalping Analysis (Bearish Setup)
⚡️ Objective: Precision Breakout Execution
Time Frame: 30-Minute Warfare
Entry Mode: Only after verified breakout — no emotion, no gamble.
👌Bullish After Break : 21710
Price must break liquidity with high volume to confirm the move.
👌Bullish After Break : 21550
Price must break liquidity with high volume to confirm the move.
☄️ Hanzo Protocol: Dual-Direction Entry Intel
➕ Zone Activated: Strategic liquidity layer detected — mapped through refined supply/demand mechanics. Volatility now rising. This isn’t noise — this is bait for the untrained. We're not them.
🩸 Momentum Signature Detected:
Displacement candle confirms directional intent — AI pattern scan active.
— If upward: Bullish momentum burst.
— If downward: Aggressive bearish rejection.
Hanzo / Nas100 30 Min ( Accurate Tactical Break Out Zones )

Nasdaq-100 Wave Analysis – 19 June 2025- Nasdaq-100 reversed from long-term resistance level 22000.00
- Likely to fall to support level 21000.00
Nasdaq-100 index recently reversed down from the major long-term resistance level 22000.00 (which has been steadily reversing the price from the end of last year).
The downward reversal from the resistance level 22000.00 will form the weekly Shooting Star candlesticks reversal pattern if the price closes this week near the current levels.
Given the strength of the resistance level 22000.00 and the overbought weekly Stochastic, Nasdaq-100 index can be expected to fall to the next support level at 21000.00.

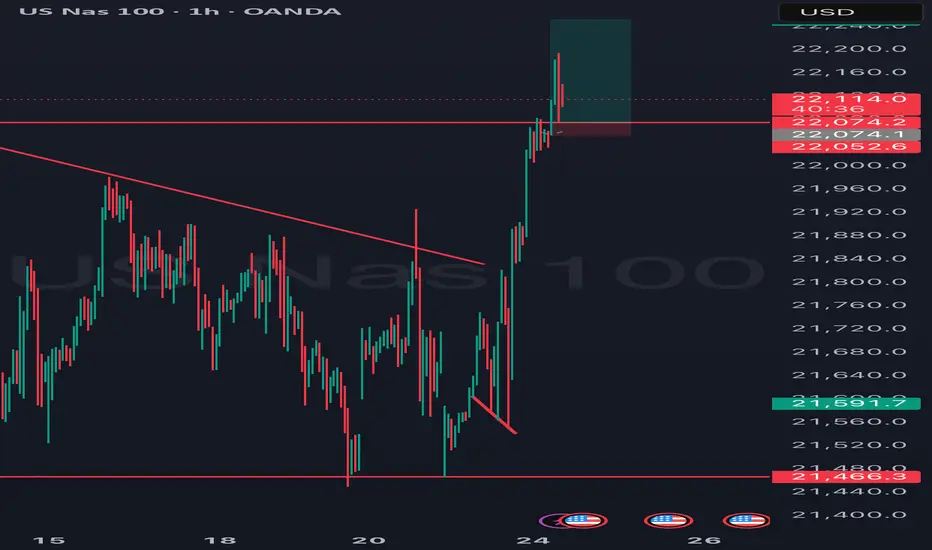
SELL-THE -RALLY :Swing trade limit Trend & Structure Broken
The green up-trend line and the last swing low were breached (you saw a BOS and CHoCH). That’s your first clue that buyers have lost control.
Failed Rally into Supply
When price pulled back up, it stalled under the old swing high / “equilibrium” zone. It never made a fresh higher high—so there’s no reason to chase longs.
Entry (Blue @ ~21,689) 🔵🚀
After price broke the rising trendline and the last swing low, it rolled back up into the equilibrium/supply area. That gives you a “sell-the-rally” entry at the blue level—where late buyers and remaining shorts congregate.
Stop-Loss (Red @ ~22,071) 🔴❌
Placed just above the prior swing high and the upper edge of the supply zone. If price pops above this red line, it signals the short setup has failed and bulls are back in control.
Take-Profits (Greens @ ~21,448 → 21,066 → 20,718 → 20,306) 🟢🎯
These green levels are the next pockets of demand/value below:
21,448 – the minor PDL/PWL area 📉
21,066 – first major demand zone 💰
20,718 – deeper value area 📦
20,306 – unfilled gap that often attracts fast buyers ⚡
Happy trading! 👍
