Dow Jones Potential DownsidesHey Traders, in today's trading session we are monitoring US30 for a selling opportunity around 44,300 zone, Dow Jones is trading in a downtrend and currently is in a correction phase in which it is approaching the trend at 44,300 support and resistance area.
Trade safe, Joe.

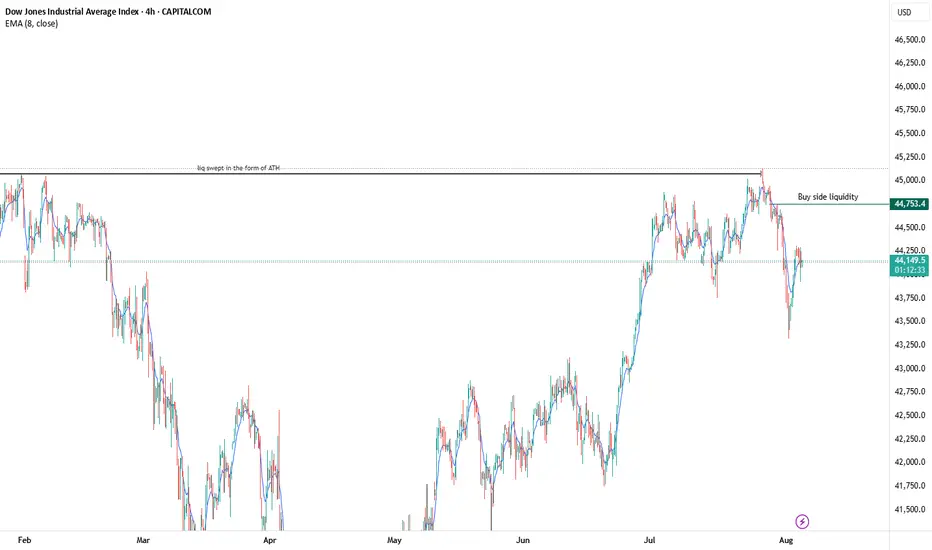
US30 Sell offmajor move to the downside coming up, once we get the buyside liquidity sweep ill be looking for a heavy short position. Liquidity has already been sept in the form of equal high at the area of all time high. the internal liquidity is what I'm looking for to get swept, then its all down hill from th
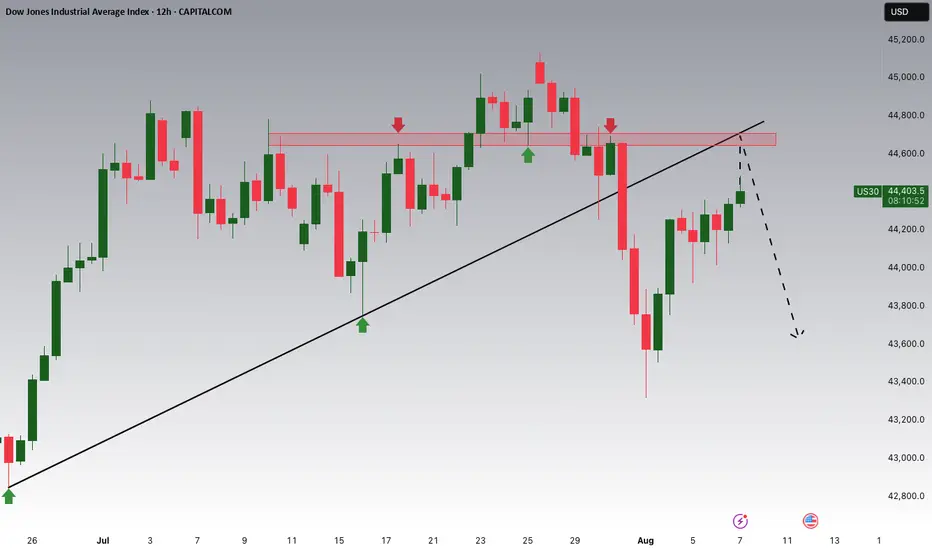
KOG - US30Moving on from the previous chart we shared on DOW you can see our red box worked well and gave us the move we wanted upside, however, we stopped just short of the ideal target level.
For that reason, and after looking at the liquidity indicator we will monitor the boxes here for a possible retrace

DOW JONES INDEX (US30): Bear Trap & Bullish MovementWe see a clear example of a bear trap on 📈US30 on a 4H time frame
The market initially breached and closed below a crucial support level but then rebounded, and formed an ascending triangle.
A buy signal will be triggered by a bullish breakout above the pattern's neckline, leading us to expect f

US 30 Index – Potential Rebound or Deeper Retracement Ahead?Just as the US 30 became the last of the three major US indices to register a new all time high last Monday at 45160, on a final wave of positivity generated by the announcement of a trade deal between the US and EU, it was snatched away again as traders used the up move to take profit on longs.

Dow Jones Breakout and Potential RetraceHey Traders, in today's trading session we are monitoring US30 for a selling opportunity around 44,650 zone, Dow Jones was trading in an uptrend and successfully managed to break it out. Currently is in a correction phase in which it is approaching the retrace area at 44,650 support and resistance a

US30 Bullish Bias Builds on Fed and Earnings OptimismUS30 – Market Overview
The market is showing bullish momentum, supported by recent developments from the Federal Reserve and a strong corporate earnings season.
Technically, the price action suggests a continuation of the uptrend toward 44610.
🔻 However, bearish momentum may be triggered if the pri

SHORT ON US30US30 Has given us a nice CHOC (Change of Character) to the downside.
This indicates a huge potential of US30 dropping more after it pulls back into the supply zone that created the change.
Dollar news is also a catalyst today for this play. If news comes out good for PMI and makes the dollar ris


See all ideas
Displays a symbol's price movements over previous years to identify recurring trends.
Frequently Asked Questions
Wall Street CFD reached its highest quote on Jul 28, 2025 — 45,129.6 USD. See more data on the Wall Street CFD chart.
The lowest ever quote of Wall Street CFD is 12,008.5 USD. It was reached on Jun 4, 2012. See more data on the Wall Street CFD chart.
Wall Street CFD is just a number that lets you track performance of the instruments comprising the index, so you can't invest in it directly. But you can buy Wall Street CFD futures or funds or invest in its components.