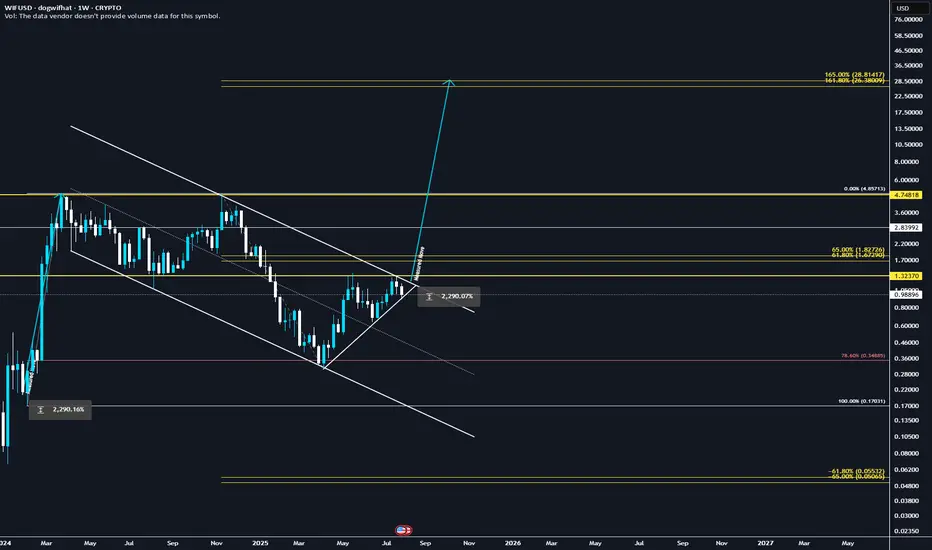
They're lying! WIF will explode to 28.8$ ✅ Golden Pocket Extension: $28.80 aligns with the 1.618–1.65 fib extension (golden pocket zone) from the last major impulse.
✅ Measured Move: Breakout from the prior downward consolidation projects to ~$28.80 when using the height of the range added to the breakout point.
✅ Confluence = High Probability: Both fib extension and measured move target the same zone, increasing confidence.
✅ Momentum + Meme Rotation: If broader meme coin rotation continues, WIF has narrative + volatility fuel.
WIFUSD trade ideas
Dogwifpump?while all other high volume coins appear to have more downside coming in the next hours, dogwif is surprisingly very close flipping bullish for a small little push by the morning. This is very dependent on the next two hourly closes. we close strong, and the dog will see a small little pump. if the next two hourly candles move sideways our close lower, this is definitely seeing some lower prices

Is the hat back on?Bullish scenerio for BINANCE:WIFUSDT
Recently we can see:
1. Bouncing off GP (0.5)
2. Retested local TL
3. Retested local support (S/R)
4. Broke 50 RSI
Reaching 1.37 resistance would print a cup and handle pattern…

WIFUSD - dogwifhat Crypto Analysis$WIF.X $1.18 PT over the course of the next month if we can break that higher level of resistance. Entry at $0.93 with a $0.85 Stop Loss on the 3:1 RRR. IF we hold that long at least... Will position a shorter stop to be conservative so If we lose momentum, we would look for re-entry at the smaller compression zone which also rest at the $0.85 Price Levels. #WIF #MyMIWallet #TradeAnalysis

WIF back to $3Complete look at Dog WIF Hat
We had some pretty nice technical setups on this meme.
#HVF
#DoubleTop
#InverseHeadandShoulders
#BullFlag
Currently it has two active patterns ...

Update on $WIF price actionSEED_WANDERIN_JIMZIP900:WIF has been a disaster since the Sphere top signal, but recently it formed a bottom pattern alongside other liquid memes, listed at futures platforms like Hyperliquid.
I trade these memes actively myself and have caught the up trend since the daily bottomed.
Now a larger weekly signal can trigger, I think it's interesting as a leading indicator for risk appetite in broad crypto, as these #memecoin and #AI tokens have shown reliable patterns with profitable swings for those adept at trading them.
Keep an eye on memes next week, the recent daily chart weakness I observed after the signal I talked about in my last post* ran out of time can be reversed easily (already signaled in 4h charts in most coins).
*I had pinpointed the last daily up trend in it, which led to a nice rally into the upper Bollinger Band before triggering a down trend signal after time for the signal expired.
Best of luck!
Cheers,
Ivan Labrie.

DOGWIFHAT LONG SETUP ALL trading ideas have entry point + stop loss + take profit + Risk level.
hello Traders, here is the full analysis for this pair, let me know in the comment section below if you have any questions, the entry will be taken only if all rules of the strategies will be satisfied. I suggest you keep this pair on your watchlist and see if the rules of your strategy are satisfied. Please also refer to the Important Risk Notice linked below.
Disclaimer

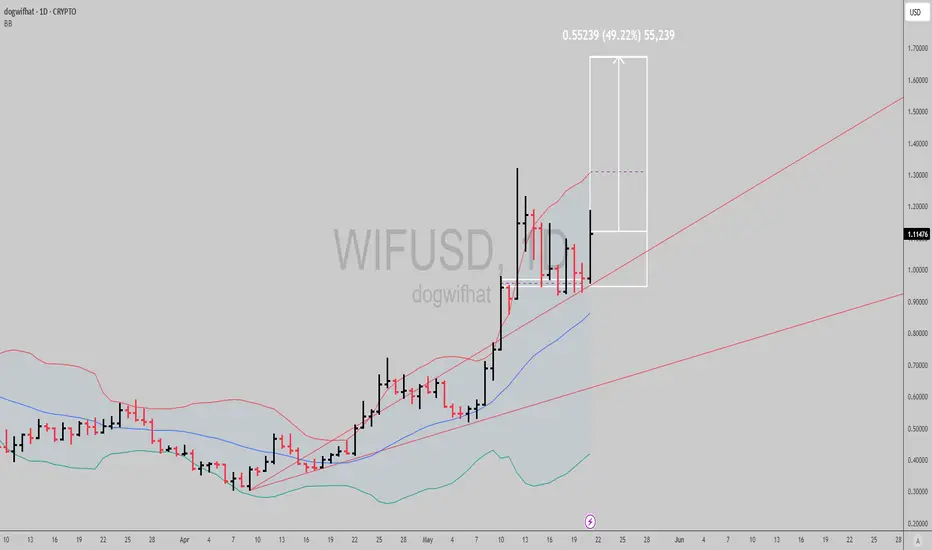
$WIF: Uptrend signal activeNice signal in SEED_WANDERIN_JIMZIP900:WIF here, the trend in the daily timeframe has been bullish since April 18th, and has been giving us multiple continuation signals to trade in and out, or scale in with low risk as we move the stop higher if playing it longer term.
If prices hold above recent lows, we can see a close to 50% run from here within a week give or take.
Best of luck!
Cheers,
Ivan Labrie.
Possible 5th Elliott wave, followed by a correction.If the assumption holds, support at the 0.5 to 0.6 Fibonacci level can be a good indicator of the continuation of the uptrend. However, this is contingent on a global bullish narrative.

WIF bouce?WIF
On the techincal side, WIF held the 1.4-1.6 range, taking in consideration the elliot wave count (C), final.
RSI showing strength, BO already.
High probability play to the 0.618 or IMB lvl 2.10 +-.
NFA

WIF/usdtSame setup as most memes. RSI structure is ready. Got bullish divergence. Price came back down to mitigate most to all imbalances. I am DCA in here....

WIF - DEEP Positional EntryWIF #108
Meme coins have been decimated since November and dogwifhat was recently down a whopping 92% since November high.
This coin was a pump chaser favourite this time last year and if it pumps again then it could yield significant multipliers from down here.
It recently had a small bounce from the 1:1.618 Golden Window extension.
This extension is often but not always a significant ratio band.
For example it was a similar distributive extension that captured the TOTAL low for this cycle:
But this is still quite dangerous here because the downtrend is unbroken and we're only seeing the early signs of crypto potentially warming up.
In addition stock indexes look very dangerous and if they dump then a dog coin like this will go tumbling down.
But I think the signs are that crypto really is coming out of a high time frame correction...
So an ideal positional buy may be possible here.
And I may add more if we continue to see positive signs in crypto.
I dont like to hold too much meme coins but I think it can be good to own some because they can pump very hard when the time is right.
I bought some here ✨.
Not advice

WIF is ready for a comeback!!! $10 in 2025A long now in BINANCE:WIFUSDT.P with stop loss at the lows and with the idea that it will claim the key value of $0.55 in the next few days.
Next important level 0.8, then if it reclaims 1.5 we are on our way to new highs.
Massive RR
-If it makes new lows we probably have to wait for another capitulation that could take us to 0.17 or lower.

WIF/USD * Daily TF EWP TC FIB AnalysisAnalysis of WIF/USD Chart Using Elliott Wave Theory
1. Elliott Wave Count & Structure:
The chart follows a clear Elliott Wave multi zigzag structure.
The impulse wave peaked at around $4.86, marking a significant high.
The correction followed in a three-wave ABC structure, which seems to have found support at a key Fibonacci level (0.618 - 0.65 retracement).
2. Trend Channel & Key Support Levels:
A parallel trend channel is visible, where price has bounced off the lower boundary, indicating strong support. Key support zone around 55¢, which aligns with the lower boundary of the trend channel.
3. Potential Price Targets & Future Projections:
The bullish scenario suggests a Wave Y target above $30 (potentially $36).
The large green box in the upper right suggests a potential high-reward zone, likely driven by a new impulse wave (Wave Y).
4. RSI Indicator & Momentum Shift:
RSI was previously oversold but is now turning upwards, indicating potential momentum recovery. A break above the 50 RSI level would confirm bullish continuation.
According to cryptonews.com : The biggest meme coin sensation in 2024!
Be careful with meme coins
So let you guide by BTC and VIX if you want to invest in this coin.

WIF update#WIF made a drop like other coins but this coin is underrated ! i think it can make a huge rise when the price crosses the confirmation line as we have 5 elliot waves down

WIF LONG TERM ANALYSIS !#WIF can make a good profit as this coin reached the price it had at the begining of the 2024 i think that this rising can go on and reach the flip line check out my analysis on this coin in lower time frames

2 scenarios on WIF#WIF can make 2 scenrios in next weeks
the first one is rising from here as the liq in lower prices is taken
the second scenario is going even deeper to the last demand zone
this demand zone can force the market rise but reaching there need a super bearish spike !

WIFUSD targeting $3.00 on this Channel Down bottom signal.Dogwifhat (WIFUSD) has been trading within a Channel Down pattern on the 1W time-frame, which on the greater scale looks like a giant Bull Flag. Regardless of that, the price almost hit the pattern's bottom (Lower Low trend-line) and with the 1W RSI stabilizing like on the August 05 2024 Low, we should now see that start of its technical Bullish Leg.
The previous Bullish Leg reached marginally above the 0.786 Fibonacci retracement level, so our current Target is $3.000.
-------------------------------------------------------------------------------
** Please LIKE 👍, FOLLOW ✅, SHARE 🙌 and COMMENT ✍ if you enjoy this idea! Also share your ideas and charts in the comments section below! This is best way to keep it relevant, support us, keep the content here free and allow the idea to reach as many people as possible. **
-------------------------------------------------------------------------------
💸💸💸💸💸💸
👇 👇 👇 👇 👇 👇

WIF - Post Inauguration Chart Wif on the weekly is forming a bottoming pattern. After our double top right below $5 we have completed our measured move to the downside and price is now testing our weekly support level.
Our weekly support level has showed very strong support in the past and is continuing to show buying pressure at this level.
Price also formed a reversal doji last week and this week could be forming a wick off bottom. This is one of my favorite patterns to trade when we form a doji and follow it with a wick off bottom to sweep the lows for liquidity.
If we see a massive weekly reversal here the first major level to watch would be around the $3.10 level (0.618) followed by of course the double to level right below $5.

higher low and time to goCRYPTOCAP_OLD:WIF looks amazing here
people are capitulating and chasing everything else under the sun
extreme value here
love the r/r long term.
hat stays on

WIFUSD: Oversold setup with Bullish DivergenceWIFUSD is shaping up for a bullish reversal! Here's what I’m seeing:
1️⃣ RSI is below 30, indicating oversold conditions.
2️⃣ Stoch RSI (SRSI) is below 20, further confirming oversold territory.
3️⃣ RSI Bullish Divergence suggests momentum is shifting upward.
4️⃣ SRSI Hidden Bullish Divergence adds strength to the setup.
Price is sitting on major support around $1.37, making this a key level to watch. If the market respects this level, we could see a strong bounce from here. My short-term target is , while I’d place a stop-loss below support at $1.30 to manage risk.
What do you think? Will WIFUSD bounce here? Let me know in the comments! 📊💬

$wif will be a major winner deep into 2025wintermute is the most cruel marketmaker of all time.
im deep into the solana ecosystem with a report.
they're all capitulating.
couldnt be me.
amazing zone to bid here. if it slides lower, im grabbing more in the blue box.
10-12$ within a few months.

WIF dogwifhat EW Count looks clearHey hey
EW count looks pretty clear for me here
Expect one more wave down and global reversal
Do not forget to follow me on X
