WINUSDT trade ideas

LETS GO BOYSUpdate on my last chart because I have no idea how to embed charts in new updates. Please someone tell me I would like to know!


WINUSDT Bull Flag WINKS ? 😉😉WIN is the symbol for Winks token . A utility token for winks or blink, an entertainment platform . On the Binance Smart chain.
Utility tokens are quite a thing for me. They don't get stuck moving.
It did an impressive run last 48 hours. Then a correction kicked-in. A good support held it at $0.00053
Formed nice trendline , which may lead to bullish reversal spike . Golden cross ahead on 9EMA
Watch out for a daily candle close above the trendline to confirm another bull run.
Several support levels are below just incase the upper support failed to hold and Bears have control. But this is unlikely.
I am bullish on WIN at the moment. Another ATH target set around 0.00075
I have an entry at 0.00052
Follow 🚶
Like 👍
Share your thoughts !

WINUSDT Great Opportunity For LongRetracement on wink is completed I'm seeing wink now at:
TP 1 0.004
TP 2 0.006
TP 3 0.008
Stop loss 0.00098
Note: This is long position it might take time to reach at 0.008 but in my technical and fundamental analysis i believe we'll see very soon.
This is not a financial advice so before take entry do your own research also.
Good luck.


wink/Tether 4/15/2021 Wink correction is nearing completion and we will soon see the exit from the corner of the triangle

WINUSDT BULLISH SIGNS?many indicators giving good bullish signs are we close to a pump i think so yes LOOKING at the 20 MA line is READY FOR A BULLISH X . give you thoughts in the comments aswell thanks

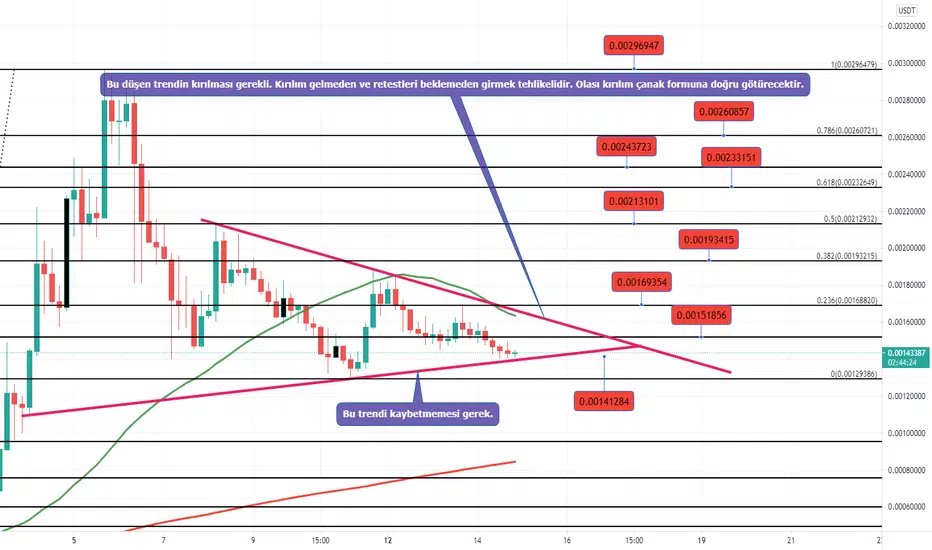
$WIN must bounce here, or else!Support levels are a bit wacky on this coin. But now we're at a bounce or die level right now.
The next level of support in the form of the 2H 200 EMA is at the 0.00136 level. Tread with caution here guys.


acting for another Zigzag or starting wave 3acting for another Zigzag (Double) or it fails to starting wave 3.

Win return to 220...Win have bad week and tomorrow is the end of this bad week..
buy wik on 140 and hold it


Feelin good about WIN here after a lot of teasingWIN has been teasing breaking this important wedge line from its ATH for over a day now, not quite sure what to do, seemed each strong breach was beaten back by bears. I have been watching the ticker a lot because I run some bots on it. Those circled areas are places where GIANT limit orders were placed and gobbled up before a large market order shoved it back up. Seems like just a lot of accumulation by whales in anticipation of a big move or maybe they are creating it. There is a lot of pent up energy in this ticker and my guess is towards the upside. Will wait to see how it all plays out nervously.


WIN looks bullishWIN rebounded after falling to 0.00188, then went down, reversed above the last swing high (excellent signal) and started a new rise.
The resistance will be around 0.00187, which can be seen with the naked eye, as well as additionally signaled by the MRI indicator on the 4h chart.
If the resistance fails to break through quickly, a bounce to the trend line is possible. Then a bullish triangle will be formed, with the target at about 0.0024.
Plan your risks. Remember, bitcoin doesn't care about our charts.
Disclamer: I'm sharing my thoughts and not giving financial advice. All decisions are your own and you are responsible for them.
Have a plan for the situation if something doesn't go your way.
------------------------------------------------------------------
>>> press "like" for ideas updates
>>> follow me for more ideas


WINUSDT New chartHello traders, after reviewing my previous chart, I decided to create a fresh chart as I had put too much emphasis on an indicator and not price action. I'm currently trying only a new combination of Wyckoff and Elliot counts (Fractals).
I've focused on only keeping VIX, RSI, and EMA as indicators. I still believe we are entering the 5th wave move and have already created the 1st wave and we are currently in the second wave retracement. I made the mistake of entering too early and now have to sit through the current negative cycle. This is because I didn't pay attention to price action and purchased widespread candles with high volume and didn't take time to markup the Wyckoff stages. If we are now in the second wave retracement we shouldn't go below 88.5 Fibonacci, if we do we will enter a much stepper down cycle and my count is completely wrong. I hope not! Good luck!

WinkWhen waiting for the button to be pressed you can place a buystop. But surely just a moment from now


Cup pattern might completeas I told you yesterday, I think it is going to complete cup and holder pattern in 1 hour timeframe.
the lunch is close.
not financial advise

