Worldcoin · Sudden Strong Jump · Beyond 2,400% Profits PotentialThe stage is now set. Chart and market conditions are perfect for a strong sudden jump. The type of advance that can change your life.
Good morning my fellow Cryptocurrency trader, I hope you are having a wonderful day.
Worldcoin (WLDUSDT) is still trading at bottom prices but with a perfect rever
Related pairs
WLDUSDT Approaching Breakout After Long-Term Downtrend!WLD is currently trading inside a descending channel on the 3-day chart. The price has recently shown strong bullish momentum and is approaching the upper boundary of the channel as well as a key resistance zone.
A breakout above this zone could lead to a significant bullish continuation. Volume ha

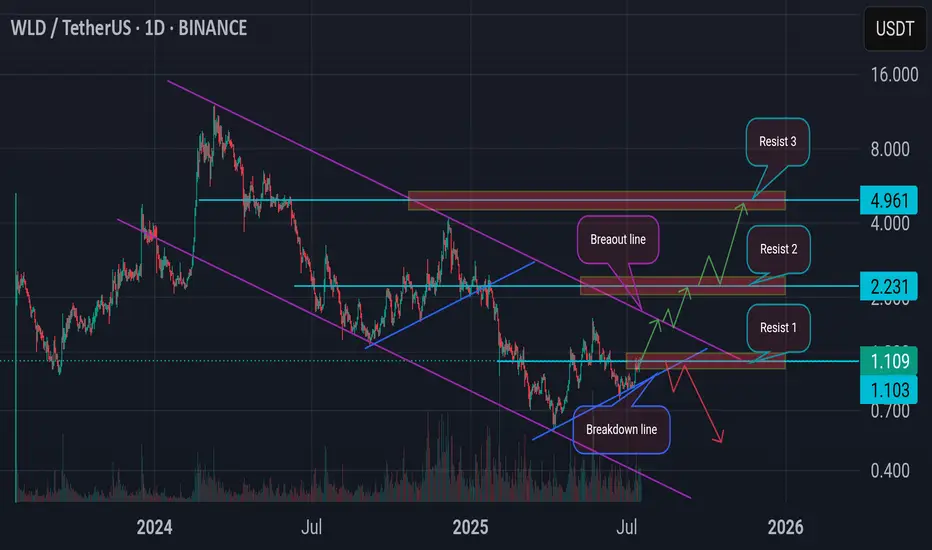
WLD Bull vs BearOutlook: On the 1D time frame, the price is still trading within a bearish channel/structure.
Bullish Scenario:
To shift momentum to the upside, the price must first break above Resistance 1 (1.103). A confirmed breakout above this level could open the way toward the breakout line. If the breakout
WLDUSDT 1D#WLD has broken above the symmetrical triangle on the daily chart. It is now facing the daily EMA200, and the RSI is in the overbought zone. A minor correction and a retest of the triangle are expected. In case of a successful retest, the targets are:
🎯 $1.596
🎯 $1.837
🎯 $2.180
🎯 $2.618
⚠️ Always

$WLD Breakout: 200% Move Ahead?MIL:WLD just broke out of a long-term triangle pattern, which could be the start of a big move.
If it stays above the $1.085 zone, we might see it climb toward $3.30, which is over 200% upside.
A clean retest would make this breakout even stronger.
DYOR, NFA

#WLD/USDT Builds Pressure Inside Long-Term Range#WLD
The price is moving within a descending channel on the 1-hour frame, adhering well to it, and is on its way to breaking it strongly upwards and retesting it.
We have a bounce from the lower boundary of the descending channel. This support is at 1.00.
We have a downtrend on the RSI indicator
#WLD/USDT Approaching Breakout After Long-Term Downtrend!#WLD
The price is moving within a descending channel on the 1-hour frame, adhering well to it, and is on its way to breaking strongly upwards and retesting it.
We have support from the lower boundary of the descending channel, at 1.200.
We have a downtrend on the RSI indicator that is about to be

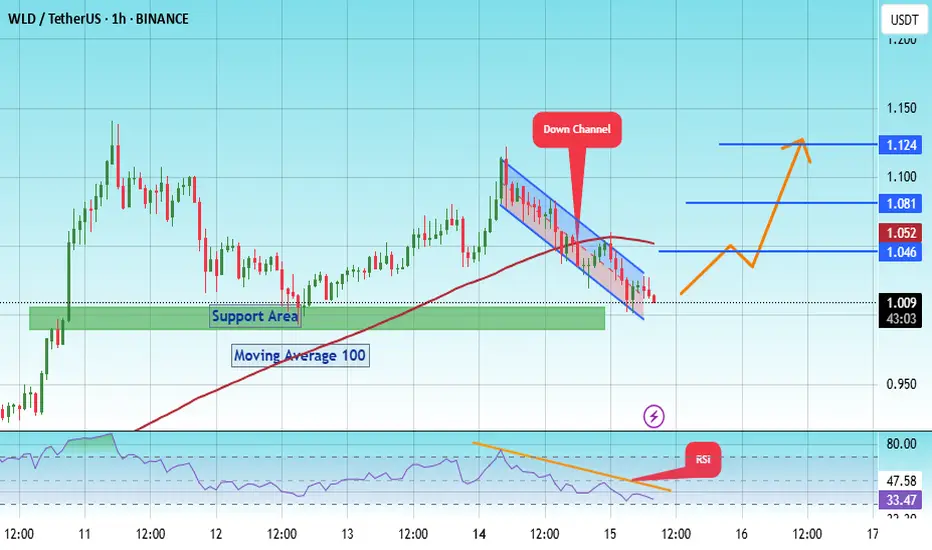
#WLD/USDT Builds Pressure Inside Long-Term Range#WLD
The price is moving within a descending channel on the 1-hour frame and is expected to break and continue upward.
We have a trend to stabilize above the 100 moving average once again.
We have a downtrend on the RSI indicator that supports the upward break.
We have a support area at the lowe

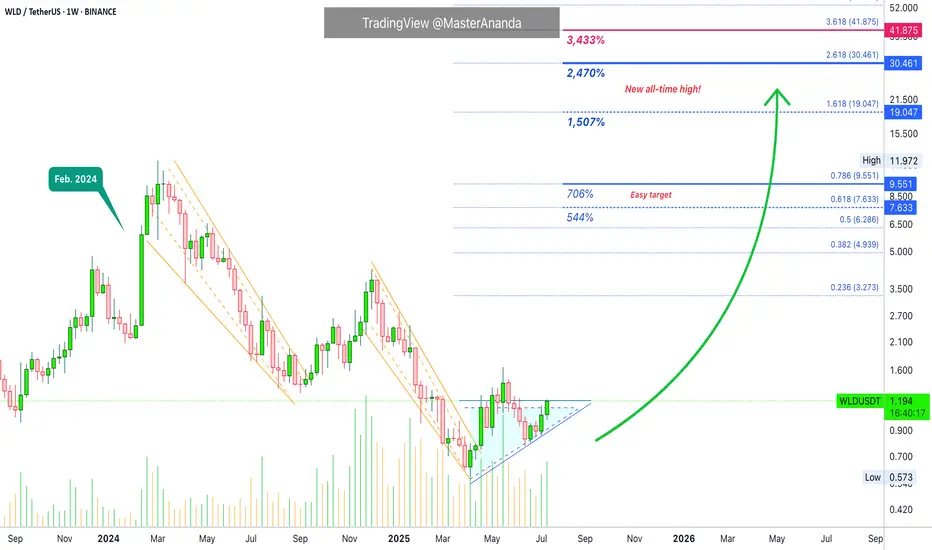
WLD with one of the biggest bullish impulseMIL:WLD next breakout setup is here, breaking all time high!✔️
Can see target of 10$ pretty easy here! Short term targets are 6$ and 8$ though! 📈

#WLD/USDT#WLD
The price is moving within a descending channel on the 1-hour frame, adhering well to it, and is heading for a strong breakout and retest.
We are experiencing a rebound from the lower boundary of the descending channel, which is support at 1.08.
We are experiencing a downtrend on the RSI ind

See all ideas
Summarizing what the indicators are suggesting.
Oscillators
Neutral
SellBuy
Strong sellStrong buy
Strong sellSellNeutralBuyStrong buy
Oscillators
Neutral
SellBuy
Strong sellStrong buy
Strong sellSellNeutralBuyStrong buy
Summary
Neutral
SellBuy
Strong sellStrong buy
Strong sellSellNeutralBuyStrong buy
Summary
Neutral
SellBuy
Strong sellStrong buy
Strong sellSellNeutralBuyStrong buy
Summary
Neutral
SellBuy
Strong sellStrong buy
Strong sellSellNeutralBuyStrong buy
Moving Averages
Neutral
SellBuy
Strong sellStrong buy
Strong sellSellNeutralBuyStrong buy
Moving Averages
Neutral
SellBuy
Strong sellStrong buy
Strong sellSellNeutralBuyStrong buy
Displays a symbol's price movements over previous years to identify recurring trends.
Frequently Asked Questions
The current price of WORLDCOIN / TETHER (WLD) is 1.1700 USDT — it has fallen −0.47% in the past 24 hours. Try placing this info into the context by checking out what coins are also gaining and losing at the moment and seeing WLD price chart.
WORLDCOIN / TETHER price has risen by 5.67% over the last week, its month performance shows a 26.53% increase, and as for the last year, WORLDCOIN / TETHER has decreased by −46.26%. See more dynamics on WLD price chart.
Keep track of coins' changes with our Crypto Coins Heatmap.
Keep track of coins' changes with our Crypto Coins Heatmap.
WORLDCOIN / TETHER (WLD) reached its highest price on Mar 10, 2024 — it amounted to 11.9471 USDT. Find more insights on the WLD price chart.
See the list of crypto gainers and choose what best fits your strategy.
See the list of crypto gainers and choose what best fits your strategy.
WORLDCOIN / TETHER (WLD) reached the lowest price of 0.5730 USDT on Apr 7, 2025. View more WORLDCOIN / TETHER dynamics on the price chart.
See the list of crypto losers to find unexpected opportunities.
See the list of crypto losers to find unexpected opportunities.
The safest choice when buying WLD is to go to a well-known crypto exchange. Some of the popular names are Binance, Coinbase, Kraken. But you'll have to find a reliable broker and create an account first. You can trade WLD right from TradingView charts — just choose a broker and connect to your account.
Crypto markets are famous for their volatility, so one should study all the available stats before adding crypto assets to their portfolio. Very often it's technical analysis that comes in handy. We prepared technical ratings for WORLDCOIN / TETHER (WLD): today its technical analysis shows the buy signal, and according to the 1 week rating WLD shows the neutral signal. And you'd better dig deeper and study 1 month rating too — it's sell. Find inspiration in WORLDCOIN / TETHER trading ideas and keep track of what's moving crypto markets with our crypto news feed.
WORLDCOIN / TETHER (WLD) is just as reliable as any other crypto asset — this corner of the world market is highly volatile. Today, for instance, WORLDCOIN / TETHER is estimated as 12.24% volatile. The only thing it means is that you must prepare and examine all available information before making a decision. And if you're not sure about WORLDCOIN / TETHER, you can find more inspiration in our curated watchlists.
You can discuss WORLDCOIN / TETHER (WLD) with other users in our public chats, Minds or in the comments to Ideas.