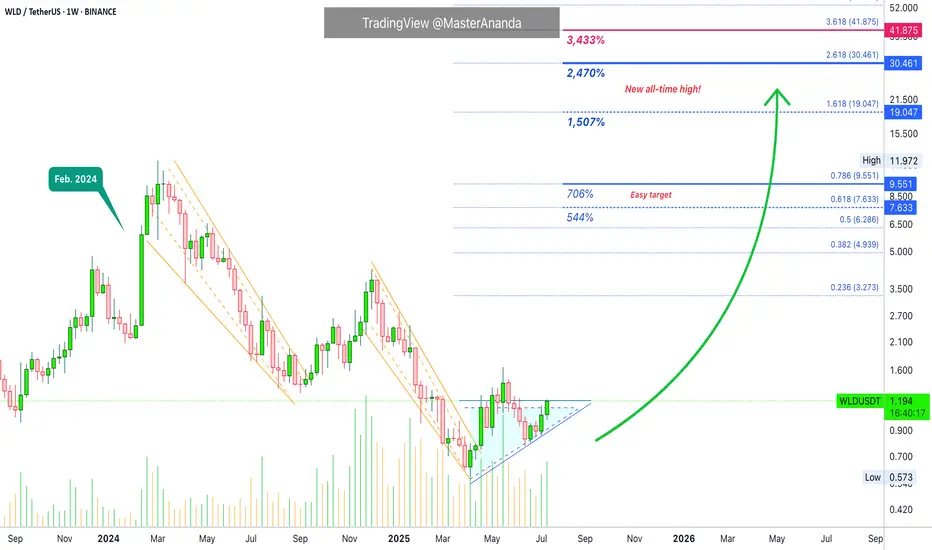
Worldcoin · Sudden Strong Jump · Beyond 2,400% Profits PotentialThe stage is now set. Chart and market conditions are perfect for a strong sudden jump. The type of advance that can change your life.
Good morning my fellow Cryptocurrency trader, I hope you are having a wonderful day.
Worldcoin (WLDUSDT) is still trading at bottom prices but with a perfect reversal pattern complete. The action is moving weekly above EMA8/13/21 and this week is closing green. This type of chart signal predicts astonishing growth. Wait is not necessary anymore.
This growth is already happening because we have two full green candles but this isn't it. The last two candles are full green but small. Things will change for the better. We will have full big green candles, something like February 2024 but instead of just one candle and then the action running dry and the start of a correction, we will have many big green candles coupled with sustained growth. It will be the best you've experienced since joining Crypto. Your profits will go through the roof; your capital will continue to appreciate; everything grows.
Volume is starting to rise as well but still relatively low. We have low volume because it is still early. The thing about "early" is that everything changes in a day. A sudden price jump. So today we are seeing prices below $1.20, in a matter of days WLD can be trading at $3 and then higher. Once the bullish breakout happens there is no going back.
We have an easy target first around 500-700% profits potential. The main stop opens up 1,500% and then we have more. Another strong target opens up 2,470% and this should be achievable in the coming months. I plotted just one more target just in case the speculative wave does what it tends to do best, surprise us all.
Just as a bear market can produce new all-time lows, a bull market can produce new all-time highs. Mark my words. Crypto is going up. Bitcoin is going up. Worldcoin is going up. The entire market is about to have the best yet period of growth.
If you are reading this now, you have great timing. Market conditions will be so much different in just two months. What seems normal today, and abnormal today, will be the norm. When it was a strange happening to see a 700% bullish wave, you will be seeing +1,000% across the entire market and many projects doing many times that long-term. It is hard to explain, but it is going to happen —Guaranteed.
The altcoins market is set to grow long-term.
Namaste.
WLDUSDT trade ideas
LONG $WLD MIL:WLD
Price pulled back from the $1.40 resistance and is now reacting to a key demand zone. This area also aligns with the 0.5–0.618 Fib retracement level, where buyers have stepped in previously.
If this support holds, we could see a bounce toward the next major resistance.
Entry Zone: Around $1.08–$1.12
Stop Loss: Below $1.00
Targets:
Target 1: $1.16
Target 2: $1.25
Target 3: $1.33
Target 4: $1.40
Leverage 5X
DYOR, NFA
#TradeSetup #Altseason

WLDUSDT Approaching Breakout After Long-Term Downtrend!WLD is currently trading inside a descending channel on the 3-day chart. The price has recently shown strong bullish momentum and is approaching the upper boundary of the channel as well as a key resistance zone.
A breakout above this zone could lead to a significant bullish continuation. Volume has started to pick up, indicating increasing interest. If the price manages to flip the resistance into support, we could potentially see a rally towards the $5.00 - $10.00 zone.

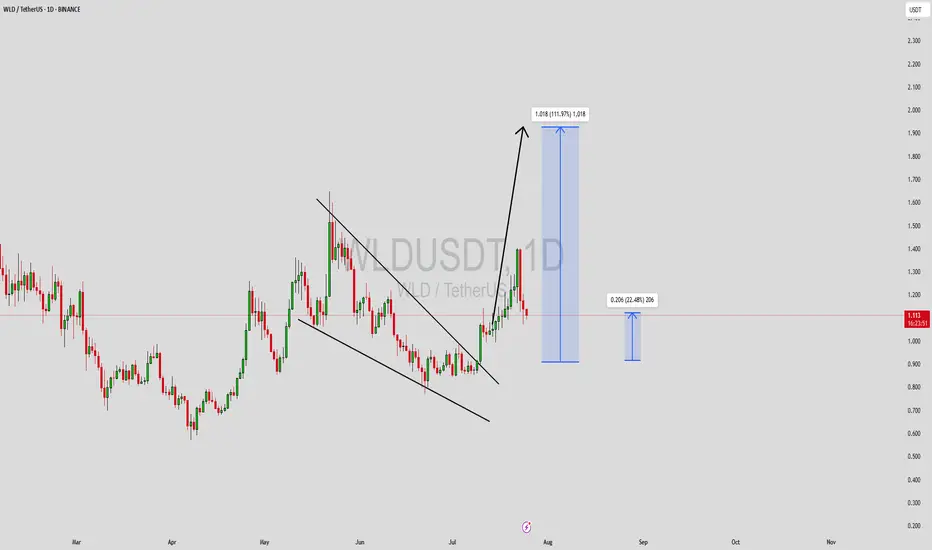
WLDUSDT 1D#WLD has broken above the symmetrical triangle on the daily chart. It is now facing the daily EMA200, and the RSI is in the overbought zone. A minor correction and a retest of the triangle are expected. In case of a successful retest, the targets are:
🎯 $1.596
🎯 $1.837
🎯 $2.180
🎯 $2.618
⚠️ Always use a tight stop-loss and practice proper risk management.

$WLD Breakout: 200% Move Ahead?MIL:WLD just broke out of a long-term triangle pattern, which could be the start of a big move.
If it stays above the $1.085 zone, we might see it climb toward $3.30, which is over 200% upside.
A clean retest would make this breakout even stronger.
DYOR, NFA

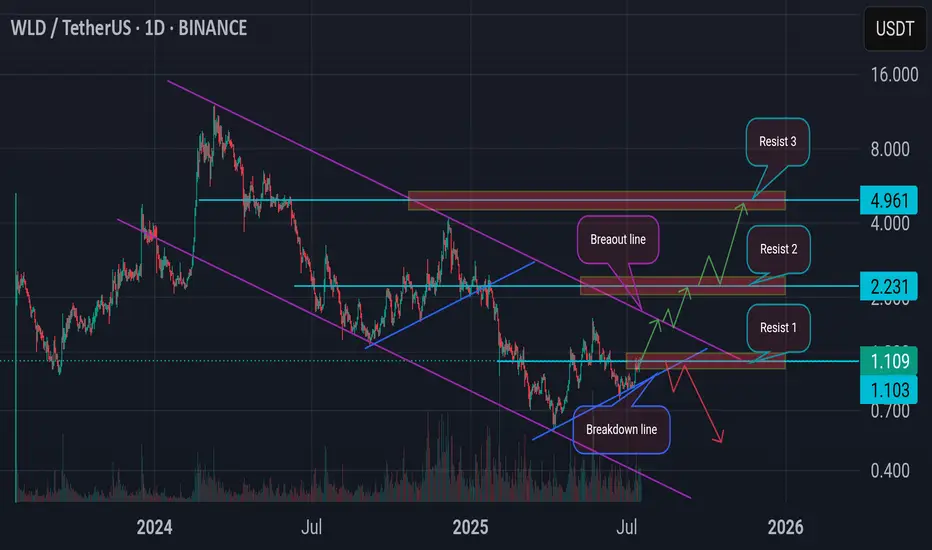
WLD Bull vs BearOutlook: On the 1D time frame, the price is still trading within a bearish channel/structure.
Bullish Scenario:
To shift momentum to the upside, the price must first break above Resistance 1 (1.103). A confirmed breakout above this level could open the way toward the breakout line. If the breakout line is cleared with strong volume, the next target is Resistance 2 (2.231). A sustained move above Resistance 2 could pave the way for a rally toward Resistance 3 (4.961).
Bearish Scenario:
If the price fails to break above Resistance 1 and falls below the breakdown line, it could trigger further downside continuation, confirming bearish pressure.
#WLD/USDT Approaching Breakout After Long-Term Downtrend!#WLD
The price is moving within a descending channel on the 1-hour frame, adhering well to it, and is on its way to breaking strongly upwards and retesting it.
We have support from the lower boundary of the descending channel, at 1.200.
We have a downtrend on the RSI indicator that is about to be broken and retested, supporting the upside.
There is a major support area in green at 1.170, which represents a strong basis for the upside.
Don't forget a simple thing: ease and capital.
When you reach the first target, save some money and then change your stop-loss order to an entry order.
For inquiries, please leave a comment.
We have a trend to hold above the 100 Moving Average.
Entry price: 1.250.
First target: 1.288.
Second target: 1.321.
Third target: 1.373.
Don't forget a simple thing: ease and capital.
When you reach your first target, save some money and then change your stop-loss order to an entry order.
For inquiries, please leave a comment.
Thank you.

#WLD/USDT Builds Pressure Inside Long-Term Range#WLD
The price is moving within a descending channel on the 1-hour frame, adhering well to it, and is on its way to breaking it strongly upwards and retesting it.
We have a bounce from the lower boundary of the descending channel. This support is at 1.00.
We have a downtrend on the RSI indicator that is about to break and retest, supporting the upside.
There is a major support area in green at 0.990, which represents a strong basis for the upside.
Don't forget a simple thing: ease and capital.
When you reach the first target, save some money and then change your stop-loss order to an entry order.
For inquiries, please leave a comment.
We have a trend to hold above the 100 Moving Average.
Entry price: 1.01
First target: 1.04
Second target: 1.08
Third target: 1.12
Don't forget a simple thing: ease and capital.
When you reach the first target, save some money and then change your stop-loss order to an entry order.
For inquiries, please leave a comment.
Thank you.
#WLD/USDT Builds Pressure Inside Long-Term Range#WLD
The price is moving within a descending channel on the 1-hour frame and is expected to break and continue upward.
We have a trend to stabilize above the 100 moving average once again.
We have a downtrend on the RSI indicator that supports the upward break.
We have a support area at the lower boundary of the channel at 0.992, acting as strong support from which the price can rebound.
We have a major support area in green that pushed the price upward at 0.930.
Entry price: 1.00
First target: 1.036
Second target: 1.073
Third target: 1.111
To manage risk, don't forget stop loss and capital management.
When you reach the first target, save some profits and then change your stop order to an entry order.
For inquiries, please comment.
Thank you.

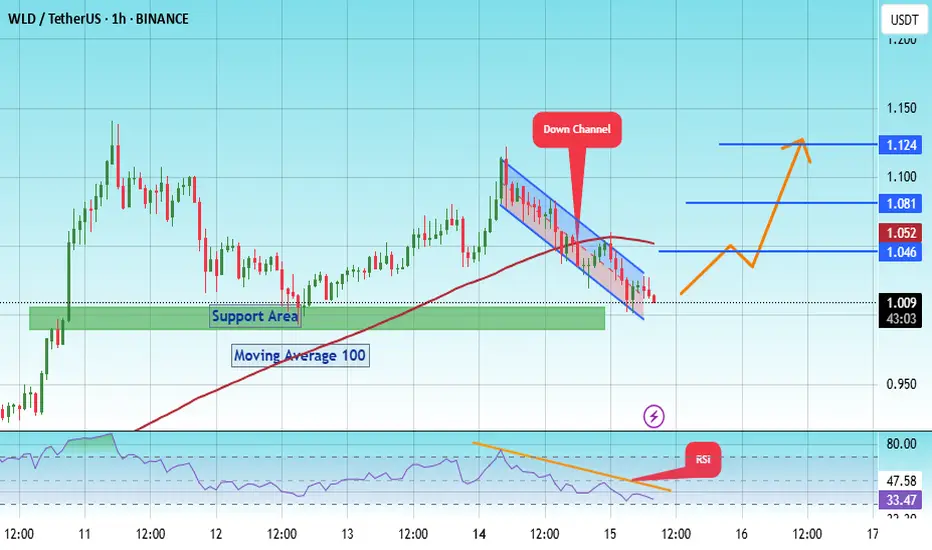
#WLD/USDT#WLD
The price is moving within a descending channel on the 1-hour frame, adhering well to it, and is heading for a strong breakout and retest.
We are experiencing a rebound from the lower boundary of the descending channel, which is support at 1.08.
We are experiencing a downtrend on the RSI indicator, which is about to break and retest, supporting the upward trend.
We are looking for stability above the 100 moving average.
Entry price: 1.143
First target: 1.190
Second target: 1.236
Third target: 1.300

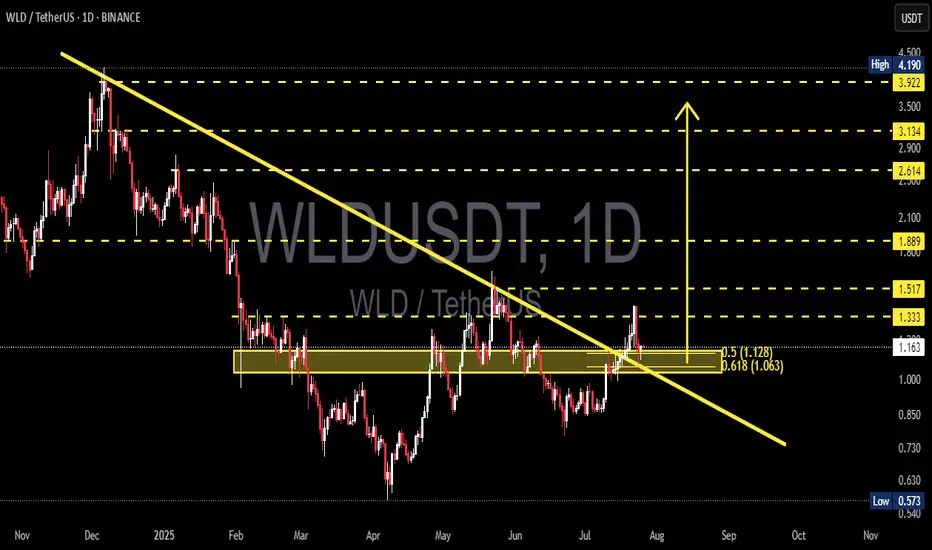
WLDUSDT at a Critical Level: Valid Breakout or Just a Fakeout?WLDUSDT is catching traders' attention after successfully breaking above a long-term descending trendline that has capped price since late 2024. But the big question now is — is this the start of a real trend reversal, or just a classic bull trap fakeout?
---
📌 Detailed Technical Breakdown
🟡 1. Major Trendline Breakout
The yellow trendline drawn from November 2024 has finally been broken to the upside.
This is a potential signal that bearish momentum is weakening significantly.
🟨 2. Key Demand Zone (Horizontal Yellow Box)
The area between 1.063 – 1.128 USDT has acted as a strong demand/support zone since March 2025.
Price is currently retesting this zone, which makes it a decisive level for validating the breakout.
🔁 3. Fibonacci Retracement Levels
Price is retesting the 0.5 (1.128) and 0.618 (1.063) retracement levels.
These fib levels could serve as a launchpad for a bullish continuation if held.
🧱 4. Layered Resistance Structure
If the bounce holds, WLD could target:
🔹 1.333 – Psychological resistance
🔹 1.517 – Previous structural resistance
🔹 1.889 – Key horizontal level
🔹 2.614 – 3.922 – Medium-term targets based on historical structure and fib extension
---
🟢 Bullish Scenario (Increasing Probability)
Price holds above the 1.063 – 1.128 zone and confirms a rebound.
A daily close above 1.333 would further confirm bullish continuation.
Formation of higher highs and higher lows would validate trend reversal.
🔴 Bearish Scenario (If Breakdown Occurs)
Price loses support at 1.063, invalidating the breakout and retest.
Possible targets to the downside:
Minor support: 0.85 – 0.75
Major support: 0.573 (Previous macro low)
---
📈 Interesting Chart Pattern
Potential formation of an Inverse Head and Shoulders, with the neckline around 1.333.
A confirmed breakout above the neckline could trigger a strong bullish impulse.
---
🎯 Conclusion
WLD is now in a golden zone that will decide its medium-to-long-term trend.
The 1.063 – 1.128 area is make-or-break. If bulls defend this zone, it confirms trend reversal. If it fails, WLD could slide back into a distribution range.
📌 Traders who wait for confirmation at this stage may have the strategic edge.
#WLDUSDT #WLDAnalysis #CryptoBreakout #TrendlineBreak #TechnicalAnalysis #InverseHeadAndShoulders #FibonacciSupport #AltcoinSetup #CryptoTrading #CryptoUpdate
WLDUSDT Forming Falling WedgeWLDUSDT is currently forming a falling wedge pattern, a bullish technical setup known for signaling a potential trend reversal. The narrowing price action within this wedge suggests that sellers are losing strength, while buyers are gradually gaining control. This setup is particularly promising when supported by a rise in volume, and in WLDUSDT’s case, the trading volume has been steadily increasing—an early confirmation of growing investor interest.
Worldcoin (WLD) has attracted major attention due to its unique identity-based ecosystem and backing by high-profile figures in the tech world. The project has recently seen renewed momentum as discussions around digital identity, privacy, and AI integration continue to heat up. The falling wedge pattern, combined with good volume and fundamental strength, increases the probability of an upside breakout. Technical projections point toward a conservative gain of 19% to 20%, making it a suitable target for short- to mid-term traders looking for solid risk-reward setups.
From a technical analysis standpoint, key resistance levels lie near the upper boundary of the wedge, and a breakout with volume confirmation could push prices swiftly toward those targets. Momentum indicators such as RSI and MACD are also showing signs of bullish divergence, hinting at a potential reversal. This setup becomes more favorable in the context of WLD's fundamental narrative and broader market sentiment.
WLD’s long-term vision and growing adoption potential position it as more than just a short-term play. While the immediate gain may be moderate compared to more speculative altcoins, its low-risk technical setup and increasing demand make it an appealing choice for both new and experienced crypto traders.
✅ Show your support by hitting the like button and
✅ Leaving a comment below! (What is You opinion about this Coin)
Your feedback and engagement keep me inspired to share more insightful market analysis with you!
wld update🚨 WLD/USDT – 4H Technical Analysis 🚨
WLD is currently trading within a well-defined ascending channel 📈. After touching the upper boundary, the price sharply dropped by over 11%, signaling a strong rejection from resistance. 🔻
🔍 Key Insights:
🔹 Support Levels:
🟦 $1.000 – major psychological and technical support
🟦 $0.883 – previous breakout zone
🔹 Resistance:
🔺 $1.30–$1.32 zone acted as strong resistance recently
🔹 RSI (14):
📉 Dropping below 50, showing bearish momentum
⚠️ Bearish crossover with its moving average
🔹 Volume:
📊 Big red candle with strong volume = heavy selling pressure
🔹 BBTrend:
📉 Bullish momentum is fading
⸻
📌 What to Watch:
If price breaks below the midline of the channel, we could see a test of the $1.00 or even $0.88 support. However, a bounce from here with volume confirmation could signal continuation toward the top of the channel 📈.
⚠️ Stay cautious – trend is bullish but clearly under pressure.
⸻
#WLD #Crypto #Altcoins #TradingView #TA #TechnicalAnalysis #USDT #CryptoTraders #PriceAction

#WLD/USDT Approaching Breakout After Long-Term Downtrend!#WLD
The price is moving within a descending channel on the 1-hour frame, adhering well to it, and is on its way to breaking strongly upwards and retesting it.
We have support from the lower boundary of the descending channel, this support is at 1.28.
We have a downtrend on the RSI indicator that is about to be broken and retested, supporting the upside.
There is a major support area in green at 1.26, which represents a strong basis for the upside.
Don't forget a simple thing: ease and capital.
When you reach the first target, save some money and then change your stop-loss order to an entry order.
For inquiries, please leave a comment.
We have a trend to hold above the 100 Moving Average.
Entry price: 1.30
First target: 1.34
Second target: 1.38
Third target: 1.43
Don't forget a simple thing: ease and capital.
When you reach your first target, save some money and then change your stop-loss order to an entry order.
For inquiries, please leave a comment.
Thank you.

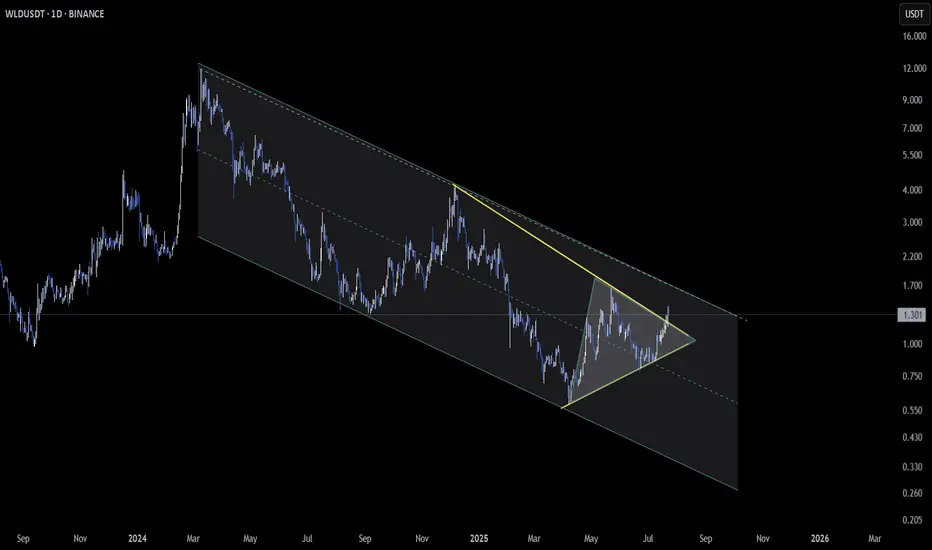
WLD – Symmetrical Breakout Meets Daily Channel ResistanceMIL:WLD is showing a fascinating dual-structure setup across timeframes — a classic case of momentum building from the lower timeframe into higher-timeframe resistance 📊
🔹 4H Chart: A clear breakout from a symmetrical triangle, signaling potential bullish momentum. If this breakout sustains with volume, short-term upside may follow.
🔸 Daily Chart: Price is still confined within a descending channel. This structure has been respected, and unless it’s broken, the broader trend remains capped.
👀 A potential scenario:
If the 4H breakout holds and the daily descending channel breaks, it could trigger a strong leg upward.
But if price gets rejected at the upper boundary of the daily channel, we may see a fade back into consolidation.
📌 Watch for volume confirmation and reaction near the daily resistance zone. A multi-timeframe breakout could bring explosive momentum.
Stay sharp and manage risk accordingly.
Worldcoin: The 2025 Cryptocurrency Bull Market (PP: 1,627%)Worldcoin's bullish bias is now confirmed. Back in October 2023 WLDUSDT broke above EMA55/89 daily and this signaled the start of a major bullish cycle. After moving below briefly in January 2024, the recovery above these levels in February marked the start of a major bull-run.
More than a year later, after hitting a major all-time low in April 2025, Worldcoin is once more trading above EMA55 & EMA89 on the daily timeframe. This guarantees and fully confirms the start of a major bullish cycle and wave leading to a bull run and new all-time high. The all-time high can happen late 2025 just as it can happen in early 2026. The path is green.
The future is bright for the altcoins market, for Bitcoin and this project. Many altcoins are looking great right now and producing the strongest growth we've seen in years. The best news? This is only the start, truly. We are set to experience much more of what is happening now.
The last bullish wave, late 2024, was short-lived, it only lasted one month. The small bullish reaction in early April was also short-lived lasting a little over than a month. This time it is so much different, we are set to enjoy continued growth for 3-6 months straight. This is the first time since late 2023 that the market will grow this long. Before late 2023/early 2024, the last period of sustained growth happened within the 2021 bull market.
We are about to experience the strongest cycle since the last bull market... Get ready.
Be prepared by planning ahead. The market will give you as much as you can take.
Thank you for reading.
Namaste.

#WLD/USDT , How Long Will It Take For A $ 1.14 Target?#WLD
The price is moving within a descending channel on the 15-minute frame and is expected to break and continue upward.
We have a trend to stabilize above the 100 Moving Average once again.
We have a downtrend on the RSI indicator that supports the upward break.
We have a support area at the lower boundary of the channel at 1.06, acting as strong support from which the price can rebound.
We have a major support area in green that pushed the price higher at 1.05.
Entry price: 1.08
First target: 1.09
Second target: 1.117
Third target: 1.14
To manage risk, don't forget stop loss and capital management.
When you reach the first target, save some profits and then change the stop order to an entry order.
For inquiries, please comment.
Thank you.

#WLD/USDT#WLD
The price is moving within a descending channel on the 1-hour frame, adhering well to it, and is heading towards a strong breakout and retest.
We are experiencing a rebound from the lower boundary of the descending channel, which is support at 0.950.
We are experiencing a downtrend on the RSI indicator that is about to be broken and retested, supporting the upward trend.
We are looking for stability above the 100 moving average.
Entry price: 1.20
First target: 1.04
Second target: 1.07
Third target: 1.10

#WLD/USDT#WLD
The price is moving within a descending channel on the 1-hour frame and is expected to break and continue upward.
We have a trend to stabilize above the 100 moving average once again.
We have a downtrend on the RSI indicator that supports the upward move with a breakout.
We have a support area at the lower limit of the channel at 0.900, acting as strong support from which the price can rebound.
Entry price: 0.913
First target: 0.944
Second target: 0.971
Third target: 1.004

WLD with one of the biggest bullish impulseMIL:WLD next breakout setup is here, breaking all time high!✔️
Can see target of 10$ pretty easy here! Short term targets are 6$ and 8$ though! 📈

WLD | Price PredictionSam Altman has the second project about AI - BINANCE:WLDUSDT (World).
This is my top-1 investment at this moment. Those levels are from my platform.
WLD is not a regular asset because its tokenomics is hard to understand. People do not really understand it. One part of them think it is just printing tokens all the time, which isn't true if you're familiar with all the process. And another part doesn’t even know about WLD tokenomics.
This project has one of the most powerful tractions in the crypto. Razer and Tinder are already part of the ecosystem, and people don’t really talk about it. World is also an app store for Web3 apps with 1 BILLION total opens.
Price is just following the ETH price, as all of the ETH ecosystem tokens.

TradeCityPro | WLD Builds Pressure Inside Long-Term Range👋 Welcome to TradeCity Pro!
In this analysis, I want to review the WLD coin for you. It’s one of the Privacy and Identity coins with a market cap of $1.5 billion, ranked 55 on CoinMarketCap.
⏳ 4-Hour Timeframe
In the 4-hour timeframe, a ranging box has formed for this coin between the 0.855 and 0.969 zones, and it’s been fluctuating within this range for several weeks.
📊 Volume is gradually decreasing within this box, which could indicate that a move is approaching.
⚡️ For now, we can say the volume slightly favors buyers, as the green candles have more volume than the red ones. Additionally, the size and strength of the green candles are greater, which increases the likelihood of the box breaking upward.
📈 If the price moves up toward the 0.969 zone with increased volume, we can enter a long position upon breaking 0.969.
✔️ Alternatively, if the price is supported at the 0.855 bottom, we could also open a long position—but it’s riskier, and in my opinion, not worth it. It’s better to wait for the main trigger to activate.
🔽 For a short position, if the price forms a lower high below 0.969 and then moves toward 0.855, we can open a short if 0.855 breaks. The next support zone would be 0.795.
📝 Final Thoughts
This analysis reflects our opinions and is not financial advice.
Share your thoughts in the comments, and don’t forget to share this analysis with your friends! ❤️

WLDUSDT – Bullish Setup Unfolding!Hey Traders — if you're into high-conviction setups with real momentum, this one’s for you.
WLD is breaking out from a well-defined falling wedge pattern on the 4H chart — a classic bullish structure. Currently retesting the breakout zone while holding the green demand box like a champ. 📈
💥 Entry Zone:
$0.87 – $0.91 (accumulate inside the green box)
🎯 Targets:
• $1.08
• $1.28
• $1.45
• $1.58
🛑 Stop Loss:
$0.81 (below the wedge + demand zone)
Looks poised for a strong move. As always, use proper risk management and watch for volume confirmation.
Let’s see how this plays out — bullish structure, solid risk-reward!
