WLD | WORLDCOIN & Sam Altman 🌎What if I told you, all you need to do to get free money is to look into this Orb! would you do it?
Worldcoin wants to give everyone free crypto in exchange for scanning their eyeballs which at this time, over 2 million people have signed up
The project has garnered serious attention and has early investors such as Andreesen Horowitz, Coinbase Ventures, LinkedIn Cofounder Reid Hoffman, Solana founder Anatoly Yakovenko,
Polkadot founder Gavin Wood and even the infamous degen SBF himself!
In March 2022, a funding round brought Worldcoin’s valuation to an eye watering $3 billion.
The price of Worldcoin is $2.2 today with a 24hour trading volume of 300 million dollar but
Why are VCs pouring money into Worldcoin and why does Worldcoin want your eyeballs ?!
Tools for Humanity, the company behind Worldcoin, is co-founded by Alex Blania and Sam Altman.you might be more familiar with Sam as he is also the founder behind OpenAI, the company behind the AI chatbot ChatGPT, which took the world by storm since its release in November last year.
The wild success of ChatGPT also spawned an AI arms race between tech giants, which probably
means AI will only get more advanced from now.
The rapid advancement in AI is now worrying the public as AIs are now able to ace the SAT, create increasingly convincing deepfakes, and probably most concerningly, remove the need for humans in the workforce.
Perhaps it’s a coincidence, but Sam has a solution for the identity problem as well as for aiding people whose jobs are taken by AI…Worldcoin. In a world set to be increasingly impacted by AI, Worldcoin purportedly aims to provide individuals a way to verify ‘personhood’ as well as access to universal basic income.To achieve this, Worldcoin is attempting to create a global digital identity and financial network using blockchain technology.
Worldcoin is currently testing its smart contract on the Polygon Network but is in collaboration
with Ethereum Layer2 Optimism to build on and migrate to its network.The team has launched World App in May, a non custodial wallet which enables its users to transact with the Worldcoin token and a few other cryptos, as well as interact with dApps on the Ethereum ecosystem.
However, the key feature of World App is enabling World ID,Its is a global digital passport that allows users to prove their identity while preserving their private information through the use of cryptography and zero knowledge proofs.
World ID can help establish ‘proof of personhood’,meaning to prove that someone is a real, unique human. Proof-of-personhood could be useful to prevent the spread of misinformation by realistic AI-generated content, as well as limiting Sybil-attacks, which are basically online attacks where a single attacker assumes multiple fake identities to gain influence over a network.
As World ID gets more adoption, it’s meant to be used as a method to sign in to websites, mobile apps, and crypto dApps, perform actions such as voting in DAOs or even government elections, as well as receiving aid from NGOs and government programs.
As of now, to obtain a verified World ID,users are required to gaze into the infamous Orb.
The Orb will perform an iris scan and a machine learning algorithm within the Orb will ensure
that the eyeballs scanned are indeed real human irises and not something else, like colored contact lenses or... a cat.
Then the iris scan will be converted to a hashcode or as Worldcoin calls it, ‘IrisHash’. As soon as the code is generated, the Orb supposedly deletes any images from the scan. Within the Orb, the IrisHash is encrypted with a private key before being uploaded on-chain and cross-checked with the existing catalog of IrisHashes.
If the IrisHash does not match any records,it will be added to the catalog. When Worldcoin launches, each verified World ID owner will then be eligible to claim their one-time airdrop of MIL:WLD tokens. which worth 50$ right now
Many have asked why World ID needs iris scans for proof-of-personhood.Supposedly, it’s because the human iris has a very high degree of randomness, making it a much more effective biometric than faces or fingerprints to differentiate between billions of individuals and establish proof-of-personhood.
Unsurprisingly, Worldcoin’s decision to create a global digital identity network using iris scans has raised a lot of eyebrows, understandably so due to its uncanny similarity to what you’d
see in a Black Mirror episode.
Just as Worldcoin was introduced back in October 2021, NSA whistleblower Edward Snowden slammed the use of iris scans. Although Worldcoin has promised that the iris scans will not be saved, Snowden pointed out that the hashcodes produced by these scans are still saved and would match future scans, and that the use of zk-proofs doesn’t justify the use of biometrics for anti-fraud.
There is also pushback from the crypto community- some argued that the ability to use multiple
accounts in Web3 for privacy is a feature, not a flaw; and though most agreed that Web3 is in need of protection against sybil-attacks, it is not necessary to have 100% sybil-resistance
as long as there is a method that can prevent a large enough percentage of sybils.
Additionally, MIT Technology Review released a damning report last year against Worldcoin
on the revelations upon investigating Worldcoin’s field testing.Much of its early field testing is conducted in poorer, developing countries such as Indonesia,Sudan and Kenya where data privacy regulations are weaker and whose communities were the most financially impacted by the pandemic.
The lengthy report revealed that Orb operators were given limited information during recruitment, other than being made aware that their payment is based on the number of signups they achieve.
Operators were then employing strategies such as hosting giveaways of cash and Airpods to encourage sign-ups while providing participants little information on Worldcoin’s campaign.
On top of that, Worldcoin claimed that only an iris scan is needed for sign-ups.However, orb operators also requested email addresses and phone numbers of participants, which a Worldcoin representative denied as part of the data collection practice.
A black market for verified iris scans has even popped up in China where the Worldcoin app isn’t supposed to be available, though the Worldcoin team is attempting to contain the issue.
Furthermore, the project was found to have made contradictory claims of compliance with EU data regulations and was accused of lacking transparency in its data collection practices.
While it seems that Worldcoin is neck-deep in controversies, the project has just received
another $115 million in a series C funding round last month. Onboarding billions of people to create a global digital identity and financial network to distribute universal basic income is a tall order.
With the backlash it's getting from its field-testing and many wondering if Worldcoin is simply
a cover for mass data collection, it remains to be seen whether Worldcoin can deliver on their promises.
Unlike offshore exchanges, none of the U.S.-based cryptocurrency exchanges such as Coinbase Kraken has Worldcoin listed. Worldcoin notes that WLD tokens are not available to persons or companies residing in the United States, however World ID and TFH's World App are still available in the United States.
also the founder of the security agency Slow Mist said that if Worldcoin succeeds, it will be an evil product, but there is a high probability of failure. the iris is almost the most stable and long-lasting unique mark of human beings. The promise of the Worldcoin white paper is good, but it is still possible for hackers to paint a portrait through the hash information!
WLDUSDT trade ideas

#WLD\USDT#WLD
The price is moving in a descending channel on the 1-hour frame upwards and is expected to continue.
We have a trend to stabilize above the moving average 100 again.
We have a downtrend on the RSI indicator that supports the rise by breaking it upwards.
We have a support area at the lower limit of the channel at a price of 2.10.
Entry price 2.18.
First target 2.31.
Second target 2.48.
Third target 2.67.

WLD 12H Time FrameHello Wld looks like it gonna move in that channel
BTC Marking 62500 will go for good entry
Buying around the Green DOT
Selling as you want but main target maybe around 70-100%

WLD -pumped as we planned. Big move is COMING!WLD -pumped as we planned. Big move is COMING!
In a previous video i shared VAL as key support zone 1.8
Price did 40% from that
at this moment we need range before price will go on


bullishThe price did not fall to 2.18 pullbacks according to the previous analysis and is continuing its upward trend with the right volume, with a fractal breakout, there is the potential to grow up to 3.20

Going up to 19$ at weekly time! wow!With a simple look at the FTR formed in the weekly timeframe of Worldcoin, we can easily understand that this decline was not in vain. After forming an engulfing point and observing the fake out and SNR, it's clear that we can anticipate growth up to the Fibonacci level of 1.618, which is around $18.78, or even higher.

WLD wait for clear value to take LONG WLD wait for clear value to take LONG
in a case of a range for 1 -2 weeks at VAL we`ll take LONG
best confirmation was on SUI i shared it in a vidoe

#WLD/USDT#WLD
The price is moving in a descending channel on the 4-hour frame and is sticking to it greatly and is about to break upwards
We have a bounce from the lower limit of the channel at 1.60
We have a downtrend on the RSI indicator about to break, which supports the rise
We have a trend to stabilize above the moving average 100
Entry price 1.67
First target 1.80
Second target 1.95
Third target 2.20

pullbackBest Buy Range 2.18 with Pullback Completion
A positive reaction should also be seen in the 2.18 range

WLD IS READY FOR HUGE BULLISH WAVE.WLD has broken long term rectangular box with huge bullish wave amid bullish anticipation of BITCOIN to go all time high again. breakout and retest has already been happened so we can expect more than 100% growth in coming days.

Long WLD1. world oin partnership with rune block chain , main net launch
2.resostence broken today 2.03,
target all time high 12 dollar 3x- 6X possible bear case
bull case 6X-10X
super cycle 10X-20X
breaking long term phase 4 HH HL pattern, retest confirmation, if break current resistance with high volume we can see all time high soon in one month
phase-1 BULL done
hase -2 Bear done
Phase-3 accumulation
Phase -4 HH Hl retest conformation done
phase -5 bull cycle started now ?
let me know

WorldCoin Tech Review Technical Overview:
1. General Market Sentiment (1D Chart Analysis):
The overall market sentiment for WLD/USDT on the daily chart shows strong potential for upward movement, confirmed by both oscillators and moving averages. Here’s a breakdown:
Oscillators (1D):
The Momentum and MACD Level on the 1D chart are generating Buy signals, indicating short-term upward momentum.
Other oscillators like the RSI and Stochastic are neutral, giving space for further upward price movement before reaching overbought conditions.
Moving Averages (1D):
Most short to medium-term moving averages (EMAs and SMAs) point to a Strong Buy signal. However, the long-term moving averages (100, 200) indicate a bearish outlook, suggesting potential resistance levels at higher prices.
2. Intraday Momentum (4H Chart Analysis):
From the 4H chart provided, we see additional insights for more precise intraday movements:
Price Action:
The asset is currently testing the resistance zone near 1.99 USDT and seems poised to attempt a breakout.
A noticeable trendline has been drawn from the previous lows, and the price has respected this trendline multiple times. The trendline suggests support at 1.72 USDT. If the price retraces, this level would be a strong buying opportunity for conservative traders.
The 1.50-1.70 USDT zone is also reinforced by the volume profile, showing significant accumulation and historical buying support. A bounce from this zone would be expected if the price retraces here.
Volume Profile:
The visible range volume profile shows strong demand between 1.50 USDT and 1.72 USDT, with a breakout above 1.99 USDT possibly driving the price higher toward the 2.20-2.50 USDT range, where the next major resistance zone lies.
RSI and Momentum (4H):
The RSI on the 4H chart is trending upward but still below overbought levels, meaning there is more room for the asset to appreciate in the near term.
MACD also shows a bullish crossover, further supporting the upward momentum.
3. Key Support and Resistance Zones:
Support Levels:
1.72 USDT: A critical support level, coinciding with the trendline and previous price action. If the price retraces here, this could provide an excellent buying opportunity.
1.50-1.55 USDT: Strong demand zone with significant accumulation, marked by the volume profile. Any dip towards this area could also offer a favorable entry point.
Resistance Levels:
2.00-2.05 USDT: Immediate resistance zone that needs to be broken for further upside potential.
2.20-2.50 USDT: This is the next major resistance level, likely to be tested if the price breaks above 2.00 USDT convincingly.
Entry & Exit Strategy:
Conservative Entry:
Wait for a pullback to the trendline around 1.72 USDT and enter at this level if the price respects the trendline. This offers a low-risk, high-reward entry point.
Set a stop loss slightly below the 1.70 USDT level to avoid deeper retracements.
Aggressive Entry:
Enter the trade on a breakout above 2.00 USDT, confirming with a close above this level. Set a buy stop at 2.05 USDT to capture the breakout.
Place a stop loss below 1.90 USDT to minimize losses in case of a failed breakout.
Profit Targets:
The first target can be set around 2.20-2.25 USDT, as this will be a key resistance zone.
A second target at 2.50 USDT can be considered if the bullish momentum continues, riding the upward trend.
Risk Management:
Keep risk exposure low, especially in volatile conditions. Risk only 1-2% of your capital on the trade, with position sizing adjusted accordingly based on your stop loss distance.
Potential Scenarios and Trading Methods:
Scenario 1: Breakout Above 2.00 USDT
If the price breaks 2.00 USDT and holds above this level, expect upward momentum to continue toward 2.20-2.50 USDT. This will likely be accompanied by increasing volume, confirming the bullish momentum.
Strategy: Aggressive entry with a focus on trailing stop losses as the price advances.
Scenario 2: Pullback to 1.72 USDT
Should the price retrace to 1.72 USDT, expect a bounce from the trendline and volume accumulation area. This would offer a solid risk-reward setup for a long trade.
Strategy: Conservative entry with a stop loss below 1.70 USDT, targeting 2.00-2.20 USDT.
Scenario 3: Sideways Consolidation
If the price continues to hover between 1.80 USDT and 2.00 USDT without clear momentum, you might consider scalping or range trading opportunities.
Strategy: Enter near the lower range of 1.80 USDT and exit near 2.00 USDT, capturing small but consistent profits.
Final Thoughts:
The overall setup for WLD/USDT looks promising, with clear bullish signals on the 1D chart and confirmation from the 4H chart that momentum is building. Watch for a confirmed breakout above 2.00 USDT or a retest of the 1.72 USDT trendline for optimal entry points. Proper risk management and a close eye on key levels will help in capturing potential gains while minimizing downside exposure.

WLD will breakout soonMIL:WLD might show some huge pumps, currently consolidating in selling zone but looking strong to breakout from this region soon everything is Depended over the movement of Bitcoin.

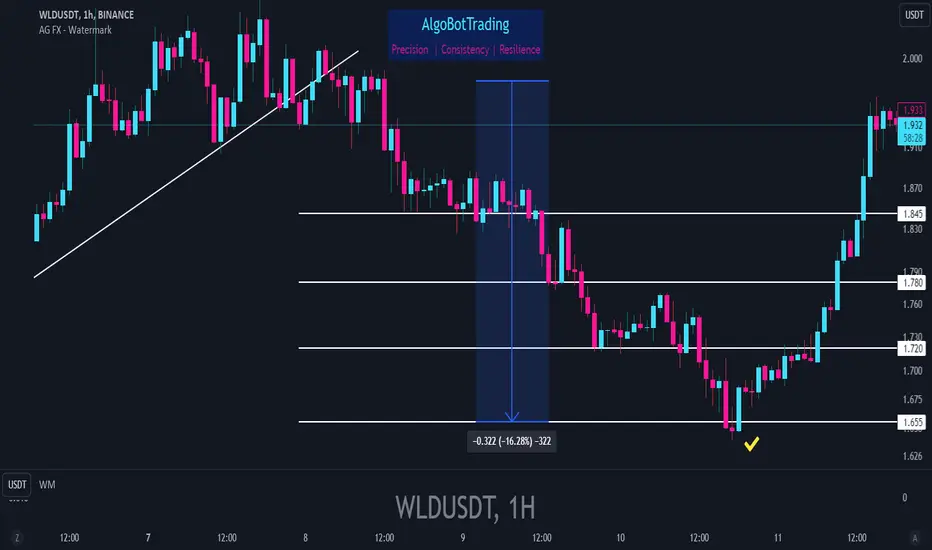
WLD Short setup update - Oct 11 2024With some -16% drop from the entry zone, #WLD touched TP4 of the short setup. Using a 5X leverage, that would be some 80% profit. Nice trade indeed.
WLD PriceWLD’s daily chart analysis signifies a bearish bias, as the altcoin fell below the key EMAs. Amidst multiple attempts to crack the $2 supply region, the bull army could not split the level and lost their momentum.

#WLD/USDT#WLD
The price is moving in a descending channel on the 1-hour frame
And it is sticking to it well
We have a bounce from the lower limit of the descending channel and we are now touching this support at a price of 1.70
We have a downtrend on the RSI indicator that is about to be broken, which supports the rise
We have a trend to stabilize above the moving average 100
Entry price 1.75
First target 1.85
Second target 1.97
Third target 2.11

WLDUSDTmy entry on this trade idea is taken from a point of interest BELOW an inducement.. I extended my stoploss area to cover for the whole swing as price can target the liquidity there before going as i anticipate.. just a trade idea, not financial advise

WLD - big rise from POC of a range. NEw trade after ValueWLD - big rise from POC of a range. NEw trade after Value
As I told you in a video - price should create value only after we can take a new trade
best area for a trade will be VAL for LONG

WLDUSDT: Bullish trend WLDUSDT is moving in uptrend and currently moving sidewise, and its possibility to touch the 0.5 level of the fib and this is the best point for the buying, so we will wait for the touch the 0.5 level of the fib and take a long trade and if its break the HHs so we can take long trade on the break of the HHs with proper risk management.

WLD (1H) possible SHORT setup - Oct 07 2024#WLD 1H Short Setup
Trigger: 1H close below the ascending trendline (risk-takers can already open the position)
TPs: 1.845 - 1.78 - 1.72 - 1.655 - 1.585
SL: 2.081
Avoid high leverage please.


Target 3.75I got a long signal from my screener for weekly chart. I am uing 2 different fibonacci strategy for the target.
TP1 2.24
Tp2 2.43
TP3 2.53
TP3 - My main target will be 3.75-3.78
Will stop under 1.74 weekly close.
Thoughts?
