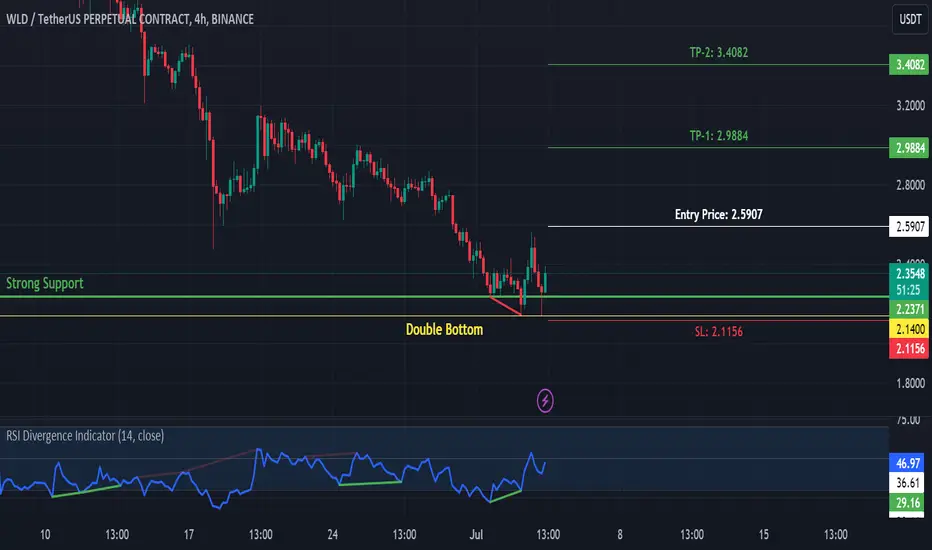
WLDUSDT: Bullish Trend (Double Bottom)WLDUSDT is moving in bearish Trend and touch the strong support area, and will be bounce back to the resistance area, and there is a strong bullish divergence and double bottom which is another sign of the reversal, so we will wait for the break of the previous LHs to take long trade.
WLDUSDT trade ideas
WLDUSDT.1DThe WLD/USDT chart from Binance provides a comprehensive overview of the pair's performance over the past months, highlighting its volatile journey and key technical levels to watch.
Analyzing the chart, it's clear that WLD has experienced a sharp decline from its highs, setting a context for potential strategic entries and exits. Currently, the price hovers around $1.966, below the critical resistance level (R2) of $4.141. The primary support level (S1) is identified at $1.554, which if breached could lead to further downward pressure.
From a technical standpoint, the descending trendline starting from the peak and connecting the highs shows a clear downward momentum. A breach above this trendline and the resistance at R2 could indicate a reversal or at least a significant pullback, providing a bullish signal for traders.
Conversely, the strong resistance at $4.141 could continue to suppress upward movements unless there is a strong market catalyst. Traders should monitor for a potential breakout above this level, which could pave the way towards higher prices, possibly reaching towards previous highs if accompanied by strong buying volume.
Conclusion:
Investors and traders should keep a close eye on the $1.554 support level. A break below this could signal a continuation of the bearish trend, potentially making room for lower lows. On the flip side, any movements above the descending trendline and the $4.141 resistance could offer a more optimistic outlook, suggesting a potential shift in the current trend. Always consider integrating broader market analysis and news into your trading strategy to complement the technical outlook. Remember, setting stop-losses is crucial to manage risks effectively in such volatile environments.

WLD USDT is gonna back in the game !The value of entering into the trade is very high,
I know the bear market is over

Long WLD
WLD is at its previous low set in January 2024.
Trade set-up is as in chart.
Disclaimer:
This analysis is based on my personnal views and is not a financial advice. Risk is under your control.

WLD - 2$ entry for bounce playWasn't following this coin for weeks now but recently got my attention given it's down horrendously. Think we will see a decent bounce at the 2$ level later this day/tomorrow. Not sure how high it will go, could run into the yearly open at max, but think that's too much to ask, so I would already be happy with anything between 20-30-40%.
Stay safe!

WLDUSDT 1D placed on good support#WLD Buy Setup
buying small size with no leverage.
placed on good support

#WLDUSDT #2h (ByBit) Falling wedge breakout and retestWorldcoin regained 50MA support and is pulling back to it, road to 200MA resistance seems next.
⚡️⚡️ #WLD/USDT ⚡️⚡️
Exchanges: ByBit USDT
Signal Type: Regular (Long)
Leverage: Isolated (5.0X)
Amount: 5.2%
Current Price:
2.416
Entry Targets:
1) 2.403
Take-Profit Targets:
1) 2.771
Stop Targets:
1) 2.219
Published By: @Zblaba
MIL:WLD #WLDUSDT #2h #Worldcoin #Privacy worldcoin.org
Risk/Reward= 1:2.0
Expected Profit= +76.6%
Possible Loss= -38.3%
Estimated Gaintime= 5 days

WLLDUSDT is BullishPrice was in a strong down trend, however the matured bullish divergence forecasted that bulls are trying to win control and a reversal is on the horizon. With first higher high printed successfully, it seems that the bullish rally is about to begin, if BTC remains stable and fresh higher high is broken, we can expect a bullish reversal as per Dow theory. Targets are mentioned on the chart.

WLDUSDT 2DWLD ~ 2D
#WLD This support block must not be penetrated. this is key support for $WLDUSD. We placed a small buy here with a short term target of at 15%+ of this

WLD/USDT LOOKS READY FOR A BIG PUMP!!Hey everyone!
If you're enjoying this analysis, a thumbs up and follow would be greatly appreciated!
WLD looks very good in the daily time frame. Forming a bull flag-like structure here. Also, holding an important support level and bouncing from here. Accumulate it here and hold it till the bull run, expecting 5-6x profit from here.
Entry range:- $2.0-$2.5
Targets:- $3.5/$4.4/$6.1/$8.8/$12.4/$16.2
SL:- $1.7

WLDSFP seems to have reached an important range. This range is a high and fresh pivot time frame.
If the price can create a bullish iCH on the chart, we have more confirmation and we can enter a buy/long position in the pullback.
The targets are clear on the chart.
Closing a daily candle below the invalidation level will violate the analysis.
Note that the financial market is risky, so:
Do not enter any position without confirmation and trigger.
Do not enter a position without setting a stop.
Do not enter a position without capital management.
When we reach the first TP, save some profit and try to move the stop continuously in the direction of your profit.
If you have any comments please post them, comments will help us improve our performance
Thanks

WLD - 90% rise in Open interest! Big move is Coming!WLD - 90% rise in Open interest! Big move is Coming!
In a video i compared WLD to SOL how price action behaved
i think we need clear structure change -that would be our Signal for LONG
better to watch full ANalysis

Worldcoin to will be bullishWorldcoin is at retracement point and has reached position of bouncing back. The Wxyxz pattern has drawn, we expect expanding pattern that takes Worldcoin to 8.3 at maximum in accordance with fibonnacci extension but i suggest taking profit at 7.5.

LONG #WLDUSDTLONG #WLDUSDT from $2.3762 stop loss $2.3674
The instrument formed clear resistance levels with several confirmatory touches, behind which the stops of the participants' shorts accumulated, opening their positions from them. There is also a local uptrend, pushing the price to the level with the help of buyers on increased trading volumes.
I will wait for consolidation along the levels and, with increased activity in the glass, an impulse breakdown.

WLDUSDT WLDUSDT is in bearish trend.
Bullish divergence also form in RSI.
Falling wedge reversal pattern also form.
Reversal scores are strong here.
But we wait for the further confirmation if it will break the last LH then we will enter the trade .

Massive unlocks are on the way ---- WLDIn this market, there is an event-driven trading strategy based on token unlocking. Through the data provided by third-party websites, we found that after 22 days, WLD will usher in additional lines to be unlocked. Unlock 6.62m WLDs every day for 730 days, which is equivalent to three times the original rate. This part of the unlocked tokens comes from the community, which is a relatively simple holder. Therefore, bearish power will be generated.
WLD, as a global token issued by Sam, OpenAI CEO, is regarded by many traders as the embodiment of OpenAI's value. Worldcoin has built a device called the Orb, which captures an image of a person's eyes and converts it into a short numeric code, making it possible to check if the person has already signed up. If not, they will receive their free share of Worldcoin.
After these tokens are unlocked, a total of 4 billion WLD will be released, which is equivalent to several times the current circulating supply. MC will be priced again. Although WLD is currently down 80% from its high point, the short power will become stronger.
The same is true from the TSB indicator. After the SELL signal was prompted on June 8, WLD once again opened a bearish channel. The column barely touches the red wavy area. Bears have power. Based on the above situation, WLD may continue to fall.
Introduction to indicators:
Trend Sentinel Barrier (TSB) is a trend indicator, using AI algorithm to calculate the cumulative trading volume of bulls and bears, identify trend direction and opportunities, and calculate short-term average cost in combination with changes of turnover ratio in multi-period trends, so as to grasp the profit from the trend more effectively without being cheated.
KDMM (KD Momentum Matrix) is not only a momentum indicator, but also a short-term indicator. It divides the movement of the candle into long and short term trends, as well as bullish and bearish momentum. It identifies the points where the bullish and bearish momentum increases and weakens, and effectively capture profits.
Disclaimer: Nothing in the script constitutes investment advice. The script objectively expounded the market situation and should not be construed as an offer to sell or an invitation to buy any cryptocurrencies.
Any decisions made based on the information contained in the script are your sole responsibility. Any investments made or to be made shall be with your independent analyses based on your financial situation and objectives.

WLDUSDT Bullish WLDUSDT looking Bullish below are the points.
Making Double Bottom in 15Min chart, we have to weight the neckline to break but as per my analysis it can go bullish but if it break the LL then we can see the bearish scnerio.


WLD PriceThe Worldcoin (WLD) was in major downtrend and revealed severe underperformance for the past weeks

wld could show up again The weekly chart currently shows a bearish trend with potential for a reversal if the support levels hold. The indicators suggest that the market is oversold, which could lead to a bullish correction. However, the overall sentiment remains cautious, and confirmation of a reversal with increased volume and breaking above key resistance levels would be needed for a more bullish outlook.

WLDUSDT SHORT.World halen konsolidasyon evresine geçiş yapamadı. Halen düşüş trendi paralel kanalın alt bandına doğru ilerliyor.

WLD longNow is a time to go up for WLD
I think we must buy WLD only
One of the targets is 8 dollar
It's my opinion that can be mistake
