wldIf it doesn't break the green box in the short term, or if it doesn't break the green line at the lowest point in a slightly higher time, it can see higher numbers.
WLDUSDT trade ideas

Happening a pullback to Support ZoneOn 4H TF
World Coin is happening a pullback to 1.67 - 1.57
BINANCE:WLDUSDT has Golden Ratio and Fibo Clusters at the same zone. Besides, I found the Fair Value Gap around 1.57 that is also a good zone for supporting.
Wait for next move

WLD/USDT It required break to continue the upward movement !!💎 WLD has indeed garnered considerable attention in the market. Presently, WLD faces a rejection following its encounter with the supply area. There's a possibility that WLD might enter a retesting phase at the support area of $2.05, creating new momentum to break through the supply zone.
💎 However, an alternative scenario involves WLD directly breaking out of the supply area without a retesting phase, probability allowing for a sustained upward movement towards our target area determined using Fibonacci levels. This decision is based on the chart's ambiguous Wick or resistance and unclear supply dynamics.
💎 The unfavorable scenario unfolds if, during the retesting process at the support level, WLD struggles to maintain its position and experiences a breakdown. In such a case, WLD could retreat to the next lower support trendline within the ascending channel, specifically around $1.86. At this juncture, WLD would have a final opportunity for a resurgence by successfully reclaiming the support at $2.05. Failure to do so may result in WLD continuing its downward trajectory, eventually revisiting the key support area.

Is Worldcoin ($WLD) The Future Of CryptoKey Takeaway
1. Worldcoin’s WLD token has a market cap of more than $265 million, despite launching less than a fortnight ago.
2. Although there has been a lot of excitement about the project, some crypto experts claim it is a scam.
3. Can Worldcoin grow, or will it be another forgotten crypto?
Worldcoin, the iris-scanning, privacy boosting answer to artificial intelligence created by the man behind the most notorious AI platform around, was the hottest topic in crypto in the summer of 2023.
The system, which is designed to create a world where people can carry out transactions internationally, saw its coin hit a market cap of more than $265 million less than two weeks after it came on the open market.
WLD Price History
Now, let’s examine the, admittedly brief, Worldcoin price history . While we should never take past performance as an indicator of future results, knowing what the coin has achieved can provide us with some very useful context if we want to make or interpret a Worldcoin price prediction.
WLD first came onto the open market in July 2023. On July 24, it opened at an all-time low of $1.66 before reaching an all-time high of $3.58 later that day. Since then, it has fallen down and, on August 4 2023, it was worth about $2.30.
At that time, there were 117.89 million WLD in circulation out of a total supply of 100 billion. This gave the token a market cap of about $267 million, making it the 115th-largest crypto by that metric.
Worldcoin Price Analysis
WLD had a wild ride on its first day of trading. On July 24, it rose 115% before dropping nearly 40% to close at $2.19 and fell a further 12% to $1.91 the following day.
Since then, it has mostly traded between $2 and $2.50, suggesting that the latter price could be its upper limit for now.
Is Worldcoin a Good Investment?
It is hard to say. Keep in mind that WLD has only been openly available for less than two weeks at the time of writing. Therefore, we don’t know how well the token can respond to either massive bull markets or devastating crashes.
There are also some concerns about the platform and its token. It has been accused of not quite being all it makes itself out to be.
Will Worldcoin go up or down?
No one can really tell right now. While the Worldcoin crypto price predictions are largely positive, price predictions have a well-earned reputation for being wrong. Keep in mind, too, that prices can, and do, go down as well as up.

Really Bullish on WorldCoin (WLD)I am optimistic about the future of Worldcoin for several compelling reasons. As a cryptocurrency enthusiast, my bullish stance is driven by the following factors:
Innovative Technology: Worldcoin boasts innovative technology that sets it apart in the ever-evolving cryptocurrency space.
Market Potential: With a clear vision and a strategic roadmap, Worldcoin has the potential to address crucial market needs and carve out a significant niche in the cryptocurrency ecosystem.
Strong Development Team: The project's success often hinges on the competence and dedication of its development team. Worldcoin benefits from a talented and experienced team that inspires confidence in its ability to execute its vision.
Community Support: A thriving community is a crucial aspect of any successful cryptocurrency project. Worldcoin's growing and engaged community indicate a positive sentiment and a foundation for sustained growth.
Strategic Partnerships: The establishment of strategic partnerships can significantly impact a cryptocurrency's adoption and integration into the broader financial landscape. Any notable partnerships or collaborations should be highlighted.
Market Trends and Demand: Analyzing current market trends and assessing the demand for Worldcoin's utility or services can provide insights into its potential for future growth.
It's important to note that cryptocurrency investments come with inherent risks, and due diligence is crucial. Stay informed about the latest developments, regulatory changes, and market trends to make well-informed decisions.

Worldcoin WLD long medium-term trade #18Altcoins prices are starting to reach areas where we would be ready to buy longs for medium-term trades.
So we'll try to publish a little more trades for the community in the near future, but it's not certain)
Today, we'll take a look at Worldcoin, which is a fairly young coin but has already made "a name for itself".
It's worth remembering that many WLDs were given away for free, and some were given for a retinal print. And there are still relatively few coins in circulation of the declared number.
Despite the fact that the 12hr candlestick draws a pinbar-like pattern that can give a chance for a rebound to $1.65, we are ready to buy this coin on the following conditions:
Entry: in the range of $1.20-1.36 (desired average price of $1.28)
Stop: $1.094 (-14.53%)
Take profit: $2.27 (+77.34%)
P/L ratio: 5.3
Since this is a trade with a medium-term timeframe, and the coin itself is volatile, the stop is relatively large, but the prospects for potential take profit are not bad.
We allocate $5,000 for WLDUSDT trade, in the event of a mistake, we will lose $726. If the trade will be a success, we will receive a profit of $3860

WLDUSDTTRADE ALERT!WLD
Ticker: WLD/USDT
Entry: 1.90-2.10
Take Profit: 2.4-2.5
Stop Loss:1.8(Daily Close Below this)
Risk to reward: 1:2
Technical Thesis:Waiting for this channel breakout.Once breakout we will see 2.40$ next target for WLD


WLDUSDT sell2buy ideamy entry on this trade idea is taken from a point of interest below an inducement.. I extended my stoploss area to cover for the whole swing (for the long) as price can target the liquidity there before going as i anticipate.. same idea for both long and short.. just a trade idea, not financial advise

WLDUSDT.P LongWLDUSDT.P Long Breakout!
Entry - 1.7761
TP1 - 2.088
TP2 - 2.7087
TP3 - 3.2086
SL - 1.640
Use low leverage only and 1% margin.
Happy trading!
TYOR, DYOR

WLD/USDT - Worldcoin: Double_Bottom◳◱ We've a Double Bottom pattern on the MIL:WLD / CRYPTOCAP:USDT chart. This pattern is a bullish indication and could indicate a potential trend reversal. We may consider buying at the neckline at the current price. The next resistance key levels are at 1.779 | 1.926 | 2.262 and the major support zones are respectively at 1.443 | 1.254 | 0.918.
◰◲ General info :
▣ Name: Worldcoin
▣ Rank: 145
▣ Exchanges: Binance, Kucoin, Bybit, Huobipro, Gateio, Mexc
▣ Category/Sector: N/A
▣ Overview: Worldcoin project overview is currently unavailable. I'll try to update this in the upcoming analysis.
◰◲ Technical Metrics :
▣ Mrkt Price: 1.717 ₮
▣ 24HVol: 37,818,273.587 ₮
▣ 24H Chng: 14.619%
▣ 7-Days Chng: 5.77%
▣ 1-Month Chng: 6.07%
▣ 3-Months Chng: -23.62%
◲◰ Pivot Points - Levels :
◥ Resistance: 1.779 | 1.926 | 2.262
◢ Support: 1.443 | 1.254 | 0.918
◱◳ Indicators recommendation :
▣ Oscillators: NEUTRAL
▣ Moving Averages: STRONG_BUY
◰◲ Technical Indicators Summary : BUY
◲◰ Sharpe Ratios :
▣ Last 30D: -0.11
▣ Last 90D: -0.31
▣ Last 1-Y: N/A
▣ Last 3-Y: N/A
◲◰ Volatility :
▣ Last 30D: 0.99
▣ Last 90D: 1.27
▣ Last 1-Y: N/A
▣ Last 3-Y: N/A
◳◰ Market Sentiment Index :
▣ News sentiment score is N/A
▣ Twitter sentiment score is N/A
▣ Reddit sentiment score is N/A
▣ In-depth WLDUSDT technical analysis on Tradingview TA page
▣ What do you think of this analysis? Share your insights and let's discuss in the comments below. Your like, follow and support would be greatly appreciated!
◲ Disclaimer
Please note that the information and publications provided are for informational purposes only and should not be construed as financial, investment, trading, or any other type of advice or recommendation. We encourage you to conduct your own research and consult with a qualified professional before making any financial decisions. The use of the information provided is solely at your own risk.
▣ Welcome to the home of charting big: TradingView
Benefit from a ton of financial analysis features, instruments and data. Have a look around, and if you do choose to go with an upgraded plan, you'll get up to $30.
Discover it here - affiliate link -

WLD │ 20.10.2023BINANCE:WLDUSDT.P
Signals for level breakout
bar/candles closure near the level;
close retest of the level;
accumulation of energy for level breakout;
consolidation near the level;
decrease in trading volumes before the level;
there is no reaction to a strong instrument movement;
no response to a false level breakout;
the instrument is being held from falling/rising in price;
there is a reserve of calculated ATR;
there is a reserve of technical ATR;
Trade Parameters
Open : 1.4354;
Stop loss : 1.4482;
Take profit :
1.3971;
1.3843;
1.3715;
Disclaimer
Every trader should make their trading decisions based on their own analysis and circumstances. The signals in this channel should be considered as an additional tool for your own consideration.
Follow me and receive high-quality cryptocurrency market analysis!


$WLD ShortMy last idea hit stoploss but a very small margin
Why did I lose?
Trading is time-sensitive hence I was shorting at discount levels, shorting during London volume
There was a premium PB- and an OB- that the market had to draw to, since we are still bearish taking a short here makes our stop at an ideal place.

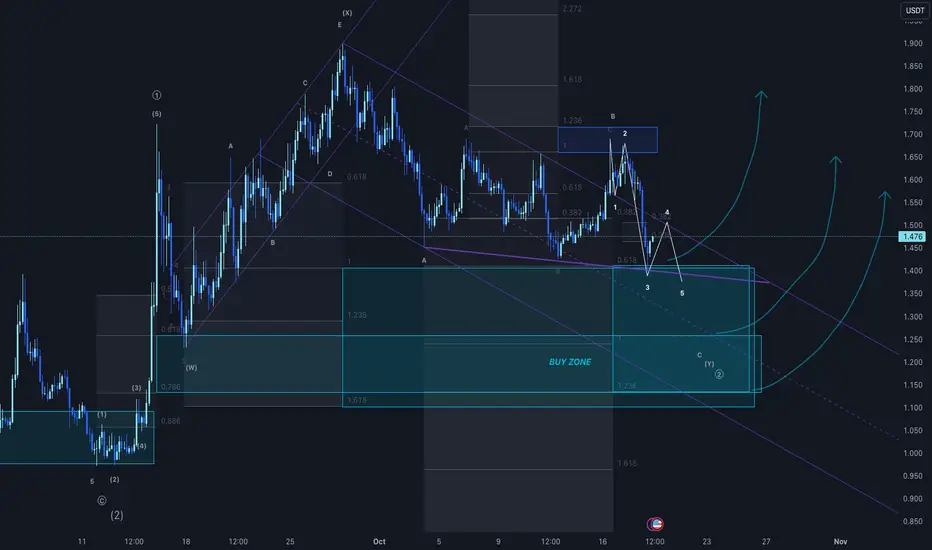
One more low for WLDThe price has entered all 3 buy zones so micro wave 2 could be complete and we could see a reversal but I expect one more low in a wave 5.
BINANCE:WLDUSDT
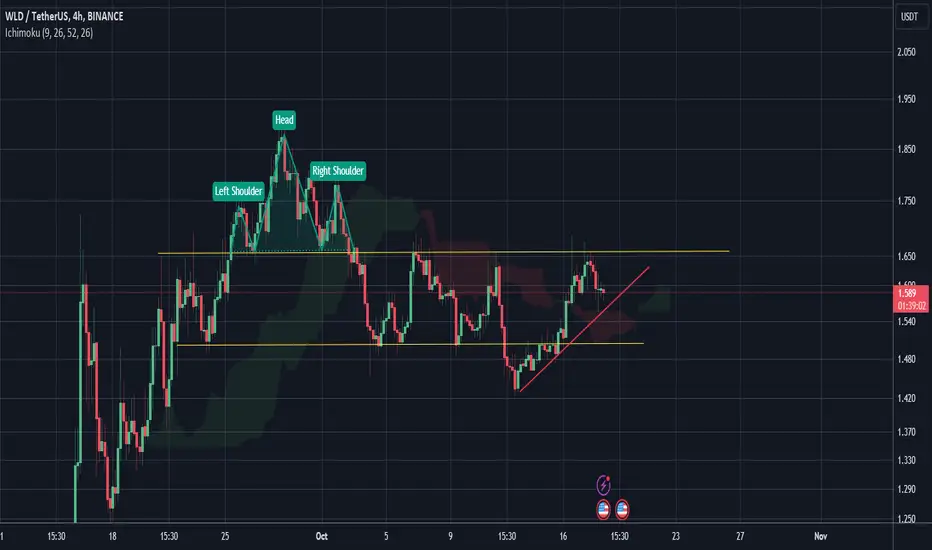

WLD/USDT a LONG opportunityWLD has made a clear bounce from its support and is now forming new lower highs, which is a positive sign for a bullish trend.
This looks like a great opportunity for a long trade.
Entry Price: 1.52
Stop Loss: 1.474
Take Profit Targets:
TP1: 1.531
TP2: 1.554
TP3: 1.589
TP4: 1.658
Don't forget to keep your stop loss.
Cheers!

WLDUSDTWLDUSDT is trading in descending channel and printing consistent LLs LHs. Recently the price is broken the important support zone and now retesting the broken level, which is also the 0.38% Fib retracement level.
If the sell momentum continues the next target could be 1.40 followed by 1.30 region.
What you guys think of this idea

WLD USDT 1 Hr Outlook Bullish BYBIT:WLDUSDT
WLD USDT 1 Hr Outlook Bullish
In the one-hour outlook for the WLD USDT pair, a bullish sentiment is prevailing. The price has established a robust support level at 1.47, and it is currently in the process of breaking the previous higher high (H.H) to set a new one. This indicates a favorable opportunity for traders to consider long positions for their intraday trading strategies. The price is also demonstrating an increasing bullish momentum, suggesting the potential for further upside movement in the coming hour.
Disclaimer: Please be aware that this information is not provided as financial advice. It is crucial to conduct your research and due diligence before making any trading decisions. Financial markets can be highly volatile and involve risks, and the information provided here is for informational purposes only.

WLDUSDT.PTrade idea on WLDUSDT.P
Taking a short entry at the marked order block after the inducement (marked X) has been taken at $1.4454 with a take profit price of $0.7309 and a stoploss price of $1.5875.
I highly encourage tight risk management because the stoploss in percentage is 9%
This is just a trade idea and not a financial advise.
Follow me for alpha crypto updates and trading tips.

WLDUSDTBINANCE:WLDUSDT Short idea
⚠️Note:
In this type of signals, only the entry point and trade direction are specified, and stop loss and target are not determined.
If you are interested in entering these signals, please provide a stop loss and a logical market-based target.
⛔"Daily crypto market analyses I provide are personal opinions & not financial advice. Trading carries risks, so do your own research & seek advisor's help.#DYOR"
Don't forget to like and comment
