#WLD/USDT#WLD
The price is moving within a descending channel on the 1-hour frame and is expected to continue upward.
We have a trend to stabilize above the 100 moving average once again.
We have a downtrend on the RSI indicator, which supports the upward move by breaking it upward.
We have a support area at the lower limit of the channel at 0.750.
Entry price: 0.0764
First target: 0.0782
Second target: 0.800
Third target: 0.829
WLDUSDT trade ideas

Wldusdt trading ideaWLD initially formed a rising wedge, a well-known bearish reversal pattern, within the External Supply Zone. The break below the wedge triggered a significant drop, pushing price through the Supply Zone before finding support in the Critical Demand Zone, which also aligns with a key Fibonacci retracement level.
Currently, price is developing a falling wedge, a typical bullish reversal structure, suggesting potential upside momentum. A breakout above this wedge could confirm trend reversal, with the first key target around $4.029, aligning with the Supply Zone. If momentum sustains, the next major resistance stands at $11.424, near previous structural highs.
With RSI showing signs of reversal from oversold territory, will this bullish setup play out?

#WLD/USDT#WLD
The price is moving within a descending channel on the 1-hour frame, adhering well to it, and is heading for a strong breakout and retest.
We are seeing a bounce from the lower boundary of the descending channel, which is support at 0.725.
We have a downtrend on the RSI indicator that is about to be broken and retested, supporting the upward trend.
We are looking for stability above the 100 moving average.
Entry price: 0.747
First target: 0.769
Second target: 0.788
Third target: 0.812

TradeCityPro | WLD: Waiting for Reversal in Altman’s Web3 Coin👋 Welcome to TradeCity Pro!
In this analysis, I want to review the WLD coin for you. This project is one of the notable Web3 and Identity projects, founded by Sam Altman, who is also the CEO of OpenAI — and that adds a layer of trust to the project.
🔍 Currently, this coin has a market cap of $984 million, placing it at rank 64 on CoinMarketCap.
📅 Daily Time Frame
As you can see in the daily time frame, the price has dropped significantly since the previous analysis. After breaking below the 1.349 level, the main bearish leg began, and the price fell to the 0.603 area.
🧩 Currently, the price is in a correction phase, moving slowly upward on low volume, and has broken above the SMA25, now trading above this moving average.
🎲 Keep in mind: even though the price is above the SMA25, the slope of the moving average is still downward, which indicates that bearish momentum is still present in the market. However, since the price is now above the SMA, bearish strength is weakening.
📈 To confirm a bullish reversal for WLD, the key trigger right now is the breakout of the 0.947 level. If the price stabilizes above this level, we can say the trend has shifted to bullish.
✔️ A sooner confirmation of the trend change would be a positive slope on the SMA25 combined with increasing volume and green candles — this would be an early sign of a reversal.
🛒 For spot buying, the first trigger is the break of 0.947, and if the price holds above that, the bullish trend could begin.
🔽 The next resistance levels — which could act as targets or secondary buy triggers — are at 1.349 and 2.5776 respectively.
📊 If you already hold this coin and are looking to set a stop-loss, a break and confirmation below 0.603 would be a good level to activate your stop.
📝 Final Thoughts
This analysis reflects our opinions and is not financial advice.
Share your thoughts in the comments, and don’t forget to share this analysis with your friends! ❤️

WLDUSDT 1D AnalysisWLD ~ 1D Analysis
#WLD Mark this coin, and buy when successfully penetrating this resistant line with a short -term target of at least 10%+.

#WLD/USDT#WLD
The price is moving within a descending channel on the 1-hour frame, adhering well to it, and is heading for a strong breakout and retest.
We are experiencing a rebound from the lower boundary of the descending channel, which is support at 0.600.
We are experiencing a downtrend on the RSI indicator, which is about to break and retest, supporting the upward trend.
We are looking for stability above the 100 moving average.
Entry price: 0.640
First target: 0.660
Second target: 0.680
Third target: 0.700

WLDUSDT | Blue Box Resistance Zones – Especially Watch the UpperWLDUSDT is currently navigating a complex structure, and the blue boxes marked on the chart are key resistance zones to pay close attention to. These aren’t just visual markers—these zones reflect areas where sellers are likely to step in based on past reactions and current market behavior.
🔵 Resistance Insight:
The first blue box is a resistance zone, but the upper blue box stands out as a much higher probability area. If price manages to climb up there, it becomes a much more interesting level for potential shorts.
These zones have been picked based on clear behavioral patterns in the market, and if you’ve been following my work, you already know how accurate these selections often turn out to be.
📌 Trading Plan:
I’ll be watching for lower time frame confirmation—whether it’s a breakdown, CDV divergence, or failure to push higher.
If these levels break with volume and retest as support, I’ll flip my bias and look for long entries.
Until then, I’ll stay cautious and let the market do the talking.
🔁 Why Follow These? These levels aren’t random—they come from a strategy refined with precision and backed by high win rates. If you’re tired of guessing and want a more data-backed way to trade, you’re in the right place. Just remember: don’t chase—wait for the setup, trade with confirmation, and manage your risk.
📌I keep my charts clean and simple because I believe clarity leads to better decisions.
📌My approach is built on years of experience and a solid track record. I don’t claim to know it all but I’m confident in my ability to spot high-probability setups.
📌If you would like to learn how to use the heatmap, cumulative volume delta and volume footprint techniques that I use below to determine very accurate demand regions, you can send me a private message. I help anyone who wants it completely free of charge.
🔑I have a long list of my proven technique below:
🎯 ZENUSDT.P: Patience & Profitability | %230 Reaction from the Sniper Entry
🐶 DOGEUSDT.P: Next Move
🎨 RENDERUSDT.P: Opportunity of the Month
💎 ETHUSDT.P: Where to Retrace
🟢 BNBUSDT.P: Potential Surge
📊 BTC Dominance: Reaction Zone
🌊 WAVESUSDT.P: Demand Zone Potential
🟣 UNIUSDT.P: Long-Term Trade
🔵 XRPUSDT.P: Entry Zones
🔗 LINKUSDT.P: Follow The River
📈 BTCUSDT.P: Two Key Demand Zones
🟩 POLUSDT: Bullish Momentum
🌟 PENDLEUSDT.P: Where Opportunity Meets Precision
🔥 BTCUSDT.P: Liquidation of Highly Leveraged Longs
🌊 SOLUSDT.P: SOL's Dip - Your Opportunity
🐸 1000PEPEUSDT.P: Prime Bounce Zone Unlocked
🚀 ETHUSDT.P: Set to Explode - Don't Miss This Game Changer
🤖 IQUSDT: Smart Plan
⚡️ PONDUSDT: A Trade Not Taken Is Better Than a Losing One
💼 STMXUSDT: 2 Buying Areas
🐢 TURBOUSDT: Buy Zones and Buyer Presence
🌍 ICPUSDT.P: Massive Upside Potential | Check the Trade Update For Seeing Results
🟠 IDEXUSDT: Spot Buy Area | %26 Profit if You Trade with MSB
📌 USUALUSDT: Buyers Are Active + %70 Profit in Total
🌟 FORTHUSDT: Sniper Entry +%26 Reaction
🐳 QKCUSDT: Sniper Entry +%57 Reaction
📊 BTC.D: Retest of Key Area Highly Likely
📊 XNOUSDT %80 Reaction with a Simple Blue Box!
📊 BELUSDT Amazing %120 Reaction!
I stopped adding to the list because it's kinda tiring to add 5-10 charts in every move but you can check my profile and see that it goes on..

WLD — Heavy Discount. Long-Term Opportunity on the TableWLD has pulled back over 80% from its previous high — a massive correction that now opens the door for long-term accumulation. The current range looks like a gift for patient players. Don’t sleep on setups like this — they don’t come often.
Follow for more high-conviction plays like this one.
Entry: 0,7-0,71
TP: 1,37-3,35

New bottoms...Targetting fibonacci 1.618 level.
* The purpose of my graphic drawings is purely educational.
* What i write here is not an investment advice. Please do your own research before investing in any asset.
* Never take my personal opinions as investment advice, you may lose your money.

#WLD/USDT#WLD
The price is moving within a descending channel on the 1-hour frame and is expected to continue lower.
We have a trend to stabilize below the 100 moving average once again.
We have a downtrend on the RSI indicator, supporting the upward move with a break above it.
We have a support area at the upper limit of the channel at 0.844.
Entry price: 0.838
First target: 0.828
Second target: 0.809
Third target: 0.789

WLD (SPOT)BINANCE:WLDUSDT
WLD / USDT
4H time frame
analysis tools
____________
SMC
FVG
Trend lines
Fibonacci
Support & resistance
MACD Cross
EMA Cross
______________________________________________________________
Golden Advices.
********************
* Please calculate your losses before any entry.
* Do not enter any trade you find it not suitable for you.
* No FOMO - No Rush , it is a long journey.
Useful Tags.
****************
My total posts
www.tradingview.com
#WLD/USDT#WLD
The price is moving within a descending channel on the 1-hour frame, adhering well to it, and is heading for a strong breakout and retest.
We are seeing a bounce from the lower boundary of the descending channel, which is support at 0.807.
We have a downtrend on the RSI indicator that is about to be broken and retested, supporting the upward trend.
We are looking for stability above the 100 moving average.
Entry price: 0.835
First target: 0.858
Second target: 0.884
Third target: 0.915

Worldcoin $WLD Child Sam Altman (CEO of OpenAI) Worldcoin Project Analysis
Worldcoin is a cryptocurrency aimed at providing secure global economic access through innovative technology, primarily utilizing iris biometric identification. Co-founded by Sam Altman(CEO of OpenAI) , the project merges AI, blockchain, and decentralized finance for identity verification and equitable economic participation.
Key Innovations
Iris Biometric Technology : Unique method of online identity verification, addressing identity fraud concerns.
Layer 2 Ethereum Solution : Enhances transaction speed and security within the crypto landscape.
World ID and Orb: Users get a digital identity with unique IrisHash, promoting human verification against systems designed to prevent Sybil attacks.
Market Forecasts
Long-term Growth Potential: Analysts suggest potential price increases, a maximum of $6$, until the end of 2025
Current Market Condition: Despite innovations, Worldcoin’s WLD token is trading at an all-time low, emphasizing market volatility.
Regulatory Challenges
Privacy Concerns: Investigated in multiple countries for data protection, raising ethical questions regarding biometric data usage.
I mpact on Market Launch: Ongoing regulatory scrutiny may delay the global rollout, particularly in the US.
Investment Outlook
Pros:
- Innovative approach offers unique value in the crypto space.
- Significant token allocation for community support adoption.
- Focus on security enhancements and compliance could improve market perception.
Cons:
-Regulatory investigations may impact growth and trust.
-Current low market performance showcases potential investor skepticism.
-Ethical concerns surrounding biometric data handling may deter users.
Conclusion: Worldcoin holds significant long-term growth potential due to its innovative identity verification technology and economic paradigm shift towards equitable participation. However, market conditions, regulatory challenges, and privacy concerns pose serious investor risks. Monitoring regulations and technological developments will be crucial for potential investors in navigating this complex landscape.
Best regards EXCAVO

WLDUSDT - Bullish Gartley HarmonicPlease see fibs based from low to high gives you 0.618 at the ATR S1.
Gartley can retrace up to 0.382 to 0.618. Best case drawn to 0.888 a daily at that level, to retrace back down to 0.782.
Very rough analysis based on a post.
Given the current Fixed Range Volume looks broken (:D) I'm taking this approach.
Have to say, Chart Champions - Daniel. Not sponsored and genuine awesome traders. Love them! Check them out. I'm an absolute novice. Still and always will be learning. But Chart Champions are AWESOME! I LOVE THEM!

WLDUSDT: Is This the Last Chance Before a Major Breakdown?Yello Paradisers, are you prepared for what could be a textbook bearish opportunity on WLDUSDT? Because based on current price action and key confluences, this chart is screaming caution — and the next move might be much sharper than most expect.
💎WLDUSDT has broke down from a rising wedge pattern — a classic bearish signal that often leads to aggressive downside continuation. Alongside this, we’ve identified a clear internal Change of Character (I-CHoCH), followed by the formation of Fair Value Gaps (FVGs). These developments alone raise the probability of a bearish continuation, but that’s not all. The price structure is now forming a Head & Shoulders pattern — another strong reversal signal — increasing the bearish bias with multiple layers of confirmation.
💎If WLDUSDT pulls back from its current level and fills the FVG, we will be watching closely for a bearish candlestick pattern right around our defined resistance zone. This level also aligns perfectly with the Fibonacci golden pocket, adding even more weight to the area as a high-probability short entry. Should this setup form, the reward-to-risk (RR) potential becomes extremely favorable, providing an optimal entry for those waiting patiently.
💎On the other hand, for those considering entries from the current level — while the bearish probability still exists — the RR is much less attractive, hovering around 1:1 or even below. That’s not ideal, especially when managing risk like a pro. The probability of a pullback into the resistance area is still high, so it’s far better to wait for price to come to you. Only then will you have the proper setup to ensure a well-managed trade.
💎However, if WLDUSDT breaks above the resistance zone and we get a candle close above it, that would invalidate this bearish scenario entirely. In that case, it’s best to step aside and wait for better price action to develop. No need to force trades when the market is giving mixed signals — patience always pays.
🎖This is the only way you will make it far in your crypto trading journey. Be a PRO
MyCryptoParadise
iFeel the success🌴

WLD momentumWorld Coin momentum has been arrived
NOT MISS OUT this time...
for the hodlers .. the nightmare ends.... be patient and enjoy the profits not just the breake even the market is starting

WLD looks bearish in the mid-term (1D)It appears that a Wave A lasting 502 days has completed, and a wave of the same degree 502 days (or even larger) is expected to form on the chart, indicating that WLD is bearish in the mid-term.
Over the next 502 days, any pump is expected to be a selling opportunity. To enter a position, a proper trading setup is required.
A daily candle closing above the invalidation level will invalidate this analysis
For risk management, please don't forget stop loss and capital management
Comment if you have any questions
Thank You

#WLD/USDT#WLD
The price is moving within a descending channel on the 1-hour frame, adhering well to it, and is heading for a strong breakout and retest.
We are seeing a bounce from the lower boundary of the descending channel, which is support at 0.807.
We have a downtrend on the RSI indicator that is about to be broken and retested, supporting the upward trend.
We are looking for stability above the 100 moving average.
Entry price: 0.850
First target: 0.873
Second target: 0.900
Third target: 0.936


#WLD/USDT#WLD
The price is moving in a descending channel on the 1-hour frame and is adhering to it well and is heading to break it upwards strongly and retest it
We have a bounce from the lower limit of the descending channel, this support is at a price of 0.870
We have a downtrend on the RSI indicator that is about to break and retest, which supports the rise
We have a trend to stabilize above the moving average 100
Entry price 1.00
First target 1.05
Second target 1.12
Third target 1.20

#WLD/USDT#WLD
The price is moving in a descending channel on the 1-hour frame and is adhering to it well and is heading to break it strongly upwards and retest it
We have a bounce from the lower limit of the descending channel, this support is at a price of 0.948
We have a downtrend on the RSI indicator that is about to break and retest, which supports the rise
We have a trend to stabilize above the moving average 100
Entry price 0.976
First target 1.031
Second target 1.108
Third target 1.215

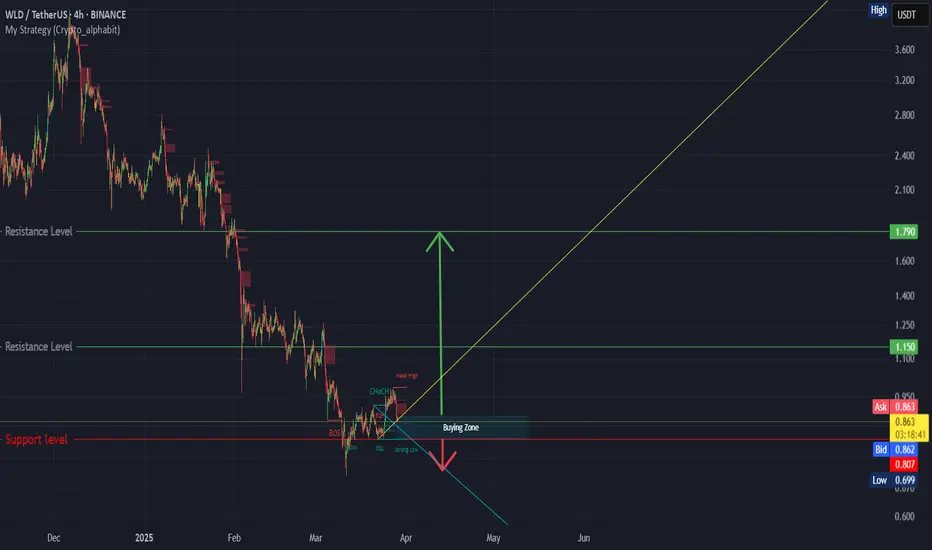
Buy WLD WLD is currently holding at a key weekly support level.
I strongly believe that AI-related cryptocurrencies will regain momentum once the crypto market heats up again.
Buy setup is as in chart.
Disclaimer:
This analysis is based on my personnal views and is not a financial advice. Risk is under your control.
