WLD/USDT Trade setup
📌 **Entry:** Market Price
🎯 **TP1:** 2.616
🎯 **TP2:** 3.2
🛑 **Stop Loss:** 2.2
📊 **Risk-to-Reward:** 5:1
**Analysis:**
- **Daily Support:** Strong.
- **4H Support:** Golden Pocket (0.618).
- **RSI:** Bullish Divergence confirmed.
- **Pattern:** Bullish Flag Retest on Daily.
🚨 **Disclaimer:** This is not financial advice. Trade at your own risk and always DYOR!
WLDUSDT trade ideas

WorldCoin | Potential Buyer ZonesWorldCoin Analysis: Potential Buyer Zones
The blue boxes on this chart are carefully identified as potential buyer zones for WorldCoin (WLD), based on proven technical strategies and meticulous analysis. I approach trading with confidence backed by experience and past success in identifying high-probability setups.
While I don’t claim to be the best, my track record speaks for itself, and I strive to let my analysis and results do the talking. Watch these levels closely—markets can confirm what charts already whisper. Let’s see how this plays out together.
My Previous Ideas
DOGEUSDT.P | 4 Reward for 1 Risk much more if you hold it.
RENDERUSDT.P | HTF Accuracy
ETHUSDT.P | Accurate Buyer Zone Identification | High Risk Reward if you hold it.
BNBUSDT.P | Accurate Buyer Zone Identification | High Risk Reward if you hold it.
Bitcoin Dominance | Great Characteristic Detection and Accurate Analysis

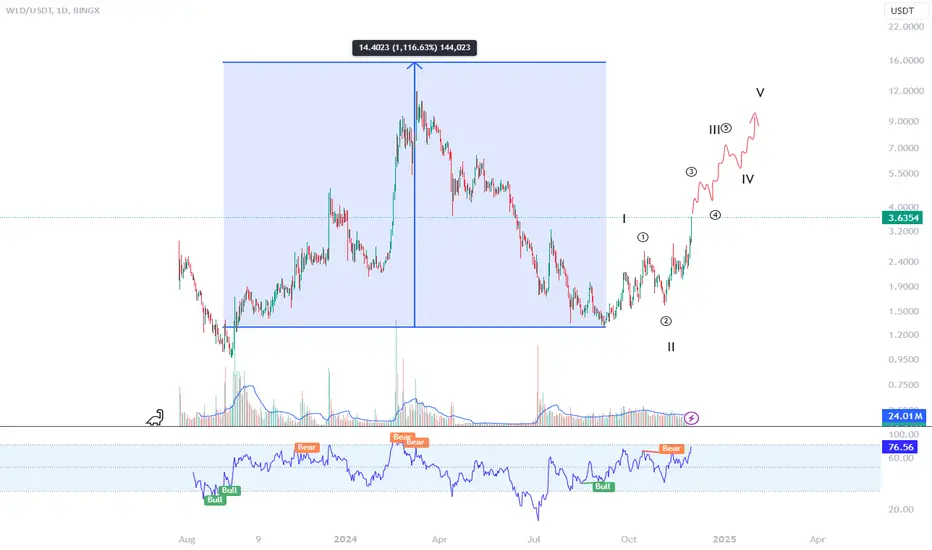
WLD confirme breakout and price target for next couple of monthsBe ready for the price action, WLD token breakout is confirmed currently 3rd wave is unfolding we should see price target ~ 9-10$ in next couple of months.
$WLDUSDT trading ideaHello All,
Im looking for 5-6 trading opportunities here. Im expecting to MIL:WLD follow arrow on the chart. I will try to trade every single move here.
All enter and exit prices on the chart. Trade carefully, if you miss one, try to catch other trades.
** Please show your support if you like to see more idea from me. LIKE 👍, FOLLOW ✅, SHARE 🙌 and COMMENT ✍ if you enjoy this idea! Also share your ideas and charts in the comments section below! This is best way to keep it relevant, support me, keep the content here free and allow the idea to reach as many people as possible. **
#trading #BTC #bitcoin #coin #scalping #crypto

Can Worldcoin ($WLD) Sustain Its 20% Rally?Worldcoin ( MIL:WLD ) has surged an impressive 21% in 24 hours, reaching $2.98 amid rising investor interest and a broader altseason rally. With trading volume up 119% to $1 billion, we are keenly watching whether this momentum will continue or face resistance. Let's explore the factors driving WLD's performance and its potential future trajectory.
Altseason and Adoption Growth
The ongoing altseason has provided a favorable backdrop for Worldcoin's recent surge. Altcoins often outperform Bitcoin during these phases, attracting significant capital inflow and investor interest. A confirmed breakout in the altcoin market capitalization, excluding Bitcoin, signals the start of a bullish phase. Worldcoin’s alignment with this trend highlights its potential as a key altseason player.
Moreover, Worldcoin’s expanding ID verification services in over 40 countries—including Costa Rica, Poland, and Austria—has added to its bullish momentum. This expansion demonstrates real-world utility and increasing adoption, boosting market confidence.
Technical Analysis: Key Levels to Watch
After its recent 21% surge, MIL:WLD is trading within a consolidation zone, currently down 2.28%. Despite this minor pullback, the technical indicators remain promising:
Support and Resistance
The key support lies at $2.49 and the 38.2% Fibonacci retracement level, providing a strong foundation if selling pressure increases.
The immediate breakout handle at $2.60–$2.65 is crucial. Surpassing this level could propel WLD to $4.78, with $3.40 as an intermediate target.
The RSI is Currently at 66, the Relative Strength Index indicates that buying momentum is still strong, holding off bearish pressures. However, if selling pressure persists, a retracement to the 38.2% Fib level is possible.
Impact of Major Altcoins
The broader market, particularly Bitcoin (BTC), Ethereum (ETH), and Binance Coin (BNB), will play a pivotal role in determining WLD's trajectory. If these major cryptocurrencies continue their bullish trend, MIL:WLD could ride the momentum and push past $3.40.
Conclusion
Worldcoin's recent surge is fueled by strong fundamentals and favorable technical patterns. The ongoing altseason and rising trading volumes suggest potential for further gains. However, traders should watch key resistance levels and market sentiment closely.
If MIL:WLD breaks above $2.65 convincingly, the path to $4.78 and beyond becomes more plausible. Conversely, a retracement to the 2.49 support level could offer a buying opportunity for those looking to capitalize on the next wave of altcoin momentum.
Stay vigilant— MIL:WLD ’s journey in this altseason is just beginning.

WLD - price broke big rnage Time to PUMP itWLD - price broke big rnage Time to PUMP it
Best place for long is after some SL hunt at VAL
same as it was on ETH

Bullish Analysis for WLD: Key Targets Ahead After Support Rebou#WLD/USDT
$WLD/USDT is showing strong bullish momentum, currently trading at $2.895, up 29.76%. The chart indicates a potential reversal with higher lows forming, supported by the critical level at $0.253. If the momentum persists, the next targets are $8.133, $12.055, and $15.692. A pullback for support retests may occur before another upward leg. Recommended buy opportunities are on support retests, with a stop-loss below $0.253, and profit-taking at the mentioned targets.


Worldcoin Turns Bullish: Cup & Handle Incl. Targets (1125% Pot.)Look at the volume, it is really high... We know the correction is over based on what Bitcoin is doing. Bitcoin is hitting new All-Time Highs and it is going really high. The Altcoins, such as Worldcoin, being lower is a huge opportunity. This means that they will move and do exactly what Bitcoin is doing, so Bitcoin is giving us an early signal.
👉 When Bitcoin grows 50%, a pair like this one, WLDUSDT, can grow 300-500%. It can be any project; Bitcoin is king and is big, when it grows a small bit, the rest of the market grows a big chunk.
When Bitcoin stops to take a break or retraces, the Altcoins will grow even more... The Altcoins will grow because Bitcoin is growing; the market does what Bitcoin does.
It is confirmed, WLDUSDT (Worldcoin) is going up!
Prepare for the rise.
Welcome to the bull —long-term.
2025 & beyond.
Thanks a lot for your support.
Namaste.

WLD/USDT Price Prediction - 1DAlways and at all times. All events will occur in the chart.
Trend Prediction - WLDUSDT Forecasting
Resistance and Support Lines
It seems that the head and shoulders pattern is forming
**** Yousef Sharafi ****


Wld monthly chartIn my opinion the price it will go back to 1.5
Then it will go back to 2.8 some correction then its gonna touch 3.2 with some correction and then the target is 5.1

#WLD/USDT Ready to go up#WLD
The price is moving in a descending channel on the 1-hour frame and sticking to it well
We have a bounce from the lower limit of the descending channel, this support is at a price of 2.13
We have a downtrend, the RSI indicator is about to break, which supports the rise
We have a trend to stabilize above the moving average 100
Entry price 2.30
First target 2.37
Second target 2.60
Third target 2.84

WLD Token: Wave 2 Completion & Wave Start on monthly basis**WLD Token: Wave 2 Completion & Wave 3 Start 🚀**
On the **monthly chart**, WLD appears to have completed **Wave 2** at the **88.6% retracement level**, a deep yet typical retracement in Elliott Wave structures. This aligns with a potential **Wave 3** initiation, which is often the strongest impulse wave.
📈 **Key Bullish Signals**:
- Deep Wave 2 retracement suggests strong base formation.
- Momentum indicators (e.g., RSI, OBV) aligning with bullish breakout potential.
- Wave 3 targets could extend to 1.618 or beyond, offering significant upside.
**⚠️ Disclaimer:**
This analysis is for educational purposes only. Trading involves risk; please do your own research and trade responsibly. Past performance does not guarantee future results. 🚨
What do you think? Let me know if you'd like adjustments!

WLDUSDTmy entry on this trade idea is taken from a point of interest BELOW an inducement.. I extended my stoploss area to cover for the whole swing as price can target the liquidity there before going as i anticipate.. just a trade idea, not financial advise


Long On WLD no leavarage 3-8X sugesstedWLD strong accumulation zone retested
above all 20 ema, 50 ema, 100 ema, at resistence level breaks it will min 10% gain in short time

SasanSeifi|Breaking $2.50, A Bullish Signal for LongTerm Growth! Hey there,On the 3-day timeframe, the price has been consolidating near its bottom range. If the price can break above $2.50 and hold this level, there’s potential for growth towards $4.00 and $4.50 in the medium term.
Long-Term Outlook:
After a pullback, the price may resume its uptrend, targeting $5.50, $6.50, and potentially $8.00 in the long term.
The key support level for this analysis is $1.50.
💡 Keep in mind, this is just my personal perspective and shouldn't be considered as financial advice. I’d love to hear your thoughts and engage in a discussion!
Happy trading!✌😎
Feel free to reach out if you have any questions or need more clarification. I'm always here to assist!✌
If you want any further adjustments, just let me know!

#WLD Potential Buy SetupGood Morning Ladies and Gentlemen's
i Introduce you my Prediction that the Officialy Altcoin Season had Started.
from now on look on bigger Target and Watch out how almost All Coins will Pump some in one Day some in the Other Day so from here on i don't need to Spam you with tons of Coins in a Day when you know everything will Pump.
The Best Safe Opportunities is SPOT but its your Choose.
📈 Entry CMP : 2.284
🛑 SL: 1.961
🎯 Target 1: 2.831
🎯 Target 2: 3.606
🎯 Target 3: 4.403
Cheers to All 🍾

Is #Worldcoin on the Brink of Major Breakout or Steep Decline?Yello, Paradisers! Is #WLD on the edge of a major bullish breakout or a steep decline? Let's discuss the latest #Worldcoin's analysis:
💎#WLDUSDT recently broke out of its descending channel resistance, sparking hopes of a bullish continuation. However, the rally is now facing a critical test at the $2.87 resistance level, which has halted upward momentum.
💎This minor resistance zone is a key inflection point; a clean break above it could confirm a bullish trend reversal, paving the way for #Worldcoin to target significantly higher price levels. Such a move would signal market confidence and mark a pivotal shift in market structure.
💎The downside risks, however, cannot be ignored. If #WLD fails to break above $2.87, it may retrace to test the major support level at $1.57. This area, aligned with a previous significant low, acts as a crucial safety net for buyers. A failure to hold this support would likely lead to a retest of the $1.29 demand zone, the final line of defense for bulls.
💎If #WLDUSDT closes below $1.29 on the daily chart, the bullish case would be entirely invalidated. Such a move would confirm a bearish outlook, increasing the probability of forming new lower lows and triggering deeper declines as market sentiment deteriorates further.
Stay focused, patient, and disciplined, Paradisers🥂
MyCryptoParadise
iFeel the success🌴

WLD Potential Head-and-Shoulders Pattern Suggesting Pullback to The WLD/USDT daily chart appears to be forming a potential Head-and-Shoulders pattern, a bearish reversal signal. This suggests a possible price decline toward the key trendline and support zone.
Key Observations:
Head-and-Shoulders Formation:
Left Shoulder: Formed during the initial rise.
Head: Peak of the recent rally.
Right Shoulder: Currently forming, indicating weakening bullish momentum.
Support Zone: A pullback to the green upward trendline near 2.10–2.15 is likely, aligning with the highlighted support box.
Bollinger Bands: The middle band (moving average) is acting as a potential dynamic support during this pullback.
Trade Plan:
Entry Strategy:
Enter a long position in the support range between 2.10–2.15, observing for a bounce with confirmation from bullish candlestick patterns.
Alternatively, consider shorting upon a break below 2.10, targeting deeper support.
Stop Loss:
Long Position: Place stop loss below 2.00.
Short Position: Set stop loss above 2.25 if the support breaks.
Take Profit Levels:
First Target: 2.30–2.35 (resistance from the right shoulder).
Second Target: 2.40–2.50 (higher Bollinger Band zone if bullish reversal occurs).
This setup hinges on price respecting the trendline. Monitor for increased volume during a potential breakout or reversal for better confirmation.

WLD Long 15 minWLD Long Setup
Reason:
Broke out of trend line, now mitigating the FVGs and taking out the Liquidity.
All Price action Indicators suggesting strong Bullish Momentum.
Resting on support and accumulation already done.
We can see strong Breakout in Short term.

WLD Long ideaWLD Long Idea with Volume Divergence and Fibonacci Extension
This long idea for WLD is based on volume divergence and the Fibonacci extension. The price could reach $3.00 but may drop if BTC goes down
