WOO ANALYSIS (8H)From where we placed the red arrow on the chart, it seems that the WOO correction has started. This correction on the chart seems to be double. It's over now.
Now we have a demand range on which we are looking for buy/long positions.
The target is marked on the chart.
Closing a daily candle below

WOO Technical Analysis in a Weekly TimeframeHello everyone, I’m Cryptorphic.
I’ve been sharing insightful charts and analysis for the past seven years.
Follow me for:
~ Unbiased analyses on trending altcoins.
~ Identifying altcoins with 10x-50x potential.
~ Futures trade setups.
~ Daily updates on Bitcoin and Ethereum.
~ High time frame (HT

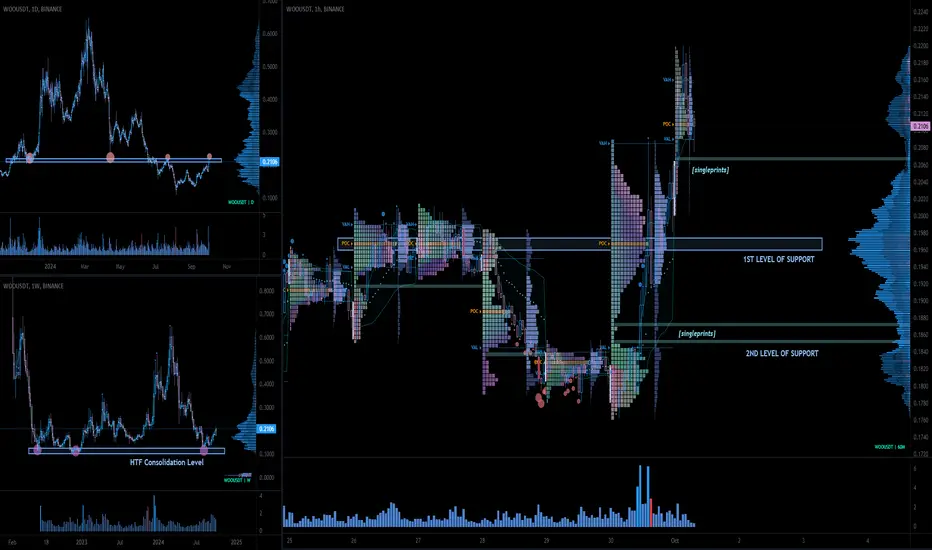
$WOO Key LevelsWOO experienced an unexpected 25% surge in the last 24 hours, now gaining attention following its listing on Korean exchanges Coinone and Bithumb .
On the weekly timeframe, the price has bounced off a higher timeframe consolidation zone.
Currently, the price is retesting a key level at $0.22 o
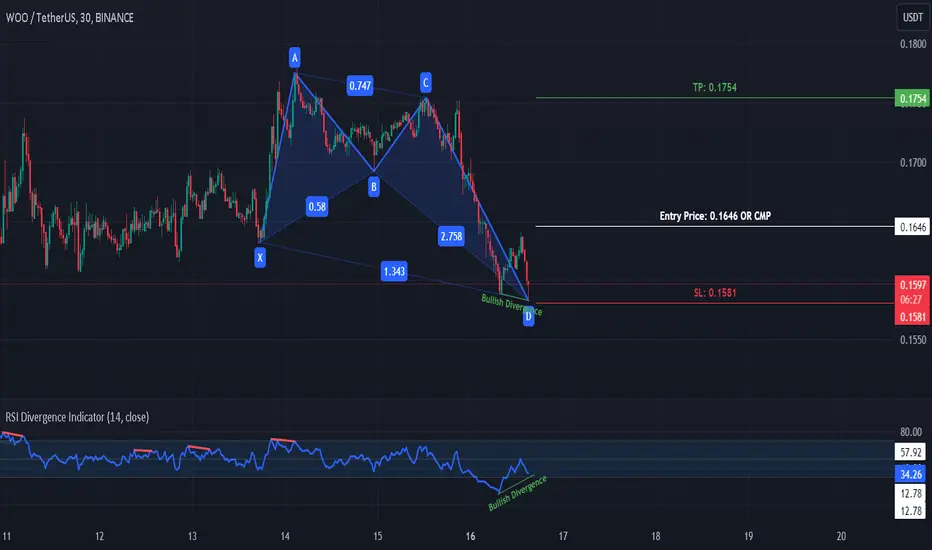
WOOUSDT: Bullish Trend (AB=CD Pattern)WOO is moving in uptrend and currently its forming AB=CD Pattern on 1hr time frame, and there is no bearish sign or bearish divergence, so for the bullish trend confirmation we will wait for the break of the previous HHs. and take a long trade with proper Risk Management.

WOO is Bullish now & many Traders don't see it !!BINANCE:WOOUSDT
As you can see, WOO has created an ascending head and shoulders and is also located in the Falling wedge, which means that if it breaks, we expect the price to reach the target (AB=CD).
✨Traders, if you liked this idea or have your opinion on it, write in the comments, We will

+100% move coming for $woo+100% move coming for FWB:WOO if it can break up from this .25c level;
ATH/ATL avwaps and VAH supports price
= clear shot to .50-.60c levels achievable

#WOO/USDT#WOO
The price has broken the descending channel on the 12-hour frame upwards and is expected to continue
We have a trend to stabilize above the moving average 100 again
We have an upward trend on the RSI indicator that supports the rise by breaking it upwards
We have a support area at the lower

Buy Trade Idea for WOO (Wootrade)Description
WOO (Wootrade) is a prominent player in the decentralized finance (DeFi) space, offering a unique liquidity network for traders, institutions, and decentralized exchanges. Here are the key fundamentals that make WOO an attractive buy opportunity:
- **Deep Liquidity and Zero Fees:** WOO

WOOUSDT: Bullish Trend (Harmonic Pattern)WOOUSDT is moving in Bullish Trend and currently its forming perfect Harmonic Pattern, So, for future trade must be wait for the break of the LHs for the confirmation of the bullish trend and for Spot trade u can buy on CMP with proper risk management.
As woousdt is so bullish 3xlong will be Amazing! More than 7000%As woousdt is so bullish 3xlong will be Amazing! More than 7000% pump is insane!
I suggest to GATE.IO Users su much!
I will update later...

See all ideas