WOOUSDT.P trade ideas

WOOUSDT (Daily) - Bearish breakoutHi Traders
WOOUSDT (Daily Timeframe)
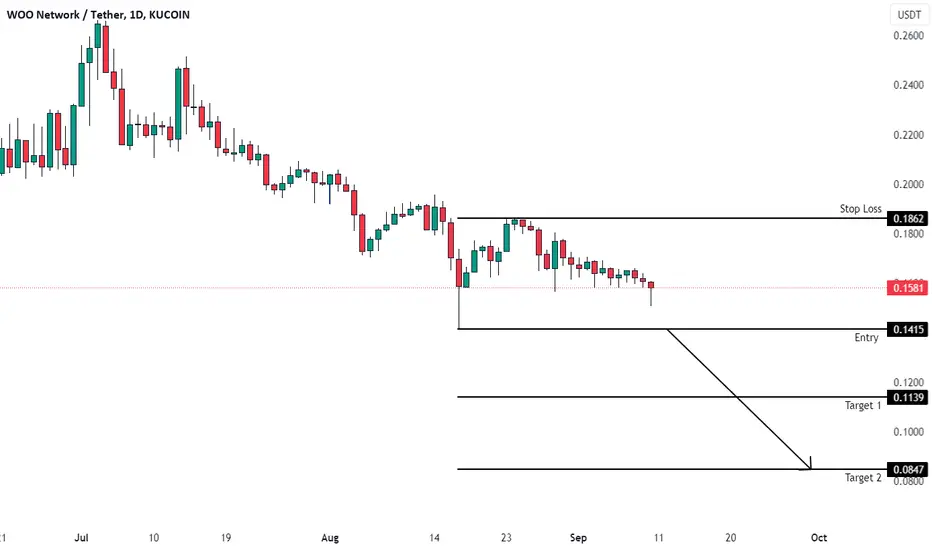
The market is in a downtrend and we are waiting for an entry signal to go SHORT below the 0.1415 support level. Only the upward break of 0.1862 would cancel the bearish scenario.
Trade details
Entry: 0.1415
Stop loss: 0.1862
Take profit 1: 0.1139
Take profit 2: 0.0847
Score: 8
Strategy: Bearish breakout
WOOUSD ❕ downward channelWOO is testing 50EMA as resistance (30m TF)
The asset is moving in a descending channel.
I think that the price will continue to decline.

WOO SHORT SETUP After hitting the fvg, bearish order flow has been well transferred to the candles.
Then after the bearish order flow was transferred, we saw a bearish CH.
A dynamic resistance has been formed above the price, which is the place of divorce between descending blocks. As the invalidation level is close, sell/short trades can be attractive.
The main and strong demand is Demand 2, where you should completely exit Sell/Short trades
For risk management, please don't forget stop loss and capital management
When we reach the first target, save some profit and then change the stop to entry
Comment if you have any questions
Thank You

#WOO Rocket about to takeoff after Weeks of dipping!#WOO has been experiencing a downturn for a few weeks and is currently resting at a significant support level. Additionally, it has broken out of a long-term trendline and is now potentially anticipating a change in the trend direction.

WOOUSDTWOOUSDT is trading in symmetrical triangle pattern. The price is reacting well the support and resistance of triangle.
Currently the price is at the support of triangle where it is also forming a local support zone and seems like the price may break through the triangle.
If the breakout sustain to upside the optimum target could be 0.1800.

WOO Network (WOO) formed bullish Gartley for upto 12.50% pumpHi dear friends, hope you are well and welcome to the new update on WOO Network (WOO) with US Dollar pair.
Previously we caught almost 70% pump of WOO as below:
Now on a 4-hr time frame, WOO has formed a bullish Gartley move for the next pump.
Note: Above idea is for educational purpose only. It is advised to diversify and strictly follow the stop loss, and don't get stuck with trade.

WOOUSDT again trying go to upThe coin is located at the border of the ascending inclined support level, I expect a rebound of the lower border of the slope due to several factors: purchase volumes are visible in the area of our position set, liquidity is higher at the levels (0.16738, 0.17037, 0.17230)

WOO I think going to explode!BINANCE:WOOUSDT is a currency with a DEFi platform, which in the future will reach the price of up to 25$
I think this is the moment when we can buy it at such a low price!


WOO looks very good for broke resistance level A horizontal level has formed, there are 3 clear touches. The price is consolidating on increased volumes. Potentially, I expect a local preload near the level to confirm the breakdown scenario. I recommend entering with increased activity in the glass upon breaking the level.

Head and shoulders patternIn the 1-day time frame, we see a head and shoulder pattern, and we will have a high possibility of dumping according to the news

Woo dump#woo is rejected from red trendline. It will go down and hit green trendline. If price goes above the red trendline then Bearish Scenario will be invalid.

Symmetrical triangle on $WOO$WOO is getting ready! Beautiful symmetrical triangle pattern for DLY.
Let’s see how it goes for the next 2 weeks…

WOO back to 0.1The description of the WOO network project itself does not provide specific information about the reasons why the value of this native token could increase.

WOOUSDT wants the breakout?Falling Wedge Formation : The price of WOOUSDT is currently trading within a falling wedge pattern on the 4-hour timeframe. A falling wedge is a technical chart pattern characterized by converging trendlines that slope downward. This pattern often indicates a potential reversal from a downtrend to an uptrend.
Plancton's Rules Application: As per your analysis and Plancton's Rules, you're considering a new long position if the price successfully breaks out from the dynamic and static resistance levels. A long position involves buying the asset with the expectation that its price will rise, aligning with the anticipated bullish momentum indicated by the breakout attempt.
According to Plancton's strategy , we can set a nice order
–––––
Keep in mind.
🟣 Purple structure -> Monthly structure.
🔴 Red structure -> Weekly structure.
🔵 Blue structure -> Daily structure.
🟡 Yellow structure -> 4h structure.
⚫️ black structure -> <= 1h structure.
–––––
Follow the Shrimp 🦐

#WOOHey, this is just a technical view that bears the wrong and the right, so do not rely on it, but use it to help you make the decision, and also do not neglect the financial management, and do not forget to follow up on social media if you are interested in bitcoin

✴️ WOO Network 145% Potential Mapped With Full AnalysisWhile this isn't the best looking chart in the short-term, WOO Network is actually pretty strong.
Pause, join me and see what I see.
WOOUSDT D (Daily) TF
13-Aug. was full red for WOO, 14-Aug. was full green; full recovery of the previous day and a close daily above EMA10.
WOO Network hit a low in November 2022 together with Bitcoin and has been printing higher highs and higher lows since. While many Altcoins went on to hit new lows or lower lows in June and July, this isn't the case for this pair.
Here we can see how the support levels each time end up being higher and higher and this is the giveaway signal, a clear declaration of strength.
The first thing this tells us is that this pair is good for long-term hold. If it does not move lower when the time of correction comes, it means that it will hit new highs each time the time comes to move up.
The bullish cross is already visible on the MACD with green histogram.
✔️ I am seeing 0.47 as the target for this wave (145%) with a short/easy/fast stop at 0.30 for 60%, for those who don't want to wait.
We can say there are better charts but almost an entire year of higher lows? The initial wave earlier in 2023 went on for more than 240%, this one should also be good and 2024 massive.
Namaste.

WOO/USDT long Woo looks very good
This is a trade where we try to catch a dip ;-) with huge gain possibility.
Everything depends on Bitcoin.
Go long, set a stop loss, enjoy.

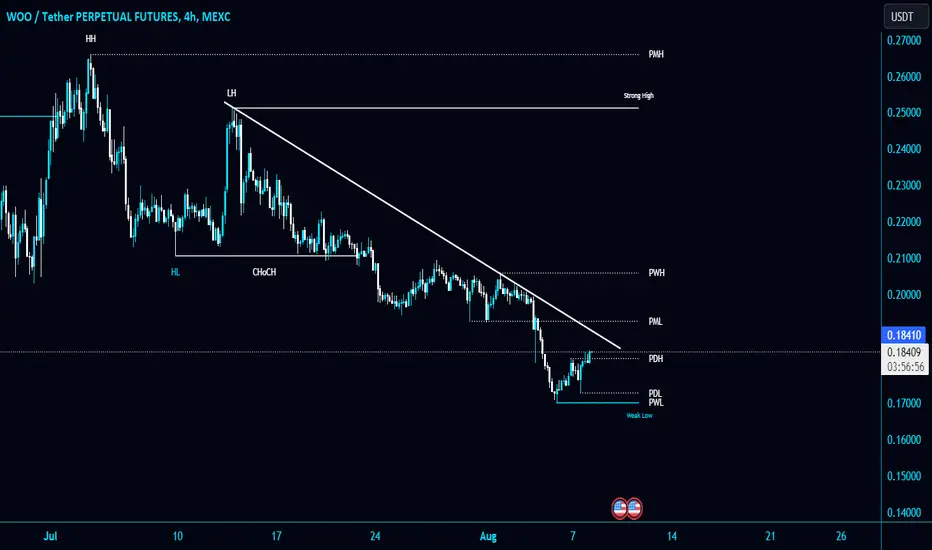
#WOO/USDT is heading towards a retest of the Diagonal Trendline #WOO/USDT is heading towards a retest of the Diagonal Trendline in 4-Hour TF!
FWB:WOO needs to break PML $0.1926 resistance. #WOOUSDT local support level is $0.1730.
WOOUSDT (1H) - Bullish reversalHi Traders
WOOUSDT (1H Timeframe)
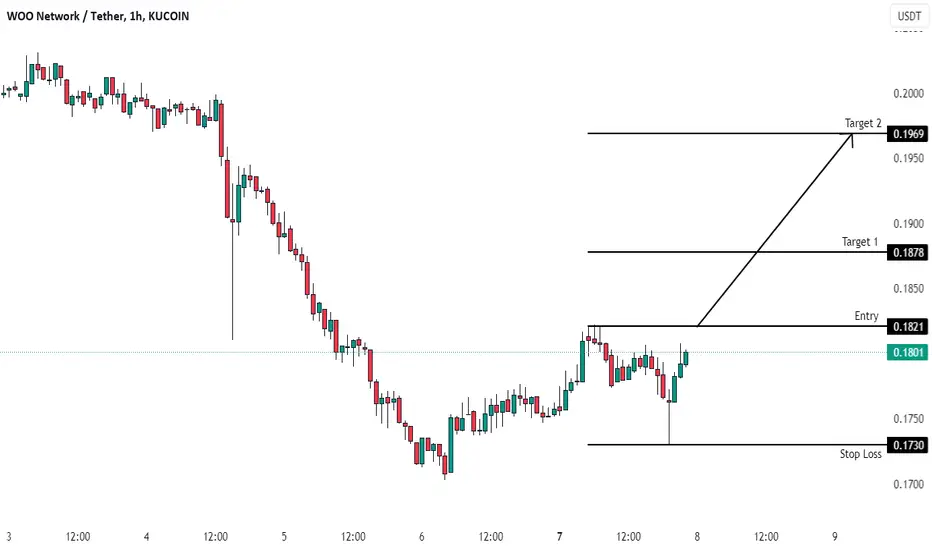
Waiting for the upward break of 0.1821 resistance level, which will complete a bullish trend reversal pattern to go LONG. Only the downward break of 0.1730 would cancel the bullish scenario.
Trade details
Entry: 0.1821
Stop loss: 0.1730
Take profit 1: 0.1878
Take profit 2: 0.1969
Score: 5
Strategy: Bullish reversal
Long Swing Trade: Woo/Usdt (Binance)The red box with range (0.167-0.16) is a good range to buy Woo for a potential Swing setup, with TPs mentioned. Let's get this bread

WHY WOO COIN PRICE DROP ? WOO COIN ANALYSIS AND TRADE SETUP !!WOO Coin Update & Possible Move !!
• On 4h tf Currently holding now its support . ( small bounce expected.
• MACD &RSI are Bearish on 4h, 1D &1W Chart.
• Personally i open trade in long with 1% on 0.18$ lets see what happen.
• If its break its 4h support then next stop is at 0.15$.
FOLLOW ME FOR MORE ANALYSIS
