WTCUSD trade ideas


WTCUSD - Ascending triangleLookslike we have got a bullish triangle. 26% profit. Let's see if it breaks upwards. =)
Just be carefull, BTC shows bearish short term pattern=)


WTCUSD on a retracement - watch for a bounceHi Traders
WTCUSD is might coming down to bounce off. The RSI Divergence as well as the MacD show a momentum change. It might bounce of the marked area or the resistance line a bit lower.

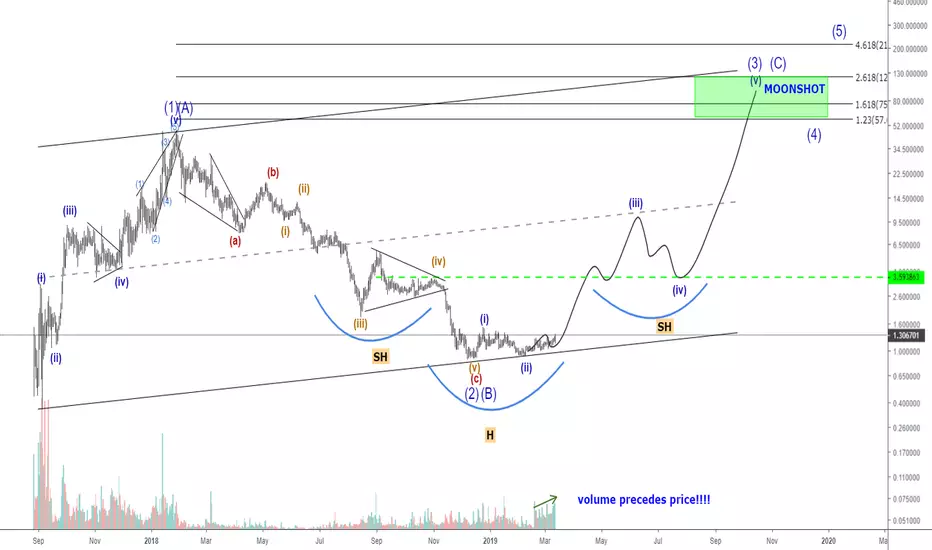
WTC Signs of life from bottom?I'm a novice and this is my first public chart ever. Pointers are appreciated. It looks like an ascending triangle with volume increasing. Close above $.80 for moon shot? Let me know what you think. Thanks.


There is a possibility for the beginning of an uptrend in WTCUSDTechnical analysis:
. Walton/US Dollar is in a range bound and the beginning of uptrend is expected.
.The price is below the 21-Day WEMA which acts as a dynamic resistance.
. The RSI is at 41.
Trading suggestion:
. There is a possibility of temporary retracement to suggested support zone (1.644 to 1.281). if so, traders can set orders based on Price Action and expect to reach short-term targets.
Beginning of entry zone (1.644)
Ending of entry zone (1.281)
Entry signal:
Signal to enter the market occurs when the price comes to "Buy zone" then forms one of the reversal patterns, whether "Bullish Engulfing" , "Hammer" or "Valley" in other words,
NO entry signal when the price comes to the zone BUT after any of the reversal patterns is formed in the zone.
To learn more about "Entry signal" and the special version of our "Price Action" strategy FOLLOW our lessons:
Take Profits:
TP1= @ 2.522
TP2= @ 3.315
TP3= @ 5.105
TP4= @ 6.34
TP5= @ 7.63
TP6= @ 10.05
TP7= @ 11.80
TP8= @ 18.58
TP9= Free


Waltonchain Price Analysis WTC / USD: Against The CurrentWaltonchain / USD Short-term price analysis
Waltonchain has a bullish short-term trading bias, with the WTC / USD pair still trading above major support on the four-hour time frame.
The four-hour time frame shows that the WTC / USD pair is attempting a bullish breakout from a neutral triangle pattern, following a failed downside attempt.
Technical indicators on the four-hour time frame currently have a slight bullish bias.
Pattern Watch
Traders should note that the current 2019 trading high will come into focus if the bullish triangle breakout on the four-hour time frame is successful.
The Relative Strength Index
The RSI indicator on the four-hour time frame is bullish and is starting to issue a buy signal.
MACD Indicator
The MACD indicator on the four-hour time frame is neutral and currently failing to generate a clear trading signal.
Waltonchain / USD Medium-term price analysis
Waltonchain has a bullish medium-term outlook and continues to trade well above its trend defining 200-day moving average.
The daily time frame shows that a broadening wedge pattern has formed, with the WTC / USD pair attempting to move back towards key trendline resistance.
Technical indicators on the daily time frame are bullish and continue to issue a buy signal.
WTC / USD Daily Chart by TradingView
Pattern Watch
Trades should note that broadening wedge patterns typically breakout in the direction of the overall trend.
Relative Strength Index
The RSI indicator on the daily time frame is bullish and is continuing to issue a medium-term buy signal.
MACD Indicator
The MACD indicator is bullish on the daily time frame and continues to generate a buy signal.
Conclusion
Waltonchain is attempting a bullish breakout on the four-hour time frame, following an impressive technical rebound from major trendline support.
The broadening wedge pattern on the daily time suggests that in-line with the prevailing bullish trend, a medium-term upside breakout appears the most likely scenario for the WTC / USD pair.

Waltonchain Turn Waltonchain Working to support on the long term trend line Its hard when Bitcoin so strong.

A trading opportunity to buy in WTCUSDTechnical analysis:
. Walton/Dollar is in a range bound and the beginning of uptrend is expected.
. The price is below the 21-Day WEMA which acts as a dynamic resistance.
. The RSI is at 46.
. While the RSI downtrend is not broken, bearish wave in price would continue.
Trading suggestion:
. There is a possibility of temporary retracement to suggested support zone (1.839400 to 1.383800). if so, traders can set orders based on Price Action and expect to reach short-term targets.
Beginning of entry zone (1.839400)
Ending of entry zone (1.383800)
Entry signal:
Signal to enter the market occurs when the price comes to " Buy zone " then forms one of the reversal patterns, whether " Bullish Engulfing ", " Hammer " or " Valley " in other words,
NO entry signal when the price comes to the zone BUT after any of the reversal patterns is formed in the zone.
To learn more about " Entry signal " and the special version of our " Price Action " strategy FOLLOW our lessons:
Take Profits:
TP1= @ 2.721600
TP2= @ 3.505300
TP3= @ 5.105280
TP4= @ 6.346210
TP5= @ 7.629800
TP6= @ 10.05280
TP7= @ 11.80870
TP8= @ 18.58420
TP9= @ 29.54300
TP10= Free

Walton [WTCBTC Binance] Might burst to 2x soonCup and handle on the WTCUSD and Descending Wedge on the WTCBTC and bullish divergence on the RSI.

There is a possibility for the beginning of an uptrend in WTCUSDTechnical analysis:
. Walton/Dollar is in a range bound and the beginning of uptrend is expected.
. The price is above the 21-Day WEMA which acts as a dynamic support.
. The RSI is at 56.
Trading suggestion:
. There is a possibility of temporary retracement to suggested support zone (1.839400 to 1.383800). if so, traders can set orders based on Price Action and expect to reach short-term targets.
Beginning of entry zone (1.839400)
Ending of entry zone (1.383800)
Entry signal:
Signal to enter the market occurs when the price comes to " Buy zone " then forms one of the reversal patterns, whether " Bullish Engulfing ", " Hammer " or " Valley " in other words,
NO entry signal when the price comes to the zone BUT after any of the reversal patterns is formed in the zone.
To learn more about " Entry signal " and the special version of our " Price Action " strategy FOLLOW our lessons:
Take Profits:
TP1= @ 2.721600
TP2= @ 3.505300
TP3= @ 5.105280
TP4= @ 6.346210
TP5= @ 7.629800
TP6= @ 10.05280
TP7= @ 11.80870
TP8= @ 18.58420
TP9= @ 29.54300
TP10= Free


WTC Challenging Upper RangeWaltonchain is a chart to watch over the next few days as we approach important resistance.
EMA's are acting as support on this uptrend and we've seen a bullish cross of the 12 and 26 day. Increasing volume. RSI is approaching oversold but if we pull back in the next couple of days before challenging that upper range resistance level it will likely bring it back under 70.
If that red resistance is broken there is a lot of room before hitting any areas of recent price action.
Certainly a coin I will be keeping an eye on over the next week or so.
There are a lot of alt coins with somewhat similar looking charts with many approaching upper range levels with a ton of room to fly. It pretty much comes down to what Btc does. If bitcoin can break that 4200ish level then we just may see a little alt season.
If Wtc fails to break resistance we can expect further consolidation. If btc drops we look at the bottom range level as support.