WaltonChain Breaking downtrendWTC has broken the downtrend line that has been pushing the price down for over a year
Volume is showing massive accumulation at current levels
Set up is very clear with stop loss and huge reward
You can also see my the WTCUSD chart i posted forthcoming this accumulation
Be safe
WTCUSD trade ideas


WTC- Potential bull breakWTC formed a nice inverse head & shoulders pattern with increasing buy volume.
Waiting for a neckline break to confirm.
Buy & sell positions in our crypto signal scanner (comment).

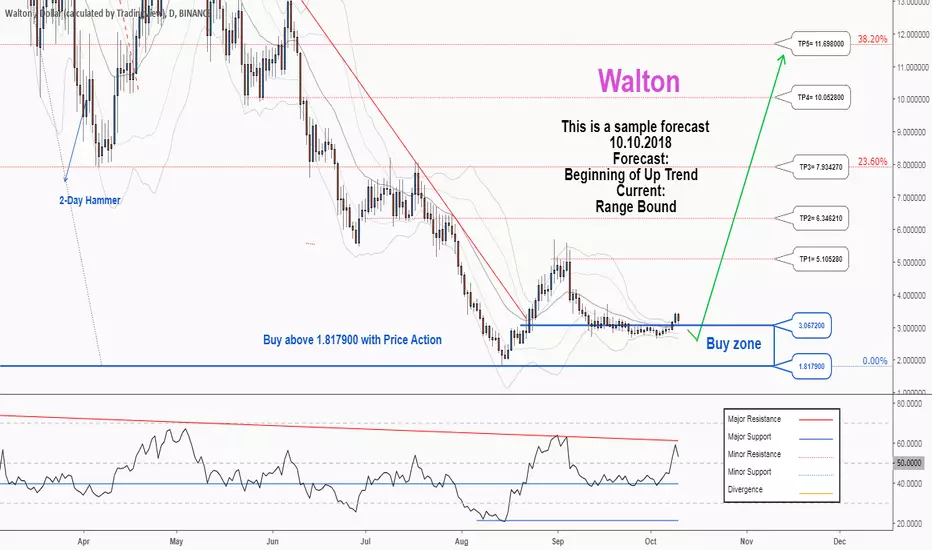
There is a possibility for the beginning of an uptrend in WTCUSDTechnical analysis:
. WALTON/DOLLAR is in a range bound and the beginning of uptrend is expected.
. The price is above the 21-Day WEMA which acts as a dynamic support.
. The RSI is at 54.
. The price downtrend in the daily chart is broken, so the probability of the resumption of an uptrend is increased.
Trading suggestion:
. There is a possibility of temporary retracement to suggested support zone (3.067200 to 1.817900). if so, traders can set orders based on Price Action and expect to reach short-term targets.
Beginning of entry zone (3.067200)
Ending of entry zone (1.817900)
Entry signal:
Signal to enter the market occurs when the price comes to " Buy zone " then forms one of the reversal patterns, whether " Bullish Engulfing ", " Hammer " or " Valley " in other words,
NO entry signal when the price comes to the zone BUT after any of the reversal patterns is formed in the zone.
To learn more about " Entry signal " and the special version of our " Price Action " strategy FOLLOW our lessons:
Take Profits:
TP1= @ 5.105280
TP2= @ 6.346210
TP3= @ 7.934270
TP4= @ 10.052800
TP5= @ 11.698000
TP6= @ 14.732200
TP7= @ 17.794500
TP8= @ 22.121000
TP9= @ 27.661900
TP10= @ 42.177100
TP11= Free


WaltonChain - A Perfect Buying opportunity?WaltonChain today has reached strong support at $4.7, which is confirmed by two Fibonacci retracement levels. First is the 38.2% Fibs applied to the uptrend trendline breakout point. Second is the 127.2% Fibs applied to the last corrective wave up.
The $4-$4.7 area could be the turning point for the WTC/USD, yet its too early to say that with confidence. Further decline is possible, and $4 psychological support can be reached, even spikes below can be produced.
But all-in-all it is an interesting long term buying opportunity for the WaltonChain, that might result in huge gains over time. The uptrend confirmation could be the break above the $8 resistance, that only if price won't break below the $4 support. In that case first upside target is seen at $30, and if broken, new all-time high should be expected.

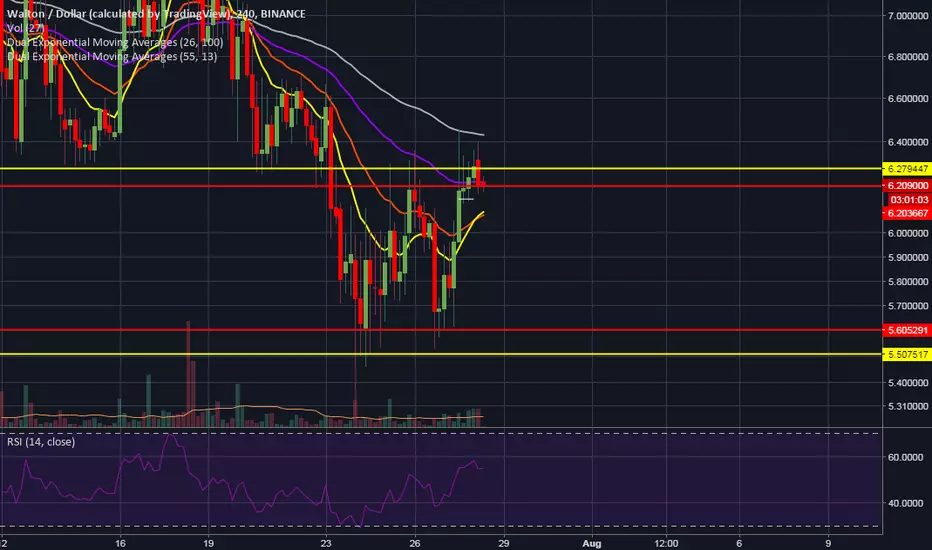
WTC (Waltonchain) breaks 4hr equilibriumWaltonchain broke the 4hr equilibrium and is now facing it's next resistance not much higher than that equilibrium at $6.35-6.40. A break in that resistance will result in a target in the high $7's along the trend line resistance visible on the daily time frame. The trend line and the daily chart resistance at $8.00 should be noted as strong resistance levels. Walton has appeared to double bottom at $5.50 and is gaining traction, this traction will be needed to break to higher highs and the optimism is increasing.
A trading opportunity to buy in WTCUSDTechnical analysis:
. WALTONCHAIN/DOLLAR is in a range bound and the resumption of uptrend is expected.
. The price is above the 21-Day WEMA which acts as a dynamic support.
. The RSI is at 49.
. The RSI downtrend & The price downtrend in the daily chart are broken, so the probability of the beginning of uptrend is increased.
Trading suggestion:
. We have already opened 11 BUY trade(s) @ 7.120839 based on 'a reversal candle (Valley)' entry method at 07.16.2018 in our suggested support zone (6.3864 to 4.4910).
Beginning of entry zone (6.3864)
Ending of entry zone (4.4910)
Entry signal:
Signal to enter the market occurs when the price comes to "Buy zone" then forms one of the reversal patterns, whether "Bullish Engulfing" , "Hammer" or "Valley" in other words,
NO entry signal when the price comes to the zone BUT after any of reversal patterns is formed in the zone.
To learn more about "Entry signal" and the special version of our "Price Action" strategy FOLLOW our lessons:
Take Profits:
TP1= @ 8.87
TP2= @ 10.17
TP3= @ 11.62
TP4= @ 13.25
TP5= @ 18.90
TP6= @ 23.86
TP7= @ 28.19
TP8= @ 34.35
TP9= @ 41.18
TP10= @ 46.60
TP11= Free

A trading opportunity to buy in WTCUSDTechnical analysis:
. WALTONCHAIN/DOLLAR is in a range bound and the resumption of uptrend is expected.
. The price is above the 21-Day WEMA which acts as a dynamic support.
. The RSI is at 49.
. The RSI downtrend is broken, so the probability of the beginning of uptrend is increased.
Trading suggestion:
. We have already opened 11 BUY trade(s) @ 7.120839 based on 'a reversal candle (Valley)' entry method at 07.16.2018 in our suggested support zone (6.3864 to 4.4910).
Beginning of entry zone (6.3864)
Ending of entry zone (4.4910)
Entry signal:
Signal to enter the market occurs when the price comes to "Buy zone" then forms one of the reversal patterns, whether "Bullish Engulfing" , "Hammer" or "Valley" in other words,
NO entry signal when the price comes to the zone BUT after any of reversal patterns is formed in the zone.
To learn more about "Entry signal" and the special version of our "Price Action" strategy FOLLOW our lessons:
Take Profits:
TP1= @ 8.87
TP2= @ 10.17
TP3= @ 11.62
TP4= @ 13.25
TP5= @ 18.90
TP6= @ 23.86
TP7= @ 28.19
TP8= @ 34.35
TP9= @ 41.18
TP10= @ 46.60
TP11= Free


WaltonChain Facing Support AreaWaltonChain continues to trade upwards while producing higher highs and higher lows. Now WTC/USD is going through a healthy correction down after hitting the high at $18.8. The current support can be seen around $14 area which previously has acted as a resistance. The support is confirmed by the upper trendline of the descending channel, 50 Moving Average as well as the 2/1 Gann Fan trendline.
From this area price could continue rising and could go as high as $45, forming a double top near the previous resistance formed back in January. At the same time $36 resistance, that is 76.4% Fibs, should be watched closely as only break above should push price higher.
On a downside, it is possible that WaltonChain will go lower and could hit the $10 psychological support before the uptrend continues, but only break and close below $10 should invalidate bullish outlook.

On its way to hit that lower support .. .. but is a great project ... so a bounce could be on the way.


Walton low probabilityWalton is showing a setup but low probability. I do like this story. Well worth following.

Walton , Don't miss the great opportunity to buy in WTCUSD !!Technical analysis:
WALTONCHAIN/DOLLAR is in a down trend and Beginning of up trend is expected.
The price is below the 21-Day WEMA which acts as a dynamic resistance.
The RSI is at 36.
Trading suggestion:
*The price is in a down trend, but we forecast the uptrend would begin.
*Price is in the Buy Zone (10.89 to 08.47), we would set orders based on Price Action and expect to reach short-term targets.
Beginning of entry zone (10.89)
Ending of entry zone (08.47)
Entry signal:
Signal to enter the market occurs when the price comes to "Buy zone" then forms one of the reversal patterns, whether "Hammer" or "Trough" , in other words,
NO entry signal when the price comes to the zone BUT after any of reversal patterns is formed in the zone.
To learn more about "Entry signal" and special version of our "Price Action" strategy FOLLOW our lessons:
(We have started to prepare these lessons in TradingView. If you want us to continue, give us feedbacks!)
Take Profits:
TP1= @ 15.00
TP2= @ 18.90
TP3= @ 25.24
TP4= @ 30.20
TP5= @ 46.60
TP6= Free

WTCUSD GOING TO $50It looks like WTC has completed its ONE and TWO and is now at the very start of a THREE going to at least just under $50
***WARNING***
I have no idea what I am doing, you would be stupid to follow my advice.

