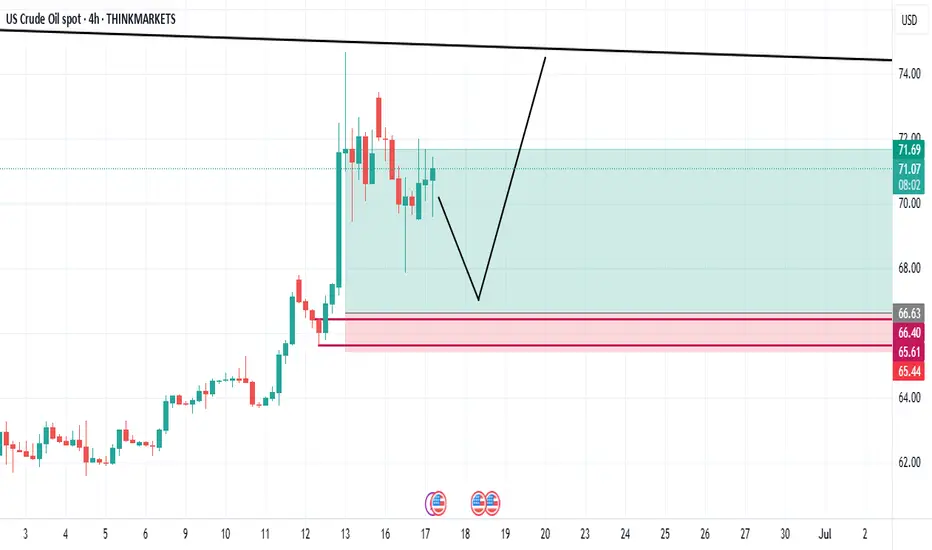
WTI US OIL 17 JUNE 2025 TRADE IDEAThe WTI Crude Oil (US Oil Spot) chart shows price action still trading within a long-term descending channel, bounded by dynamic resistance and support dating back to mid-2022. Currently, price has bounced strongly off the $67–$58 demand zone, rallying toward the descending trendline around $76–$78, which also aligns with key historical supply levels. This area poses a significant challenge for bulls and may trigger short-term rejection. However, the recent impulsive bullish leg suggests renewed demand, possibly driven by geopolitical uncertainty and speculation of potential supply disruption.
From a Smart Money Concept (SMC) perspective, WTI recently swept liquidity below the $58.69 low and formed a bullish Change of Character (ChoCH) as price broke through short-term structure levels. This confirms that smart money may have accumulated long positions in the discount zone. The rally targeting the $76.77–$78.30 range appears to be part of a mitigation move toward a supply zone, and traders may anticipate either a reversal or continuation depending on how price reacts near that level.
Macro & Geopolitical Context:
This bullish momentum in crude oil comes amid elevated tension between Iran and Israel, which historically injects volatility into energy markets. Any escalation could threaten oil production or export routes in the Middle East, particularly the Strait of Hormuz, through which a significant percentage of global oil supply flows. Such events can drive speculative and fundamental buying in oil, pushing prices higher in anticipation of reduced supply. However, oil traders must also remain aware of OPEC+ policy decisions and U.S. inventory data, which can quickly shift sentiment.
Trade Outlook:
Bias: Bullish until $76–$78 zone; watch for rejection or breakout.
Entry: Pullback entries between $70–$71 with bullish confirmation are ideal.
Stop Loss: Below $66 or invalidation at $64 (below structure support).
Take Profit: Conservative TP around $76.77; extended target at $78.30–$79.37.
Alternative View: Strong rejection at the descending trendline may result in a return to the $67 or even $58 support if risk-off sentiment declines or supply concerns ease.
In summary, oil is currently reacting to both technical and geopolitical catalysts. While the technical structure suggests a short- to medium-term bullish move toward the upper channel resistance, sustained upside will depend heavily on how the Iran–Israel conflict unfolds, and whether market participants anticipate further disruptions to global oil supply.
WTI trade ideas
WTI Technical Analysis – WTI (1H Chart)
Structure & Momentum:
WTI recently broke out of a short-term bullish structure, forming higher highs and higher lows.
However, momentum appears to be weakening, with divergence showing between price action and volume (or internal strength), hinting at a potential short-term pullback.
Liquidity & Reaccumulating:
There’s a visible liquidity pool resting below the recent swing lows, around the $62 level, which aligns with a bullish order block or prior consolidation zone on the 1H chart.
If price revisits this zone, it would likely be a liquidity grab followed by reaccumulating.
✅ Scenario Outlook:
"WTI might pull back to the $62 area to clear resting liquidity and mitigate previous demand imbalances. If the level holds with strong bullish intent, we can expect a continuation toward higher levels—targeting the $67–$70 range in the coming sessions."
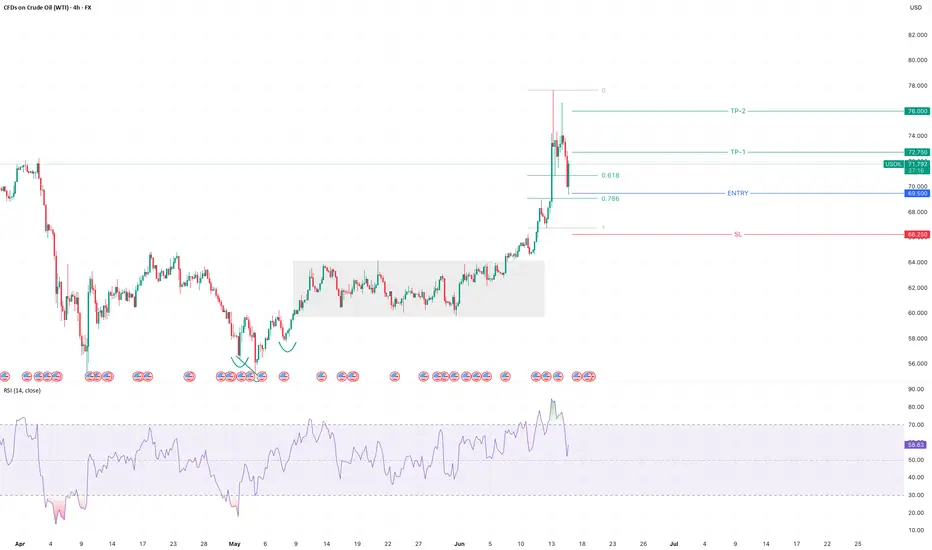
Trade Setup Concept (SMC-style):
Wait for price to sweep the $62 level.
Look for a shift in market structure (CHOCH) on lower timeframes from bearish to bullish.
Entry: Post-CHOCH confirmation above local high.
SL: Below liquidity sweep.
TP1: $66.80
TP2: $69.90
🛢️ Geopolitical Context:
If Iran retaliates directly or if Strait of Hormuz tensions rise, crude could spike suddenly.
But U.S. SPR releases or weak global demand data might offset rallies—watch macro data.

OIL VS GOLD : COMMODITIESHELLO THERE.
Fine ? Me no, i'm tired.
OIL VS GOLD
We have a historical canal and OIL is very out if this. Do you believe it's for IRAN ? No, it's not, OIL just take an excuse for up.
Gold will fall ? No but oil will up because all currencies are destroy. So oil have to go up.
Imagine the consequences for the inflation now, when OIL WILL reach the white line of stabilisation : x3 versus GOLD.
Low indicator show a reversal.
Buy some OIL COMPANIES.
GL

Crude oil bullish expectations4-hour cycle, interesting cup-handle pattern
Pay attention to the reversal signal of the 4-hour demand zone

US OIL SHORT RESULT Crude oil eventually broke out of the major 4HTF Bearish falling Trendline, Moving against our direction as I thought it might respect the Resistance Trendline and dump.
But apparently I entered too early and should've waited for reversal signs or fake outs.
And done better Technical Analysis and 4HTF Trend.

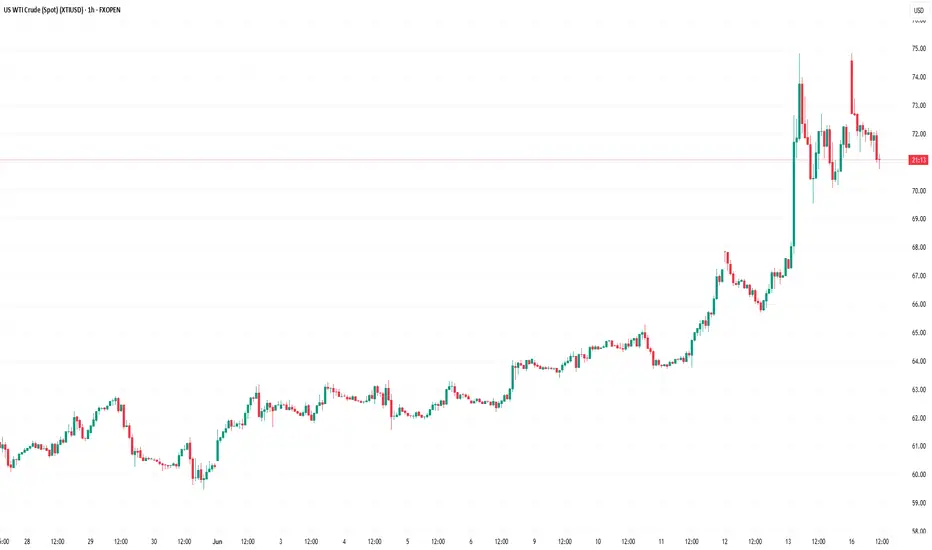
WTI rebounds from key support as Middle East tensions intensifyThe latest escalation in the conflict between Israel and Iran initially didn't cause much panic in the oil market. After spiking initially to an overnight high of $75.70, WTI has since been on a decline, before hitting a low so far of $68.50. That represents a 9.5% drop from the overnight high, which is massive. Investors have been pricing out the risk of of oil supplies being meaningfully impacted. But the latest air strikes on Tehran and Israel declaring that it had "full aerial operational control" over Tehran means tension are rising another bombardment of Tel Aviv was most likely on the agenda for Iran. Oil has been bouncing back as a result. So far, it hasn't impacted equities, with major US indices remaining near their session highs. But will that change if oil extends it recovery?
Key support at $68.60 has been defended as we can see on the hourly chart. $70.00/$70.10 is now reclaimed, which is a bullish sign. Resistance is seen around $72.20. Above that, $73.00 will be in focus.
By Fawad Razaqzada, market analyst with FOREX.com

USOIL - BullishUSOIL has retraced well in a bullish trend. Current war situation is also supporiting bullish bias fundamentally.
Crude oil continues to decline - latest market trend analysisThe international oil market is currently experiencing a classic upward cycle of "geopolitical risk premium". In the short term, oil prices will be highly sensitive to any news regarding the security of the Strait of Hormuz. Crude oil has continued its volatile upward trend in the short term, surging to test the price near $74. The moving average system is bullishly aligned with oil prices, and the objective short-term trend direction remains upward.
In early trading, oil prices hit a new high near $75.30, but then surged and fell, closing with a bearish real body K-line. The short-term momentum still favors the bulls, and it is expected that the intraday trend of crude oil will continue to maintain a high-level volatile upward rhythm.
you are currently struggling with losses,or are unsure which of the numerous trading strategies to follow,You have the option to join our VIP program. I will assist you and provide you with accurate trading signals, enabling you to navigate the financial markets with greater confidence and potentially achieve optimal trading results.
Trading Strategy:
buy@68.5.0-69.5
TP:73.0-74.0
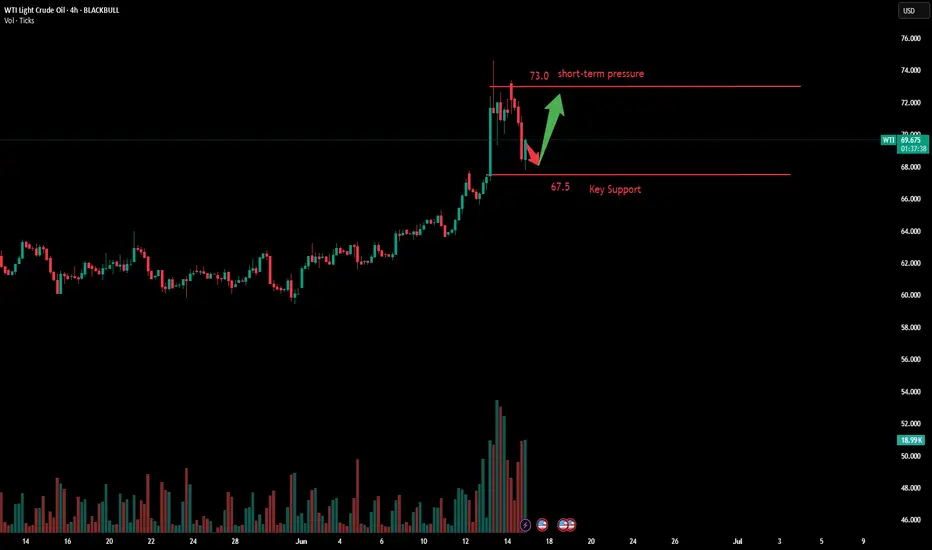
WTI - ANALYSIS BUY AREA This week the ongoing conflict seems to bring more uptrend to this commodity
I believe that the last broken resistance now turning support at 67.300 will be tested prior to the OIL raising again
If the conflict doesn’t end and we don’t have a ceasefire we could see this commodity running to the 78.000 and 82.000 levels

Crude Oil Challenges 2-Year ChannelAmid rising summer demand, an inverted head and shoulders breakout from oversold 2020 levels, and the recent outbreak of war between Israel and Iran, crude oil has tested the upper boundary of the declining channel originating from the 2022 highs. This test comes as supply risks for the coming month intensify.
This upper boundary aligns with the $77 resistance level. A confirmed breakout and sustained hold above this level could shift momentum more decisively to the bullish side, potentially paving the way for a retest of the $80 and $83.50 levels.
On the downside, if oil fails to maintain its gains and resumes a pullback, key support zones are located around $69, $66, and $64, reestablishing bearish dominance within the channel.
— Razan Hilal, CMT

USOIL:Go long
USOIL: Short-term momentum is still dominant, the trend of crude oil is expected to maintain a high shock upward rhythm.
Trading Strategy:
BUY@70.5-71
TP: 73-73.6
↓↓↓ More detailed strategies and trading will be notified here ↗↗↗
↓↓↓ Keep updated, come to "get" ↗↗↗

Oil (WTI) – Geo-Political Concerns Drive SentimentA quickly escalating conflict in the Middle East between Israel and Iran has seen Oil (WTI) volatility increase dramatically as the focus for traders has shifted overnight from worries about an on-going lack of demand due to a slowing global economy over to major supply concerns moving forward from this oil rich region.
This shift has seen Oil trade from lows of 60.17 on May 30th, to an early Monday high of 76.31, as weekend attacks by Israel on Iran's energy infrastructure introduced more uncertainty at the start of this new trading week regarding Israel's future strategy in this conflict. Prices have since settled down and moved back towards 72.80 (0830 BST) at time of writing but looking forward traders may need to balance the potential for further escalation/duration of this conflict against extra Oil production/supply from OPEC+ and the US.
Also important for Oil prices across the week could be the outcome of the Federal Reserve (Fed) Interest Rate Decision (Wed 1900 BST) and Press Conference (Wed 1930 BST). No change to interest rates is expected, but the updates from Fed policymakers to their inflation and interest rate expectations for the rest of 2025 could have a major impact on risk sentiment, the dollar and anticipated Oil demand.
Technical Update: Utilising Bollinger Bands
A rise in tensions in the Middle East last week prompted a sharp acceleration higher in the price of Oil. This saw price volatility increase, reflected by the widening upper and lower Bollinger bands and prices trading to levels last seen in late January 2025, as the chart below shows.
Traders will now likely be wondering if this type of price strength can continue, or if prices can enter a correction phase, even possibly a more extended period of price weakness.
Much will clearly depend on future market sentiment and price trends, and on any easing or escalation in geo-political tensions. However, with this in mind let's consider what may be the relevant support and resistance levels .
Potential Resistance Levels:
As the chart shows below, interestingly, last weeks price strength stalled against 75.99, which is equal to the February 3rd session high and with a setback in price developing from it so far today, this might be viewed by some as a potential first resistance.
As such, while not a guarantee of further price strength, closing breaks above 75.99 may be a sign of continued upside momentum towards 81.01, which is the January 15th price high and a potential next resistance focus for traders.
Potential Support Levels:
After such a strong advance in price, it might be harder to establish support levels, although, Fibonacci retracement levels on the recent May 30th to June 16th upside move in price, might prove useful. These retracement levels are highlighted on the chart below.
The 38.2% Fibonacci retracement of the price strength stands at 70.12 and this might prove to be a possible first support focus, if price weakness is seen over coming days. Closing breaks below 70.12, if seen, may then lead to declines towards 66.32, the deeper 61.8% Fibonacci retracement level.
The material provided here has not been prepared
accordance with legal requirements designed to promote the independence of investment research and as such is considered to be a marketing communication. Whilst it is not subject to any prohibition on dealing ahead of the dissemination of investment research, we will not seek to take any advantage before providing it to our clients.
Pepperstone doesn’t represent that the material provided here is accurate, current or complete, and therefore shouldn’t be relied upon as such. The information, whether from a third party or not, isn’t to be considered as a recommendation; or an offer to buy or sell; or the solicitation of an offer to buy or sell any security, financial product or instrument; or to participate in any particular trading strategy. It does not take into account readers’ financial situation or investment objectives. We advise any readers of this content to seek their own advice. Without the approval of Pepperstone, reproduction or redistribution of this information isn’t permitted.

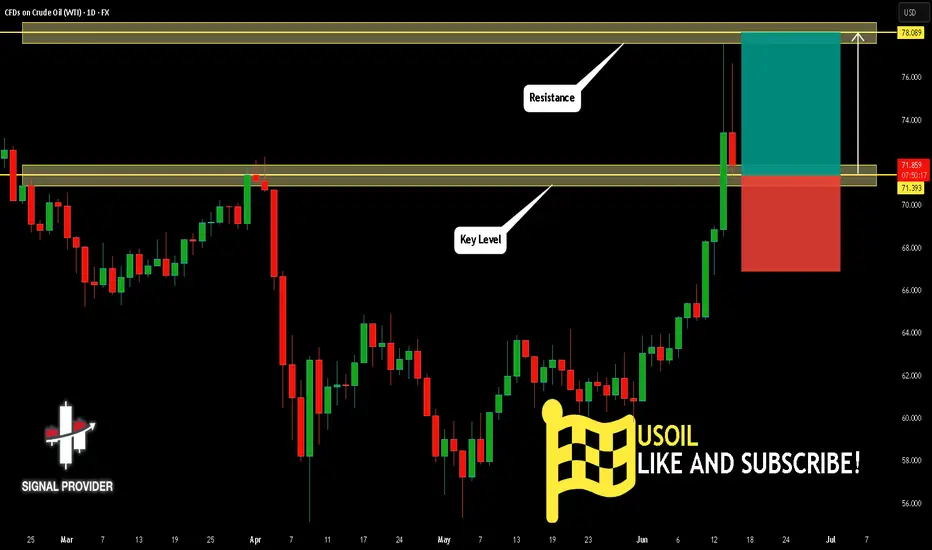
USOIL Will Move Higher! Buy!
Please, check our technical outlook for USOIL.
Time Frame: 1D
Current Trend: Bullish
Sentiment: Oversold (based on 7-period RSI)
Forecast: Bullish
The price is testing a key support 71.393.
Current market trend & oversold RSI makes me think that buyers will push the price. I will anticipate a bullish movement at least to 78.089 level.
P.S
Overbought describes a period of time where there has been a significant and consistent upward move in price over a period of time without much pullback.
Disclosure: I am part of Trade Nation's Influencer program and receive a monthly fee for using their TradingView charts in my analysis.
Like and subscribe and comment my ideas if you enjoy them!
Crude oil bottom?Crude oil was in big trouble back in April, just 2 months ago.
And just like that, the quarterly chart does its magic and reduced so much noise!
What looked like a critical breakdown, has now reversed, leaving an impressive lower wick on the candle!

USOIL Will Go Higher From Support! Buy!
Take a look at our analysis for USOIL.
Time Frame: 2h
Current Trend: Bullish
Sentiment: Oversold (based on 7-period RSI)
Forecast: Bullish
The market is testing a major horizontal structure 67.337.
Taking into consideration the structure & trend analysis, I believe that the market will reach 69.433 level soon.
P.S
The term oversold refers to a condition where an asset has traded lower in price and has the potential for a price bounce.
Overbought refers to market scenarios where the instrument is traded considerably higher than its fair value. Overvaluation is caused by market sentiments when there is positive news.
Disclosure: I am part of Trade Nation's Influencer program and receive a monthly fee for using their TradingView charts in my analysis.
Like and subscribe and comment my ideas if you enjoy them!

WTI Crude Oil Regains Bullish MomentumWTI Crude Oil Regains Bullish Momentum
WTI Crude oil prices climbed higher above $70.00 and might extend gains.
Important Takeaways for WTI Crude Oil Price Analysis Today
- WTI Crude oil prices started a decent increase above the $65.00 and $68.50 resistance levels.
- There is a major bullish trend line forming with support at $71.50 on the hourly chart of XTI/USD at FXOpen.
Oil Price Technical Analysis
On the hourly chart of WTI Crude Oil at FXOpen, the price started a decent upward move from $65.00 against the US Dollar. The price gained bullish momentum after it broke the $68.50 resistance and the 50-hour simple moving average.
The bulls pushed the price above the $69.50 and $71.50 resistance levels. The recent high was formed at $74.80 and the price started a downside correction. There was a minor move below the 50% Fib retracement level of the upward move from the $69.55 swing low to the $74.83 high.
The RSI is now below the 60 level. Immediate support on the downside is near the $71.50 zone. There is also a major bullish trend line forming with support at $71.50 and the 61.8% Fib retracement level of the upward move from the $69.55 swing low to the $74.83 high.
The next major support on the WTI crude oil chart is near the $69.50 zone, below which the price could test the $67.90 level. If there is a downside break, the price might decline toward $65.20. Any more losses may perhaps open the doors for a move toward the $63.75 support zone.
If the price climbs higher again, it could face resistance near $72.50. The next major resistance is near the $74.80 level. Any more gains might send the price toward the $78.50 level.
This article represents the opinion of the Companies operating under the FXOpen brand only. It is not to be construed as an offer, solicitation, or recommendation with respect to products and services provided by the Companies operating under the FXOpen brand, nor is it to be considered financial advice.
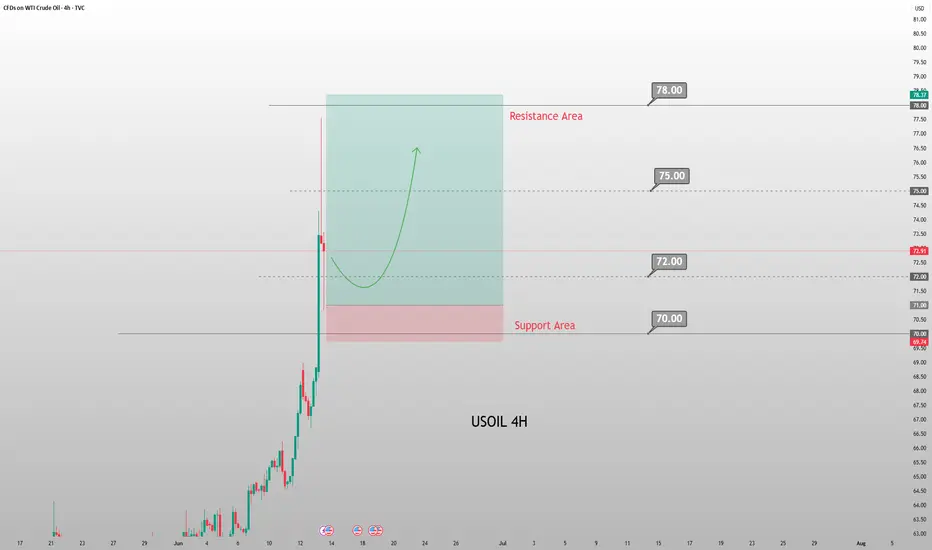
Today's Crude Oil Trend Analysis and Trading RecommendationsFrom a daily chart perspective, the violent rally in USOIL driven by external factors has completely disrupted prior technical expectations. The sharp surge has also significantly exhausted future upside potential, explaining today's gap-up and subsequent decline. With minimal likelihood of near-term de-escalation in the Iran situation, USOIL is likely to remain bullish. However, severe overbought conditions on technical charts have disrupted structural expectations, necessitating a price correction.
Technically, the $70-$75 range serves as a reasonable short-term consolidation zone, contingent on no severe escalation in Iran tensions. Given the high probability of worsening tensions, USOIL may retest $75 and even challenge $80 driven by geopolitical developments.
Thus, while the market remains focused on Iran-related risks, the short-term bias remains bullish. Avoid chasing the rally recklessly. Focus on the $70.5-$71.5 pullback zone early in the week—consider long entries only after price consolidation in this area.
USOIL
buy@70.50-71.50
tp:74-76-78
Investment itself is not the source of risk; it is only when investment behavior escapes rational control that risks lie in wait. In the trading process, always bear in mind that restraining impulsiveness is the primary criterion for success. I share trading signals daily, and all signals have been accurate without error for a full month. Regardless of your past profits or losses, with my assistance, you have the hope to achieve a breakthrough in your investment.

Crude oil is the ultimate winner
💡Message Strategy
Currently trading around $70.00 a barrel during Friday's European session, crude oil prices surged on growing concerns about supply disruptions. Rising tensions in the Middle East threaten navigation through the Strait of Hormuz, a key passage for about 20% of global oil shipments.
📊Technical aspects
From the daily chart level, crude oil prices in the medium term broke through the upper resistance of the range and tested a new high of 75.50. The moving average system is in a bullish arrangement, and the medium-term objective trend is upward.
The current trend is in the upward rhythm of the main trend. The MACD indicator fast and slow lines overlap with the bullish column above the zero axis, indicating that the bullish momentum is currently full, and it is expected that the medium-term trend is expected to usher in a wave of rising rhythm.
The short-term (1H) trend of crude oil continued to fluctuate upward, and the price near 74 was tested. The moving average system relies on the bullish arrangement of oil prices, and the short-term objective trend direction remains upward. Oil prices hit a new high near 75.30, and then fell back and closed with a negative real candlestick. The short-term momentum is still bullish, and it is expected that the trend of crude oil will continue to maintain a high-level oscillation upward rhythm.
💰 Strategy Package
Long Position:70.09-71.50

WTI Oil H1 | Potential bullish bounceWTI oil (USOIL) is falling towards a multi-swing-low support and could potentially bounce off this level to climb higher.
Buy entry is at 71.83 which is a multi-swing-low support.
Stop loss is at 68.50 which is a level that lies underneath a pullback support and the 50% Fibonacci retracement.
Take profit is at 77.60 which is a swing-high resistance.
High Risk Investment Warning
Trading Forex/CFDs on margin carries a high level of risk and may not be suitable for all investors. Leverage can work against you.
Stratos Markets Limited (tradu.com ):
CFDs are complex instruments and come with a high risk of losing money rapidly due to leverage. 63% of retail investor accounts lose money when trading CFDs with this provider. You should consider whether you understand how CFDs work and whether you can afford to take the high risk of losing your money.
Stratos Europe Ltd (tradu.com ):
CFDs are complex instruments and come with a high risk of losing money rapidly due to leverage. 63% of retail investor accounts lose money when trading CFDs with this provider. You should consider whether you understand how CFDs work and whether you can afford to take the high risk of losing your money.
Stratos Global LLC (tradu.com ):
Losses can exceed deposits.
Please be advised that the information presented on TradingView is provided to Tradu (‘Company’, ‘we’) by a third-party provider (‘TFA Global Pte Ltd’). Please be reminded that you are solely responsible for the trading decisions on your account. There is a very high degree of risk involved in trading. Any information and/or content is intended entirely for research, educational and informational purposes only and does not constitute investment or consultation advice or investment strategy. The information is not tailored to the investment needs of any specific person and therefore does not involve a consideration of any of the investment objectives, financial situation or needs of any viewer that may receive it. Kindly also note that past performance is not a reliable indicator of future results. Actual results may differ materially from those anticipated in forward-looking or past performance statements. We assume no liability as to the accuracy or completeness of any of the information and/or content provided herein and the Company cannot be held responsible for any omission, mistake nor for any loss or damage including without limitation to any loss of profit which may arise from reliance on any information supplied by TFA Global Pte Ltd.
The speaker(s) is neither an employee, agent nor representative of Tradu and is therefore acting independently. The opinions given are their own, constitute general market commentary, and do not constitute the opinion or advice of Tradu or any form of personal or investment advice. Tradu neither endorses nor guarantees offerings of third-party speakers, nor is Tradu responsible for the content, veracity or opinions of third-party speakers, presenters or participants.

POSSIBLE BUY OPPORTUNITY ON OILOIL has been strongly bullish lately. We see a nice area of demand converging on a support line. We aim to take a buy at this point!

Next Week's Crude Oil Trend Analysis and Trading RecommendationsThe continued escalation of geopolitical tensions in the Middle East remains the core driver propelling oil prices higher. With U.S.-Iran relations at a critical juncture and the Ukrainian attack on the Crimean Bridge exacerbating the Russia-Ukraine conflict, markets are increasingly concerned about potential disruptions to Black Sea crude exports. As a key channel for 2% of global crude oil supplies, risks to Black Sea exports directly threaten supply chain security, triggering a surge in short-term market risk aversion and driving oil prices sustainably higher.
Since crude oil broke through the $64.8 resistance level with a solid candlestick last week, we have maintained a consistent bullish stance. After two weeks of consolidative oscillations, prices finally broke free from the trading range, fully demonstrating the dominance of bullish momentum. When oil prices pulled back to the $71.5–$72.0 range last Friday, we once again emphasized the short-term long strategy, which was subsequently followed by a sharp rally catalyzed by news developments. With the current trend clearly defined, we advise trading in line with the momentum: short-term long positions can be initiated above $71.0 at the start of the week.
USOIL
buy@71-72
tp:75-78
Investment itself is not the source of risk; it is only when investment behavior escapes rational control that risks lie in wait. In the trading process, always bear in mind that restraining impulsiveness is the primary criterion for success. I share trading signals daily, and all signals have been accurate without error for a full month. Regardless of your past profits or losses, with my assistance, you have the hope to achieve a breakthrough in your investment.
USOIL Remains Bullish Amid Geopolitical Tensions and Steady Fed USOIL – Bullish Outlook Amid Geopolitical and Policy Factors
The ongoing escalation in the Middle East, combined with Jerome Powell's stance on holding interest rates steady, continues to support bullish momentum across commodities, including oil.
Technical Outlook:
USOIL remains bullish as long as it trades above 72.72 and more firmly above 70.40, with upside potential toward 77.30 and 79.50. If bullish momentum persists, a further extension to 84.14 is possible, supported by geopolitical risks.
A bearish shift is only likely if significant de-escalation or negotiations between Israel and Iran take place.
Key Levels:
• Pivot Point: 72.90
• Resistance: 77.29, 79.50, 84.10
• Support: 66.87, 63.52, 59.00
Trend Outlook:
Bullish while price holds above 68.53

WTI OIL SPOT / Crude Oil SpotCrude has appreciated from 55 odd levels to 73+
In the wake of Iran israel conflict...
Crude is likely to surge higher...
Above 94$ Crude cruising to 102/104 levels in all likelihood.
Have marked important levels on chart for ur perusal
Happy trading
Like...... Share........ and Follow for more updates...
