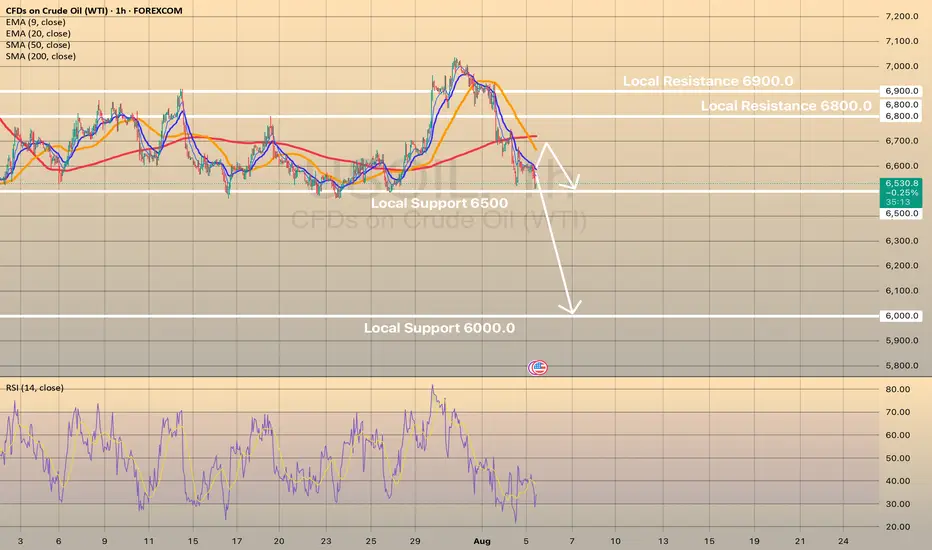
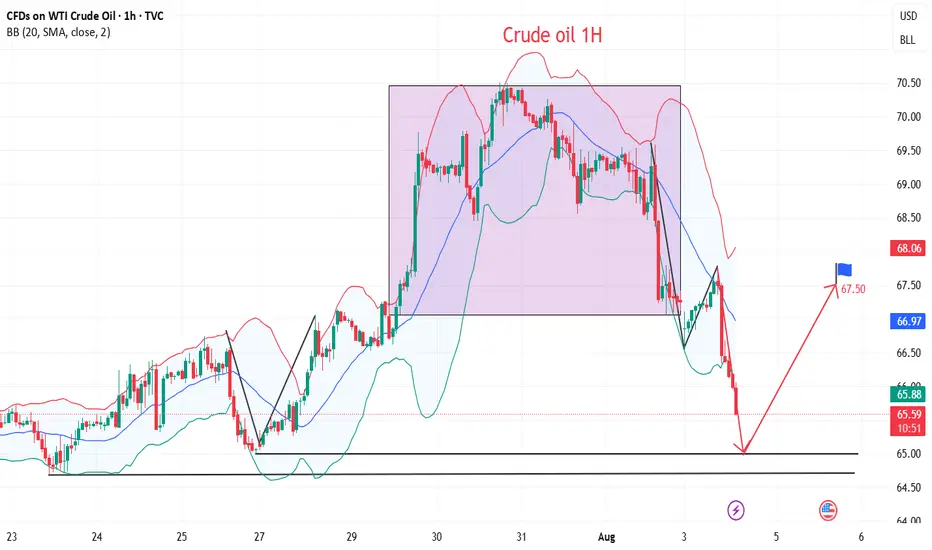
Oil at Key Support – Bounce or Breakdown?Crude oil is trading around $66.94, showing a bearish correction after failing to hold above $69.05. The chart shows price respecting an ascending channel but currently testing its lower boundary. The recent drop signals weakening bullish momentum, and a confirmed break below the channel could accelerate selling pressure toward lower levels.
📈 Potential Scenarios
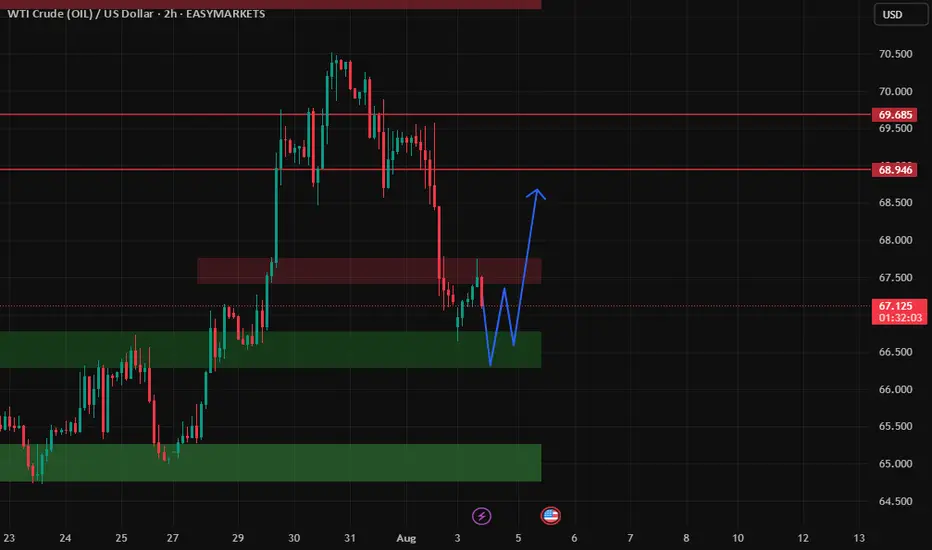
- Bullish Rebound: If price holds above the channel support (~$66.00–$66.50) and breaks back above $69.05, it may target $71.03 and possibly $72.00.
- Bearish Breakdown: A confirmed close below $66.00 can accelerate the downside toward $65.00, with extended targets near $63.50–$62.00.
📊 Key Technical Highlights
- Price rejected from the channel top and is now testing lower support.
- Key resistance zones: $69.05 (immediate), $71.03 (major).
- Key support zones: $66.00 (channel), then $65.00–$63.50 (breakdown targets).
- Momentum indicators show weakening buying pressure, favoring cautious trading.
🔑 Key Levels to Watch
- Resistance: $69.05 → $71.03 → $72.00
- Support: $66.00 → $65.00 → $63.50
🧭 Trend Outlook
- A short-term relief bounce is possible, but failure to reclaim $69.05 keeps sellers in control.
- Breaking below the channel would shift the overall outlook to bearish for August.
Note
Please risk management in trading is a Key so use your money accordingly. If you like the idea then please like and boost. Thank you and Good Luck!
WTI trade ideas
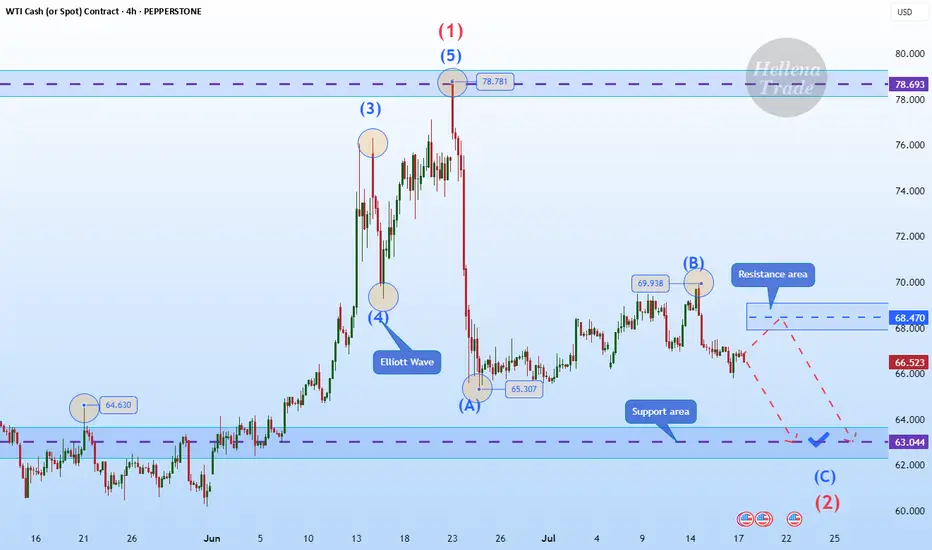
Hellena | Oil (4H): SHORT to support area of 63.000.Colleagues, I believe that wave “B” has formed at the level of 69.938, and now we expect the downward movement to continue with the aim of completing wave ‘C’ of the middle order and wave “2” of the higher order in the support area of 63,000.
It is quite possible that the price could reach the 60,000 level, but I think that for now it is worth focusing on the nearest targets.
Manage your capital correctly and competently! Only enter trades based on reliable patterns!
Long price is coming back to retest an area of support which has been respected for over a month I expect price to reject from support level
USOIL BULLISH BIAS RIGHT NOW| LONG
USOIL SIGNAL
Trade Direction: long
Entry Level: 66.22
Target Level: 69.94
Stop Loss: 63.73
RISK PROFILE
Risk level: medium
Suggested risk: 1%
Timeframe: 9h
Disclosure: I am part of Trade Nation's Influencer program and receive a monthly fee for using their TradingView charts in my analysis.
✅LIKE AND COMMENT MY IDEAS✅

WTI: Oil Markets on Edge Despite Trump Considering Major TariffsOil prices could drop if Trump backs down on tariffs on countries buying Russian oil, but short-term bullish catalysts, like geopolitical tensions and bullish speculative bets, may still push prices up before longer-term headwinds take hold.
----------------------------------------------------------------------------------------------------------------------
Trump’s threats of steep tariffs on countries buying Russian oil have sent oil prices surging, as traders fear a global supply crunch if Russian barrels are cut off.
But here’s the twist: Trump has a history of backing down or delaying tariffs after using them as leverage. When he does, oil prices usually fall, as the immediate risk of supply disruption fades.
If he caves in again by the deadline, which is 10 to 12 days from 4 August, or extends it, oil prices could drop. The bigger picture also appears bearish: OPEC+ is ramping up supply, global demand is slowing and expected to drop in H2, and inventories are rising (first glimpse by EIA, Wed).
But with the deadline falling around 14–16 August, 2025, short-term bullish catalysts could spark a rally up to the 38.2%-61.8 % Fibonacci retracement levels, positioning WTI better for declines (conditional on Trump!).
This content is not directed to residents of the EU or UK. Any opinions, news, research, analyses, prices or other information contained on this website is provided as general market commentary and does not constitute investment advice. ThinkMarkets will not accept liability for any loss or damage including, without limitation, to any loss of profit which may arise directly or indirectly from use of or reliance on such information.

BUY USOILI'm sharing with you our 2nd trade for the day which is agail on USOIL, you can see that the price came to grab the 1H LQ, then we got us a reversal we just took.
Follow for more!

USOIL WTIWest Texas Intermediate (WTI) oil is a major benchmark for crude oil pricing, known for its high quality—being both light and sweet due to its low sulfur content and low density. WTI is sourced primarily from inland Texas and is the underlying commodity for oil futures traded on the New York Mercantile Exchange (NYMEX). The main physical delivery point is Cushing, Oklahoma, a critical U.S. oil storage and trading hub.
Current Price (as of August 1, 2025)
WTI crude oil is trading around $69.15–$69.36 per barrel.
Recently, WTI prices have seen volatility due to global economic factors, including U.S. tariffs, OPEC+ production, and shifts in oil demand. Despite a small decline on the day, oil prices have posted their strongest weekly performance since June, rising over 6% for the week.
Market and Outlook
Recent price movement reflects concerns about global trade tensions, new tariffs, and their impact on economic growth and energy demand. At the same time, supply risks remain due to geopolitical factors such as potential sanctions on Russian oil and U.S.-China trade developments.
Analyst forecasts for the remainder of 2025 suggest continued volatility, with WTI potentially ranging between $56 and $73 per barrel, influenced by demand, OPEC+ decisions, and geopolitical events.
Quick Facts Table
Feature Detail
Type Light, sweet crude
Benchmark NYMEX (U.S.), major global reference
Main Delivery Point Cushing, Oklahoma
Latest Price (Aug 1, 2025) $69.15–$69.36 per barrel
Typical Drivers U.S. tariffs, OPEC+ decisions, trade policy, supply risks, global demand
WTI oil plays a central role in global energy markets, serving as a benchmark for North American and international oil pricing. Its price reflects both supply fundamentals and broader macroeconomic and geopolitical developments.
#OIL #WTI

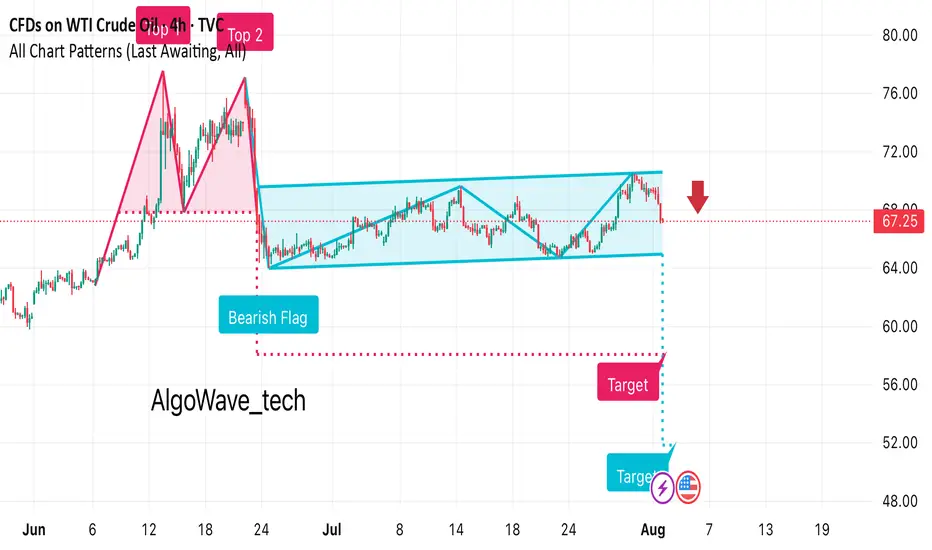
It looks like this chart for WTI Crude Oil is showing a bearish • Previous Move: There’s a strong downward leg before the flag formation, indicating bearish momentum.
• Flag Pattern: Price consolidates in an upward-sloping channel after the drop.
• Breakout: The chart suggests a bearish breakout below the channel, marked with a red arrow at around $67.25.
• Target Projection: The measured move target appears to be around the $53–54 range, based on the flagpole height.
WTI watch $70.34-70.43: Resistance zone that may STOP the surgeUSOIL spiked on Trump/Russia/Iran tariff threats.
Just hit a significant resistance at $70.34-70.43
Look for a Dip-to-Fib or Break-n-Retest for longs.

WTI OIL The federal funds rate is the interest rate at which U.S. banks and credit unions lend their excess reserve balances to other banks overnight, usually on an uncollateralized basis. This rate is set as a target range by the Federal Open Market Committee (FOMC), which is the policymaking arm of the Federal Reserve. The current target range as of July 2025 is approximately 4.25% to 4.5%.
The federal funds rate is a key benchmark that influences broader interest rates across the economy, including loans, credit cards, and mortgages. When the Fed changes this rate, it indirectly affects borrowing costs for consumers and businesses. For example, increasing the rate makes borrowing more expensive and tends to slow down economic activity to control inflation, while lowering the rate stimulates growth by making credit cheaper.
The Fed adjusts this rate based on economic conditions aiming to maintain stable prices and maximum employment. It is a vital tool of U.S. monetary policy, impacting economic growth, inflation, and financial markets.
In summary:
It is the overnight lending rate between banks for reserve balances.
It is set as a target range by the Federal Reserve's FOMC.
It influences many other interest rates in the economy.
Current range (July 2025) is about 4.25% to 4.5%.
1. ADP Non-Farm Employment Change (Forecast: +82K, Previous: -33K)
Above Forecast:
If ADP employment is much stronger than expected, the Fed would see this as a sign of ongoing labor market resilience. Robust job growth would support consumer spending, potentially keep wage pressures elevated, and could make the Fed less likely to ease policy soon. This reinforces the case for holding rates steady or staying data-dependent on further cuts.
Below Forecast or Negative:
If ADP jobs gain falls short or is negative again, the Fed may interpret it as a weakening labor market, raising recession risk and reducing inflationary wage pressures. This outcome could increase the chances of a future rate cut or prompt a more dovish tone, provided it aligns with other softening indicators.
2. Advance GDP q/q (Forecast: +2.4%, Previous: -0.5%)
Above Forecast:
A GDP print above 2.4% signals surprisingly strong economic growth and likely sustains the Fed’s view that the U.S. economy is avoiding recession. The Fed may delay rate cuts or take a more cautious approach, as stronger growth can support higher inflation or at least reduce the urgency for support.
Below Forecast or Negative:
Weak GDP—especially if close to zero or negative—would signal that the economy remains at risk of stagnation or recession. The Fed may then pivot to a more dovish stance, become more willing to cut rates, or accelerate discussions on easing to avoid a downturn.
3. Advance GDP Price Index q/q (Forecast: 2.3%, Previous: 3.8%)
Above Forecast:
A significantly higher-than-expected GDP Price Index (an inflation measure) points to persistent or resurgent inflationary pressures in the economy. The Fed might see this as a reason to delay cuts or maintain restrictive rates for longer.
Below Forecast:
If the Price Index prints well below 2.3%, it suggests that inflation is cooling faster than anticipated. This outcome could allow the Fed to move toward easing policy if other conditions warrant, as price stability is more clearly in hand.
Bottom Line Table: Data Surprises and Likely Fed Reaction
Data Surprise Fed Outlook/Action
All above forecast Hawkish bias, rate cuts delayed or on hold
All below forecast Dovish bias, higher chances of rate cut
Mixed Data-dependent, further confirmation needed
Summary:
The Fed’s interpretation hinges on how these figures compare to forecasts and to each other. Stronger growth, jobs, and inflation = less rush to cut; weaker numbers = lower rates sooner. If growth or jobs are especially weak or inflation falls sharply, expect more dovish Fed commentary and a greater likelihood of future easing. Conversely, if the data all surprise to the upside, hawkish (rate-hold) messaging is likely to persist.
The U.S. Dollar Index (DXY) is a financial benchmark that measures the value of the United States dollar relative to a basket of six major foreign currencies. It provides a weighted average reflecting the dollar's strength or weakness against these currencies. The DXY is widely used by traders, investors, and economists to gauge the overall performance and health of the U.S. dollar on the global stage.
Key Features of the DXY:
Currencies included and their weights:
Euro (EUR) – 57.6%
Japanese Yen (JPY) – 13.6%
British Pound (GBP) – 11.9%
Canadian Dollar (CAD) – 9.1%
Swedish Krona (SEK) – 4.2%
Swiss Franc (CHF) – 3.6%
It was established in 1973 after the collapse of the Bretton Woods system to serve as a dynamic measure of the dollar's value.
The index reflects changes in the exchange rates of theses versus the U.S. dollar, with a higher DXY indicating a stronger dollar.
The DXY influences global trade dynamics, commodity prices (like oil and gold)
#SHAVYFXHUB #USOIL #WTI #OIL
USOIL drops on rising supply and demand concernsUSOIL drops on rising supply and demand concerns
Oil prices fell Tuesday as OPEC+ planned a 547,000 bpd output increase for September, overshadowing potential Russian oil supply constraints from U.S. policies. Brent and WTI crude dropped to their lowest in a week, marking a fourth consecutive decline. OPEC+’s reversal of 2.5 million bpd cuts, combined with weak demand outlooks due to U.S. recession risks and China’s lack of new stimulus, pressured prices. Trump’s threatened 100% tariffs on Russian crude buyers like India, which imports 1.75 million bpd, heightened trade tensions but failed to lift oil prices. Analysts warn U.S. tariffs could further weaken global growth and fuel demand.
USOIL shows some in-moment strength on RSI on 1-h chart, the price may rebound towards sma200 at 6,700.00. However, in long-term perspective, low oil price is expected. Eventually, the price may decline towards level of 6,000.00.
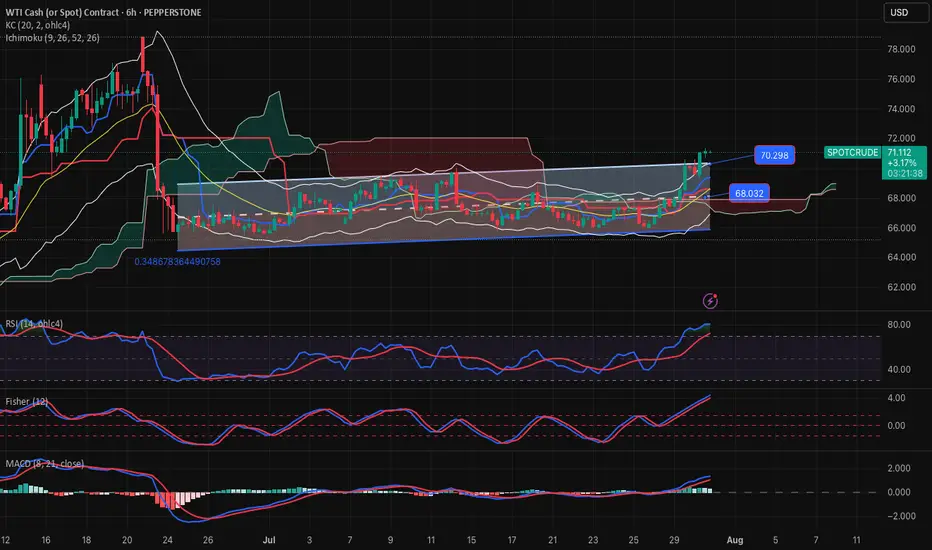
OIL-SELL strategy 6 hourly chart Reg. ChannelOIL has moved up sharply and we are moving beyond the regression channel. This usually will not last especially when overbought status.
Stragtegy SELL @ $ 70.90-71.30 and take profit near 69.37 for now.
Pattern targetIn the previous analysis, we spotted a head and shoulders pattern and mentioned that if it gets activated, it will hit the pattern target — and that’s exactly what happened.
A clean and beautiful setup.
WTI remains supported on Russia sanctions threatIt is worth keeping an eye on the energy markets, given the recent bounce from a key support area around $65.00. With WTI moving back above the 200-day average at $68.00, this is an additional bullish sign from a technical standpoint. This level is now the first support to watch, followed by $67.00 and then that $65.00 key level.
Resistance comes in at $70.00 followed by $72.80.
From a macro point of view, President Trump’s decision to bring forward the deadline for Russia to agree to a ceasefire has ever so slightly heightened the prospect of secondary sanctions being imposed on foreign purchasers of Russian crude — namely China, India, and Turkey. There is a risk we could see a spike in oil prices, if fears of Russian supply being curtailed, intensifies. At the same time, fears about demand have receded with the announcement of a few trade deals by the US and recent economic data from Europe and the US both showing mild strength.
By Fawad Razaqzada, market analyst with FOREX.com.
Market Analysis: Oil Prices Ease – Market Awaits Fresh CatalystMarket Analysis: Oil Prices Ease – Market Awaits Fresh Catalyst
WTI crude oil is also down and remains at risk of more losses below $64.60.
Important Takeaways for WTI Crude Oil Price Analysis Today
- WTI crude oil price continued to decline below the $66.00 support zone.
- It traded below a connecting bullish trend line with support at $65.60 on the hourly chart of XTI/USD at FXOpen.
WTI Crude Oil Price Technical Analysis
On the hourly chart of WTI crude oil at FXOpen, the price struggled to continue higher above $67.50. The price formed a short-term top and started a fresh decline below $66.00.
There was a steady decline below the $65.80 pivot level. The bears even pushed the price below $65.00 and the 50-hour simple moving average. The price traded below a connecting bullish trend line with support at $65.60.
Finally, the price tested the $64.75 zone. The recent swing low was formed near $64.73, and the price is now consolidating losses. On the upside, immediate resistance is near the $65.60 zone. It is close to the 50% Fib retracement level of the downward move from the $66.42 swing high to the $64.73 low.
The main resistance is $65.80. A clear move above it could send the price towards $66.40. The next key resistance is near $67.50. If the price climbs further higher, it could face resistance near $70.00. Any more gains might send the price towards the $72.00 level.
Immediate support is near the $64.60 level. The next major support on the WTI crude oil chart is near $63.20. If there is a downside break, the price might decline towards $60.00. Any more losses may perhaps open the doors for a move toward the $55.00 support zone.
This article represents the opinion of the Companies operating under the FXOpen brand only. It is not to be construed as an offer, solicitation, or recommendation with respect to products and services provided by the Companies operating under the FXOpen brand, nor is it to be considered financial advice.

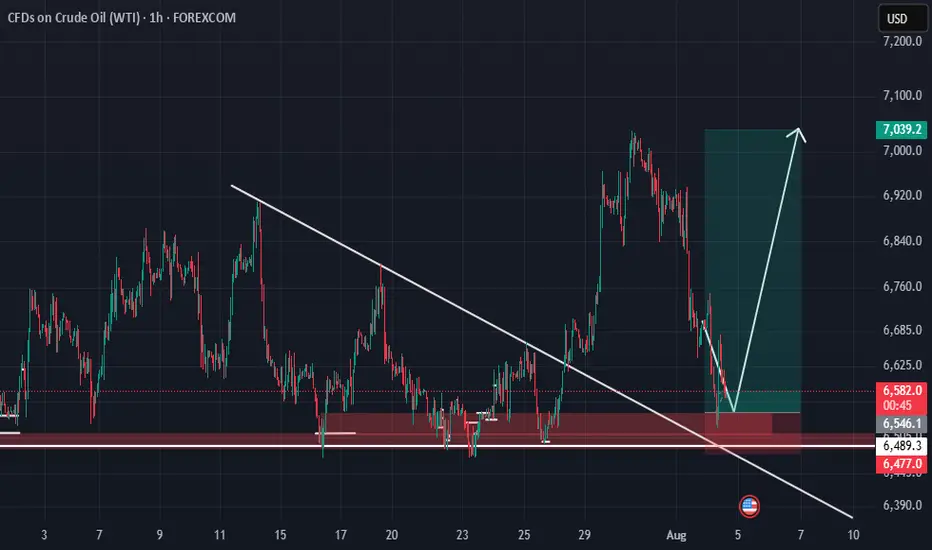
XTIUSD broke the trendline resistance likely will go to 70 XTIUSD has broken the trendline resistance and the price may move to 0.5 fib level of recent swing. let us see.

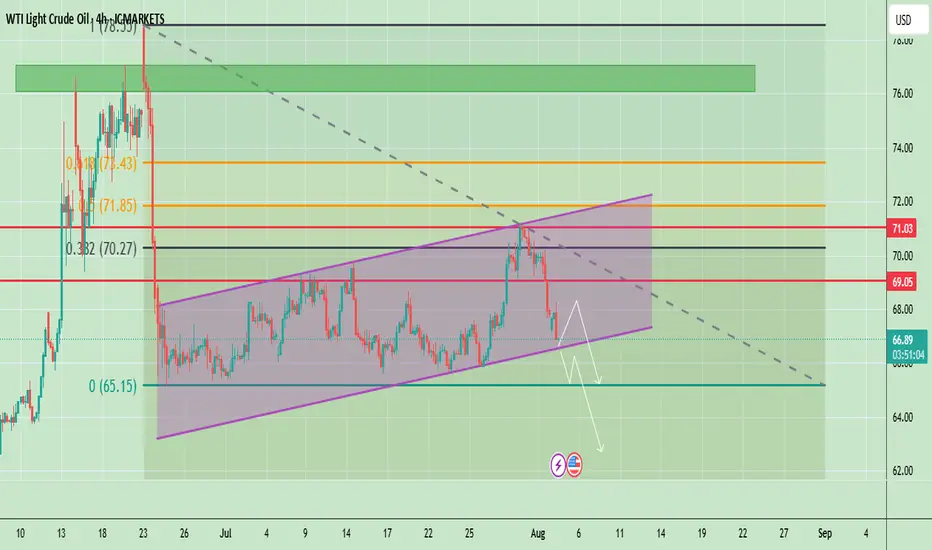
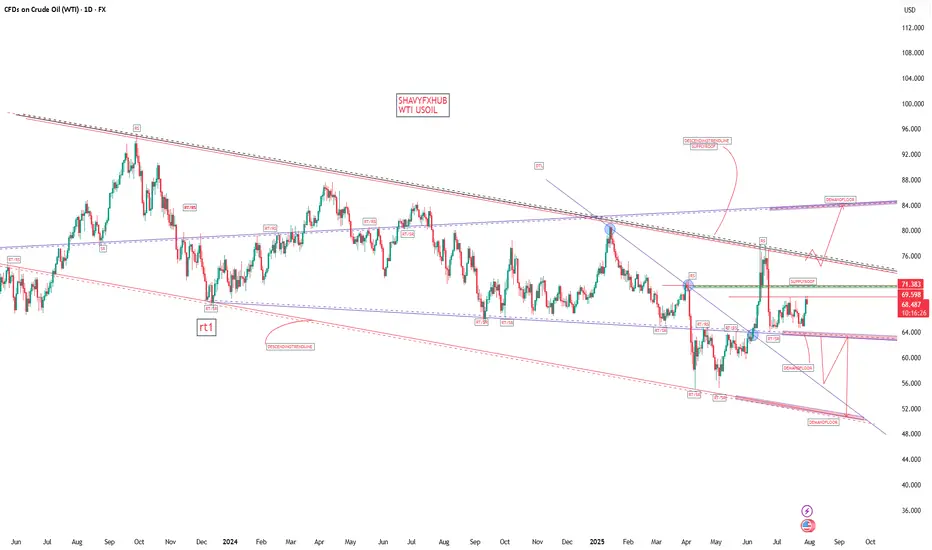
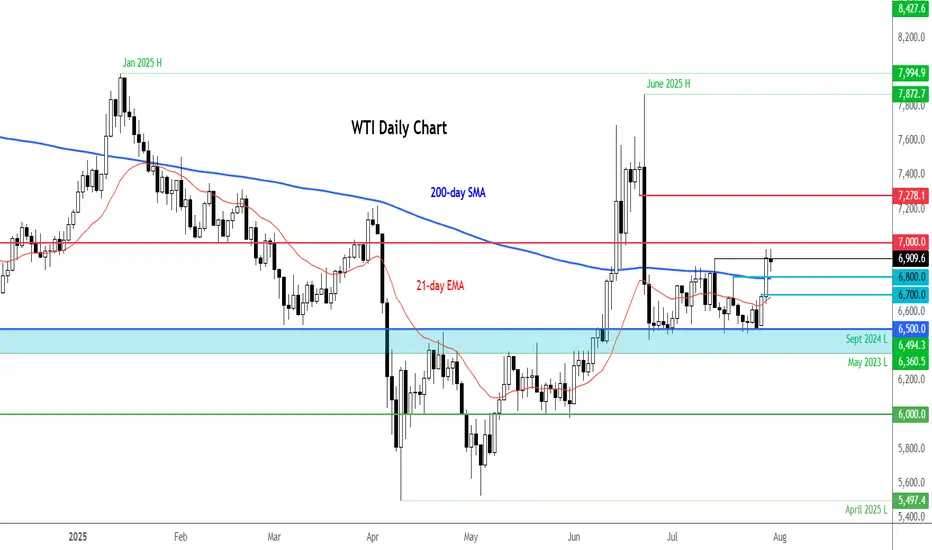
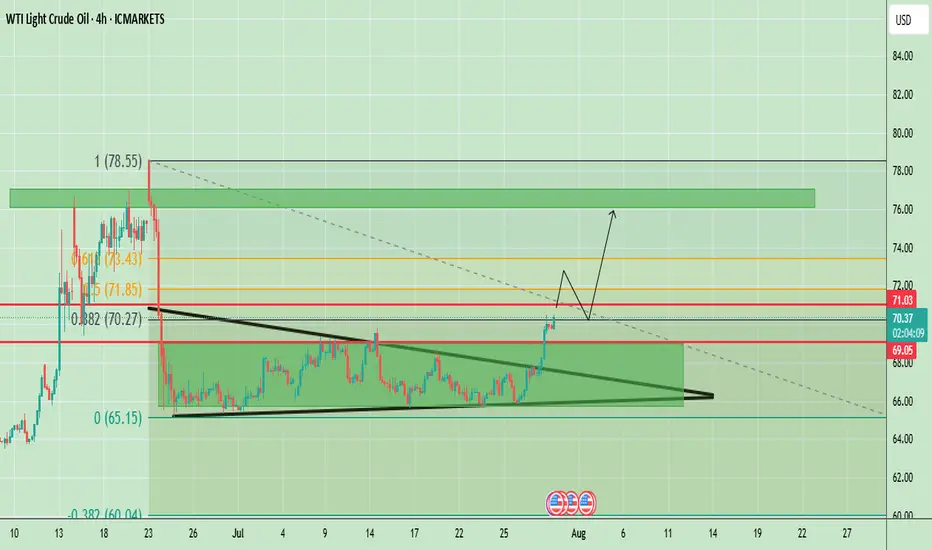
WTI Crude Oil Breaks Out of Symmetrical Triangle, $73-$76 ZoneThe WTI Crude Oil chart shows a strong breakout from the symmetrical triangle pattern that was forming for several weeks. Price has decisively broken above the descending resistance trendline and is now testing the $70–$71 area, which aligns with the 0.382 Fibonacci retracement level (around $70.27) and an important horizontal resistance ($71.03). This breakout indicates strong bullish momentum, supported by the recent series of higher lows and a sharp upward move in recent sessions.
If price sustains above $69.05 (previous breakout zone), we could see a bullish continuation towards $73.40 (0.118 Fibonacci) and potentially to $76.00–$76.50, which is the upper resistance block marked on the chart. However, if the price fails to hold above $69.00, there could be a pullback to retest the broken triangle resistance around $67–$68 before any next bullish leg.
Weekly Chart
The weekly chart of WTI Crude Oil is showing a long-term downtrend channel, where price has been consistently making lower highs and lower lows since mid-2023. Currently, oil is trading around $69.96, showing a sharp bullish push of 6.13% for the week. However, the price is still inside the broader descending channel, which keeps the long-term trend bearish unless a confirmed breakout occurs.
Key Resistance Levels:
- $70.27, $71.03, $73.43
Support Levels:
- $69.05 (previous breakout zone)
- $67.00–$68.00 (triangle retest area)
Trend Outlook:
- Short-Term: Bullish momentum; pullbacks likely to hold above $69.05.
- Medium-Term: If $71.85 breaks, price may target $76.00–$76.50 resistance.
Note
Please risk management in trading is a Key so use your money accordingly. If you like the idea then please like and boost. Thank you and Good Luck!
Is the surge in crude oil bulls here a comeback?The news-driven support for crude oil's recent rally is almost exhausted, so we'll continue to adopt a buy-low-sell-high strategy today, using a small stop-loss to maximize profits.
Short at $71.20, with a stop-loss at $71.70 and a take-profit at $69.20. (For aggressive shorting, try shorting at $70.95).
The above strategy is Charlie's personal opinion and is for reference only. If you follow suit, please be cautious and use a stop-loss to protect your position. TVC:USOIL FOREXCOM:USOIL TRADU:USOIL TRADU:USOIL
WTI Crude Oil (USOIL) Technical Analysis:WTI is currently trading near the $65.90 support zone after a strong break below $67.00, indicating increased downside risk if no buying interest appears.
🔹 Bearish Scenario:
If the price breaks below $65.00 and holds, the next support target may be around $62.00.
🔹 Bullish Scenario:
If the price recovers and breaks above $67.00, it could move to retest $69.50, and if bullish momentum continues, potentially extend to $70.50.
⚠️ Disclaimer:
This analysis is not financial advice. It is recommended to monitor the markets and carefully analyze the data before making any investment decisions.

How long can the decline in US crude oil prices last?
💡Message Strategy
On Monday (August 4) during the Asia-Europe session, WTI fell for three consecutive days, with a drop of 1.16% today, trading around 66.55. OPEC+'s decision to increase production, coupled with geopolitical and economic policies, has jointly formed the expectation that oil prices will be "weak and volatile, dominated by downward pressure."
Short-Term: Increased Supply Drives Price Decline
OPEC+'s decision to increase production directly led to further declines in oil prices on Monday (Brent crude fell 0.28% to $69.23/barrel, and WTI fell 0.46% to $67.01/barrel), extending Friday's decline. Market expectations of oversupply reinforced bearish sentiment, particularly as the UAE's additional production increase (accounting for 2.4% of global demand) further amplified the signal of easing supply. However, India's announcement to continue purchasing Russian crude oil partially offset the impact, limiting the price decline and failing to shift the short-term downward trend.
Medium-Term: Supply-Demand and Policy Risks Intertwine
On the Supply Side: OPEC+'s production increase plan may be paused after September, as Goldman Sachs anticipates accelerated OECD inventory accumulation and fading seasonal demand support. However, if US shale oil production is forced to cut production at break-even points due to low oil prices, OPEC+ may adjust its strategy and even consider further releasing the remaining 1.66 million barrels/day of production capacity, which would continue to suppress oil prices.
Long-Term: Market Share Competition and Structural Overcapacity
OPEC+'s production increase strategy aims to reshape the global oil landscape by squeezing out high-cost producers, such as US shale oil, through low prices. Due to rising equipment costs driven by tariffs and low oil prices, US shale oil companies have cut capital expenditures, resulting in a decline in the number of active drilling rigs and a slowdown in production growth. This strategic game is likely to keep oil prices in a low range for a long time, with significant long-term downward pressure. Unity within OPEC+ and coordination between Saudi Arabia and the UAE will be key to policy implementation.
📊Technical aspects
Crude oil's short-term (1H) trend has reversed downward from its highs. The moving averages are diverging and aligning downward, indicating a downward trend in the short term.
The K-line chart has continued to close with small real bodies, and the MACD indicator is about to form a golden cross near the zero axis, signaling weakening downward momentum and a bullish bias on pullbacks. Crude oil is expected to remain weak and downward today, with a potential correction near $65.00.
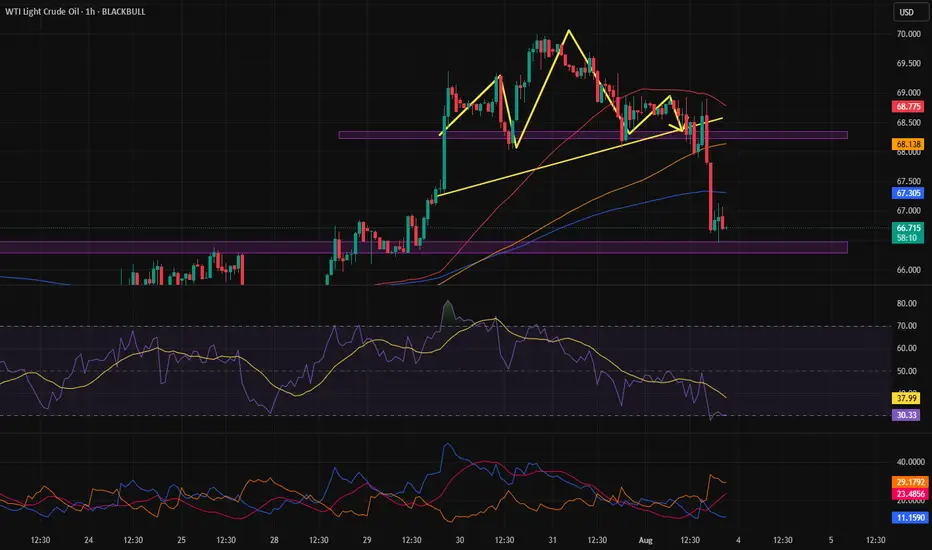
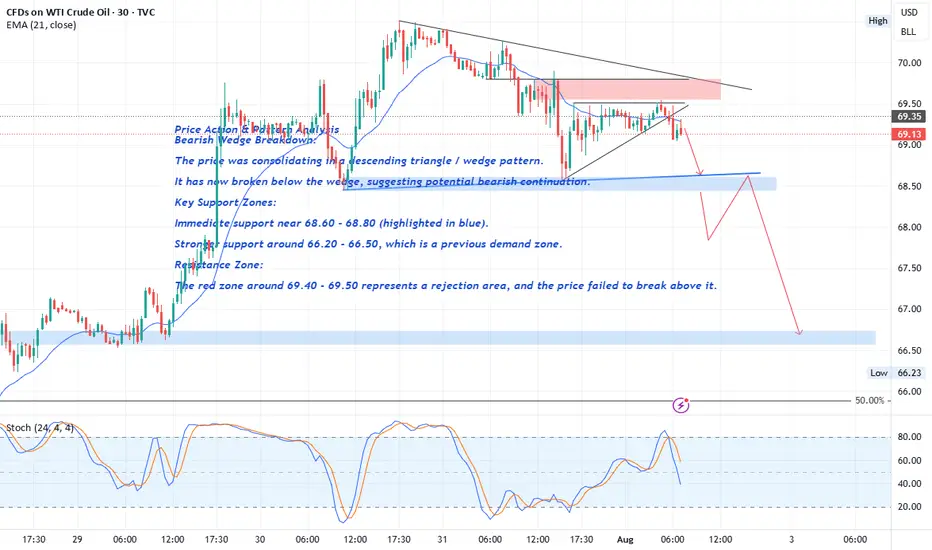
Crude Oil Price Action & Pattern Analysis
Bearish Wedge Breakdown:
The price was consolidating in a descending triangle / wedge pattern.
It has now broken below the wedge, suggesting potential bearish continuation.
Key Support Zones:
Immediate support near 68.60 - 68.80 (highlighted in blue).
FOREXCOM:USOIL
The break of the 68.60 level with a strong bearish candle would serve as confirmation of a Head and Shoulders (H&S) pattern , with solid bearish implications.
Stronger support around 66.20 - 66.50 , which is a previous demand zone.
Resistance Zone:
The red zone around 69.40 - 69.50 represents a rejection area , and the price failed to break above it.
WTI Crude Oil – Range Support in FocusWe're waiting for price to reach the bottom of the range, and with a solid buy signal, we’ll consider going long.
However, since this level has been tested multiple times, it’s highly vulnerable to stop fishing — so caution is key.
As always, we’re ready for all scenarios:
If price breaks below, we’ll wait for a pullback to enter short.
But right now, we’re watching the range support for potential longs
