USOIL UPDATEweek hit its largest since the week of March 7, 2025. The EIA crude oil inventory for the week stood at 3.454 million barrels, contrasting with the expected -1.078 million barrels and the previous figure of -2.032 million barrels.
On Wednesday, crude oil exhibited a high-range oscillatory pattern: it stabilized and rebounded near $62.7, then pulled back after reaching $63.6, maintaining volatility within a narrow upper range. Influenced by the large bullish candlestick on the daily chart, oil prices still carry an upward probability.
Overall, crude oil remains in a bullish consolidation phase. For trading strategies, a "buy low, sell high" approach is recommended, with resistance levels to watch at $63.6–64.5 and support levels at $62.7–61.2.
you are currently struggling with losses, or are unsure which of the numerous trading strategies to follow, at this moment, you can choose to observe the operations within our channel.
WTI trade ideas

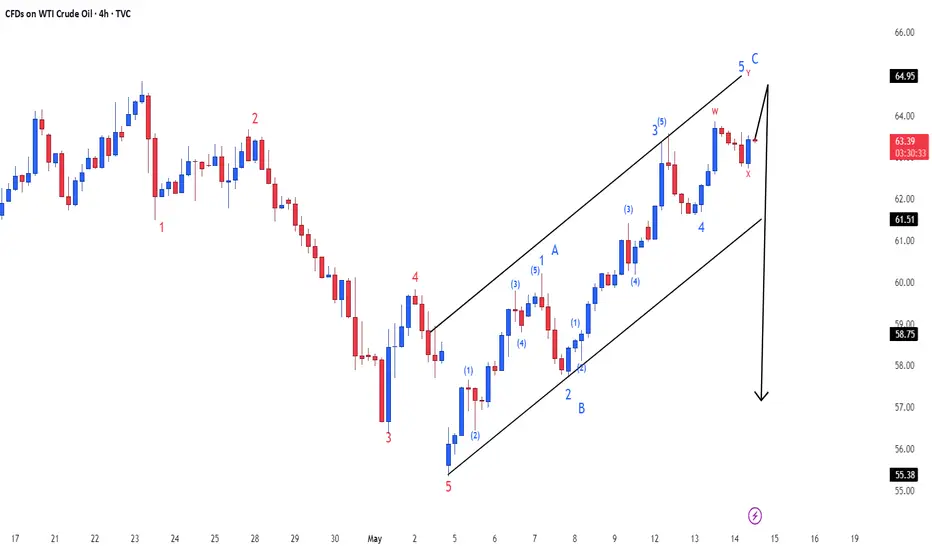
US OILUS Oil Index
- Bullish Channel as an corrective pattern in Short Time Frame
- Break of Structure
- RSI - Divergence
- Completed " 12345 " Impulsive Waves
- Resistance Level
WTI Crude Oil INTRADAY corrective pullback supported at $62.00
WTI crude oil prices are slightly lower in early European trade, down about 1.00% on the day to around $63.00. This pullback ends a four-day winning streak that had pushed prices to over a two-week high.
The decline so far lacks strong bearish momentum, suggesting traders may be taking profits or pausing ahead of key data.
Relevance for Trading:
Price dip appears corrective, not a reversal — no strong selling pressure yet.
Market focus now shifts to upcoming weekly US inventory data, which could drive the next move.
A bullish inventory report could help WTI resume its uptrend; a bearish one may deepen the pullback.
Trading Bias:
Cautiously bullish while holding above $62. Support and inventory reaction will be key for near-term direction.
Key Support and Resistance Levels
Resistance Level 1: 6420
Resistance Level 2: 6560
Resistance Level 3: 6670
Support Level 1: 6170
Support Level 2: 6050
Support Level 3: 5950
This communication is for informational purposes only and should not be viewed as any form of recommendation as to a particular course of action or as investment advice. It is not intended as an offer or solicitation for the purchase or sale of any financial instrument or as an official confirmation of any transaction. Opinions, estimates and assumptions expressed herein are made as of the date of this communication and are subject to change without notice. This communication has been prepared based upon information, including market prices, data and other information, believed to be reliable; however, Trade Nation does not warrant its completeness or accuracy. All market prices and market data contained in or attached to this communication are indicative and subject to change without notice.

USOIL Long Term OutlookUntil a pattern is broken this is what is predicted.
2033 - retests pandemic lows
What could happen in 2033? :O
Not financial advice

USOIL UPDATEHello friends
Given the recent growth in oil prices, it is natural for the price to correct. Now we have obtained the most important price support areas for you and we have also specified the target. If you are willing to enter the transaction, be sure to observe capital management.
*Trade safely with us*

WTI Crude Oil (USOIL) Bullish Pullback Setup – Targeting $66.70 Entry Point: Around $62.30 - $62.26
Stop Loss: Set below the entry zone at $61.65, with a potential lower buffer at $60.90
Target Zone (EA TARGET POINT): Between $66.62 and $67.00
A projected gain of 4.22 points (~6.77%)
📈 Price Action & Indicators:
The price had a strong bullish run recently and is now consolidating or pulling back slightly.
The red and blue moving averages (likely short-term and medium-term MAs) show a bullish crossover and trend.
There's a potential bullish setup if the price pulls back to the entry zone and finds support.
The blue curved arrow indicates a projected bounce from the $62.30 support region back up toward the $66.70 target.
🛠️ Strategy Implied:
Wait for pullback to the entry zone (~$62.30).
Enter long at or around that level.
Set Stop Loss at $61.65 to limit downside risk.
Take Profit at $66.70 for a solid risk-reward ratio.
⚠️ Risks:
If support at $62.30 fails, price may head toward $61.65 or lower.
Market volatility (especially with crude oil) can invalidate setups quickly.
Economic events (e.g., U.S. inventory reports, OPEC news) can disrupt technical patterns.

USOIL BEARS ARE GAINING STRENGTH|SHORT
USOIL SIGNAL
Trade Direction: short
Entry Level: 63.61
Target Level: 55.26
Stop Loss: 69.15
RISK PROFILE
Risk level: medium
Suggested risk: 1%
Timeframe: 1D
Disclosure: I am part of Trade Nation's Influencer program and receive a monthly fee for using their TradingView charts in my analysis.
✅LIKE AND COMMENT MY IDEAS✅

Potential Upside in USOIL Amid Ongoing Wave StructureThere remains a potential for USOIL to strengthen on the weekly timeframe, where it is currently expected to be forming wave (b) of wave within a diagonal pattern. This suggests that the upside area to watch lies in the range of 64.92–70.96.

XTIUSD Crude oil Raid Plan: Snag Profits Before the ATR Trap!🌍 Greetings, Wealth Warriors! Salut! Ciao! Salaam! 🌟
Fellow Profit Pirates, 🤑💰🚀
Crafted with 🔥Bandit Blueprint analysis🔥 (technical + fundamental), here’s our cunning scheme to raid the "XTIUSD / WTI Oil" Energy Market. Follow the charted course for a long entry, aiming to slip away near the high-stakes ATR Zone. Watch out—overbought signals, consolidation, or a trend flip could trap the unwary where bearish bandits lurk! 🏴☠️💸 "Cash out and celebrate, traders—you’ve earned it! 🎉💪"
**Entry 📈**: "The vault’s open! Await the MA breakout (64.00), then strike—bullish riches await!"
Pro tip: Set buy stop orders above the Moving Average or place buy limit orders at the latest 15/30-min swing low/high for pullback entries.
📢 Set a chart "alert" to catch the breakout moment!
**Stop Loss 🛑**: "📣 Heads up, crew! 🗣️ For buy stop orders, hold off on placing that stop loss until the breakout sparks 🚀. Stick to my marked spot 📍 or go rogue at your own peril 😎—it’s your gamble! ⚠️"
📍 Bandit SL set at the recent 3H swing low (60.00) for swing trades.
📍 Adjust SL based on your risk, lot size, and number of orders.
**Target 🎯**: 70.000 or bail out before the finish line.
🧲 **Scalpers, listen up** 👀: Stick to long-side scalps. Big bankrolls can dive in; smaller stacks, join the swing trade heist. Use trailing SL to shield your loot 💰.
💸 **US Oil Spot / WTI** Swing Trade Plan: Bullish vibes 🐂 are surging, fueled by key drivers. ☝
📰 **Dive Deeper**: Check Fundamentals, Macro Trends, COT Reports, Seasonal Patterns, Intermarket Insights, Inventory Data, and Future Targets 👉🔗
⚠️ **Trading Alert: News & Position Tips** 🗞️ 🚨
News drops can shake prices and volatility. To protect your haul:
- Skip new trades during news events.
- Use trailing stops to lock in gains.
💖 **Fuel our heist!** 💥Tap the Boost Button💥 to power up our profit raid. Join the Bandit Trading Crew, snatching wins daily with ease! 🏆🤝🎉
Stay sharp for the next caper—see you soon! 🤑🐱👤🚀
---
Real-Time Data (UTC+1, May 14, 2025) 📊
**WTI Oil (XTIUSD)**:
- **Price**: ~$63.80 (based on latest market data)
- **MA Breakout Level**: ~$64.00 (as per strategy)
- **Stop Loss Level**: ~$60.00 (3H swing low)
- **Target**: $70.00
- **Market Sentiment**: Bullish 🐂, driven by inventory draws and geopolitical factors (per recent analysis).
**Latest COT Data (Friday, May 9, 2025)**:
- **Commercial Hedgers**: Increased net long positions in WTI futures, signaling bullish bias.
- **Large Speculators**: Moderately net long, cautious due to overbought risks.
- **Data Source**: CFTC (official Commitment of Traders report).
**Key Fundamental Drivers**:
- **Inventory**: EIA reported a -2.5M barrel draw last week, supporting bullish momentum.
- **Geopolitical**: Middle East tensions continue to prop up oil prices.
- **Seasonal**: Summer demand expectations rising.
🔔 **Note**: Monitor upcoming EIA inventory data (Wednesday, May 14, 2025) for volatility.
---
💥 Boost this plan and let’s plunder the markets together! 🚀

USOIL POTENTIAL SHORT|
✅CRUDE OIL has been growing recently
And Oil seems locally overbought
So as the pair is approaching a horizontal resistance of 64.82$
Price decline is to be expected
SHORT🔥
✅Like and subscribe to never miss a new idea!✅
Disclosure: I am part of Trade Nation's Influencer program and receive a monthly fee for using their TradingView charts in my analysis.

usoil:sell@64.5When crude oil rises again and reaches the resistance area, short selling can continue. The upper resistance is 64-65.5.
I will keep sending accurate signals and provide account management services without charging any fees.
Crude oil trading strategy:
usoil sell@64-64.5
tp:62-60

Oil Drop Short Position
Greetings Traders this is my idea on Oil and it is a Long shot for a Short.
This is my explanation:
On the 4H chart of WTI crude oil, we can observe a well-defined downtrend that began near the $72.50 level. After a sharp sell-off, price entered a brief accumulation phase and has now pulled back into a previous support zone — now acting as resistance — offering a prime opportunity for trend continuation.
🔑 Key Technical Zones:
🟥 Beginning of a Downtrend: Around $72.50 – local top and start of bearish momentum.
🟧 Breakdown Zone: Around $59.00 – key support turned resistance after a strong breakdown.
🟦 Accumulation Zone: Around $62.00–64.00 – consolidation phase before continuing lower.
✅ Retracement Area (Green Box): Around $60.00–60.25 – previous support now acting as resistance; ideal zone to re-enter short.
🔵 Target Zone: $53.30 – projected next support level and target for the short position.
🎯 Active Short Position:
Entry: $60.00
Stop Loss: $61.20 (above retracement zone)
Take Profit: $53.30
Risk/Reward Ratio: ~1:4.5
After a confirmed bearish structure, price pulled back into the retracement area, which previously acted as support. This area is now likely to serve as resistance, and price rejection here aligns with a high-probability trend continuation trade.
The target for the short is set at $53.30, which corresponds with the previous swing low, while the stop loss is positioned safely above the rejection zone to avoid false breakouts.
📈 Conclusion:
This setup reflects a textbook lower high formation within a strong downtrend, offering a clean structure and favorable risk-to-reward ratio. Watching closely for bearish confirmations within the retracement zone to validate momentum continuation.
Dear Traders like,comment let me know what do you think?

CRUDE OIL TO HIT $160?! (VIDEO UPDATE):Oil prices broke down lower in the past few weeks, after a much needed LQ grab, following a 2 year consolidation. We’ve seen a ‘5 Wave Complex Correction’, which should now be followed by price recovery.
Wait for buyers to BREAK ABOVE our ‘buying confirmation’ level, followed a by a retest before buying❗️

WTI Crude Oil Testing Major Resistance – Will $64.260 Hold or CrPrice has surged sharply from the $55.931 🔽 support zone, climbing nearly 14% and is now approaching the key $64.260 🔼 resistance area. This level has held twice before, making it a significant short-term barrier.
Currently trading at $63.83, with
Support at: $60.000 🔽, $55.931 🔽
Resistance at: $64.260 🔼, $67.000 🔼, $71.101 🔼
Bias:
🔼 Bullish: A clean breakout and retest above $64.260 could open the door toward $67.000 and even $71.101. Strong momentum favors buyers for now.
🔽 Bearish: Rejection at $64.260 may lead to a retracement back toward $60.000 or even $55.931 if sellers step in strongly.
📛 Disclaimer: This is not financial advice. Trade at your own risk.

USOIL prediction for Tue the 13th of MayApologies about not sharing predictions recently. For today, I can see the USOIL has reached a beautiful supply that has a FVG inside of it. My prediction is that the price might reverse for a short correction. If you are day-trading, that might be a good opportunity.
⚠️ Disclaimer:
This idea reflects my personal analysis and bias. It is not financial advice. Always do your own research, apply risk management, and trade only when you have clear confirmation. Protect your capital first.

WTI OIL Buy and sell levels within its Channel Down.WTI Oil (USOIL) has been trading within a Channel Down pattern on the 1D time-frame. The price is now rising having priced its most recent technical Lower Low. Every Lower High rejection happened either on or above the 1D MA200 (orange trend-line).
With the current rebound looking similar to September - October 2024, we expect a 0.786 Fib and 1D MA200 test at $68.50 (buy) and then reversal to a minimum -17.30% decline to $57.00 (sell).
-------------------------------------------------------------------------------
** Please LIKE 👍, FOLLOW ✅, SHARE 🙌 and COMMENT ✍ if you enjoy this idea! Also share your ideas and charts in the comments section below! This is best way to keep it relevant, support us, keep the content here free and allow the idea to reach as many people as possible. **
-------------------------------------------------------------------------------
Disclosure: I am part of Trade Nation's Influencer program and receive a monthly fee for using their TradingView charts in my analysis.
💸💸💸💸💸💸
👇 👇 👇 👇 👇 👇

USOILUSOIL is in a correction phase. If the price can stay above 61.5, it is expected that the price will rebound. Consider buying in the red zone.
🔥Trading futures, forex, CFDs and stocks carries a risk of loss.
Please consider carefully whether such trading is suitable for you.
>>GooD Luck 😊
❤️ Like and subscribe to never miss a new idea!

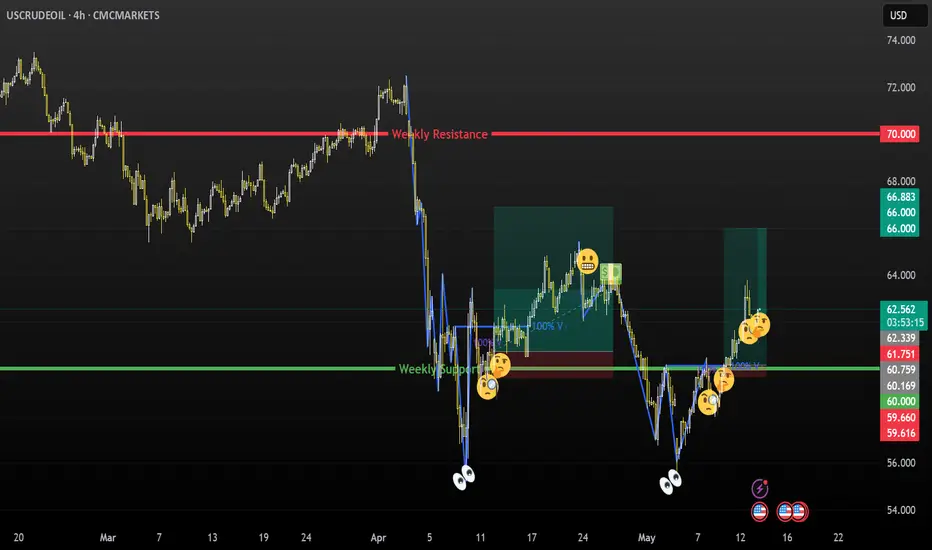
USCRUDEOIL - Potential BuyHi Traders, hope this will help your view of the market regarding CMCMARKETS:USCRUDEOIL
BIAS: BUY
Logical Analysis:
SELLER gave a big discount from 3rd of April (72.00) till 9th of April (56.00). It was fast and healthy.
BUYER agreed to buy at 60.00.
Business is on around that 60.00 level.
I am bias to buy because i believe the BUYER is in control and want to buy more and the SELLER is not giving a discount because the BUYER is keen to buy high.
Technical Analysis:
See Chart :)
Good Luck!

Us oil Close or hold
how high can it go
Watching price action closely — HOLD or CLOSE?
WTI Crude Oil H4 – Key Support Zone

WTI Oil H4 | An overlap support at 38.2% Fibonacci retracementWTI oil (USOIL) could fall towards an overlap support and potentially bounce off this level to climb higher.
Buy entry is at 60.44 which is an overlap support that aligns with the 38.2% Fibonacci retracement.
Stop loss is at 57.60 which is a level that lies underneath a swing-low support and the 61.8% Fibonacci retracement.
Take profit is at 63.42 which is a multi-swing-high resistance.
High Risk Investment Warning
Trading Forex/CFDs on margin carries a high level of risk and may not be suitable for all investors. Leverage can work against you.
Stratos Markets Limited (tradu.com):
CFDs are complex instruments and come with a high risk of losing money rapidly due to leverage. 63% of retail investor accounts lose money when trading CFDs with this provider. You should consider whether you understand how CFDs work and whether you can afford to take the high risk of losing your money.
Stratos Europe Ltd (tradu.com):
CFDs are complex instruments and come with a high risk of losing money rapidly due to leverage. 63% of retail investor accounts lose money when trading CFDs with this provider. You should consider whether you understand how CFDs work and whether you can afford to take the high risk of losing your money.
Stratos Global LLC (tradu.com):
Losses can exceed deposits.
Please be advised that the information presented on TradingView is provided to Tradu (‘Company’, ‘we’) by a third-party provider (‘TFA Global Pte Ltd’). Please be reminded that you are solely responsible for the trading decisions on your account. There is a very high degree of risk involved in trading. Any information and/or content is intended entirely for research, educational and informational purposes only and does not constitute investment or consultation advice or investment strategy. The information is not tailored to the investment needs of any specific person and therefore does not involve a consideration of any of the investment objectives, financial situation or needs of any viewer that may receive it. Kindly also note that past performance is not a reliable indicator of future results. Actual results may differ materially from those anticipated in forward-looking or past performance statements. We assume no liability as to the accuracy or completeness of any of the information and/or content provided herein and the Company cannot be held responsible for any omission, mistake nor for any loss or damage including without limitation to any loss of profit which may arise from reliance on any information supplied by TFA Global Pte Ltd.
The speaker(s) is neither an employee, agent nor representative of Tradu and is therefore acting independently. The opinions given are their own, constitute general market commentary, and do not constitute the opinion or advice of Tradu or any form of personal or investment advice. Tradu neither endorses nor guarantees offerings of third-party speakers, nor is Tradu responsible for the content, veracity or opinions of third-party speakers, presenters or participants.

Crude Oil Dipped: Downtrend Could ResumeFenzoFx—Crude oil has begun consolidating around $63.5, a resistance level aligned with the 78.6% Fibonacci retracement. Selling pressure has resulted in a long-wicked bearish candlestick pattern at this level.
The primary support level stands at $61.45. A break below this threshold could trigger a new bearish wave, potentially driving the price toward the $60.20 support, reinforced by the 50-period simple moving average.
However, the primary trend remains bullish as long as the price holds above the $60.20 support.

USOIL | 4H | SWING TRADING Good morning, dear friends
Due to high demand, I’ve prepared a USOIL analysis for you. My target level is set at 63.600.
Once my target is reached, I’ll be sharing updates under this post.
Dear friends, your likes are always my biggest motivation to keep sharing analyses. That’s why I kindly ask each of my followers to show their support—please don’t hold back on the likes.
I sincerely thank everyone who supports me with their likes. It truly means a lot
