Heading into Fibonacci confluence?WTI Oil (XTI/USD) is rising towards the pivot and could reverse to the 1st support which acts as and overlap support.
Pivot: 65.19
1st Support: 61.85
1st Resistance: 67.84
Risk Warning:
Trading Forex and CFDs carries a high level of risk to your capital and you should only trade with money you can afford to lose. Trading Forex and CFDs may not be suitable for all investors, so please ensure that you fully understand the risks involved and seek independent advice if necessary.
Disclaimer:
The above opinions given constitute general market commentary, and do not constitute the opinion or advice of IC Markets or any form of personal or investment advice.
Any opinions, news, research, analyses, prices, other information, or links to third-party sites contained on this website are provided on an "as-is" basis, are intended only to be informative, is not an advice nor a recommendation, nor research, or a record of our trading prices, or an offer of, or solicitation for a transaction in any financial instrument and thus should not be treated as such. The information provided does not involve any specific investment objectives, financial situation and needs of any specific person who may receive it. Please be aware, that past performance is not a reliable indicator of future performance and/or results. Past Performance or Forward-looking scenarios based upon the reasonable beliefs of the third-party provider are not a guarantee of future performance. Actual results may differ materially from those anticipated in forward-looking or past performance statements. IC Markets makes no representation or warranty and assumes no liability as to the accuracy or completeness of the information provided, nor any loss arising from any investment based on a recommendation, forecast or any information supplied by any third-party.
WTI trade ideas

Oil Short: Ending Diagonal and Rising WedgeI propose that Oil is a good short candidate because of what I am seeing:
1. Rising Wedge
2. Ending Diagonal within the Rising Wedge
I propose 3 entry points for shorting but mention that if you are shorting at the top of the trendline, to cater for false breakout, meaning more allowance in your stop.
Good luck!

Crude Oil Breaks Out — Is $65.5 the Next Wall?Price started its bullish move in the first week of April, and since then, it’s been making higher lows. Today’s candle broke cleanly above a key trendline, and price is now heading toward the $65.5 resistance, which could act as a critical decision zone.
Key Levels:
- Support: Around $63.2
- Resistance: $65.5 (next major wall)
- Setup: Trendline Breakout
What I’m Watching:
When price gets to 65.5, I’ll be looking for:
- A strong breakout (maybe even retest + continuation) to hold my buy
- Or a clear rejection to scale out or re-evaluate
I’m staying patient. I’ve picked my setup and I’m sticking to it — no jumping around. Let’s see how this plays out.
Cheers!
pClem Trades

MAY 1-1-1 TRADING CHALLENGEI’ve been thinking about how messy trading can get.
One day you're watching a video on scalping, the next you're trying to swing trade five different pairs. Then before you know it, your screen is cluttered with a million indicators, your confidence is shot, and your results? Even worse.
So for the month of May, I’m doing something different.
I’m calling it the 1-1-1 Challenge
1 Mentor. 1 Instrument. 1 Setup.
For me, that means:
- I’m sticking with Tori as my mentor. No other videos, no mixed signals.
- I’m focusing only on Crude Oil. That’s my chart, my market.
- And I’m trading only Trendline Breaks. Clean and simple.
That’s it. Pure focus. Pure discipline.
Let’s see what happens when I stop trying to trade everything — and start mastering one thing.
If you’ve been feeling the same kind of overwhelm, maybe this challenge is for you too.
Want to join me in May?
Let’s go all in:
1 Mentor
1 Instrument
1 Setup
I'll be sharing my progress and documenting my journey here. Follow me!

OIL buy setup H1Hello! Friends,
Greetings. Please leave a Like if you like the idea.
Before start talking about technical Let's share your LOVE by giving me LIKES to support this work. Thanks in advance.

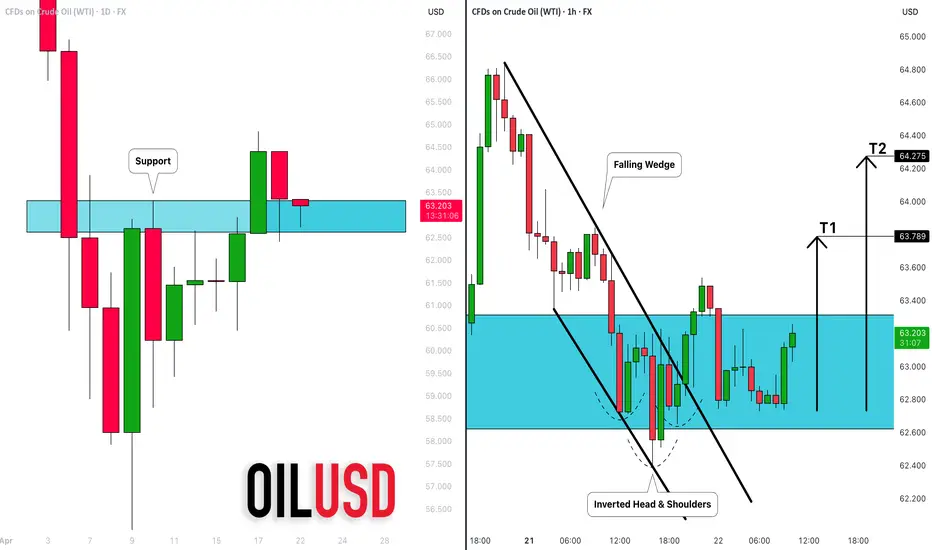
CRUDE OIL (WTI): Long From Support Explained
There is a high chance that WTI Crude Oil will go up
from the underlined key daily support.
As a confirmation, the price violated both a neckline of an inverted
head & shoulders pattern and a resistance line of a falling wedge
on an hourly time frame.
Goals: 63.780 / 64.275
❤️Please, support my work with like, thank you!❤️
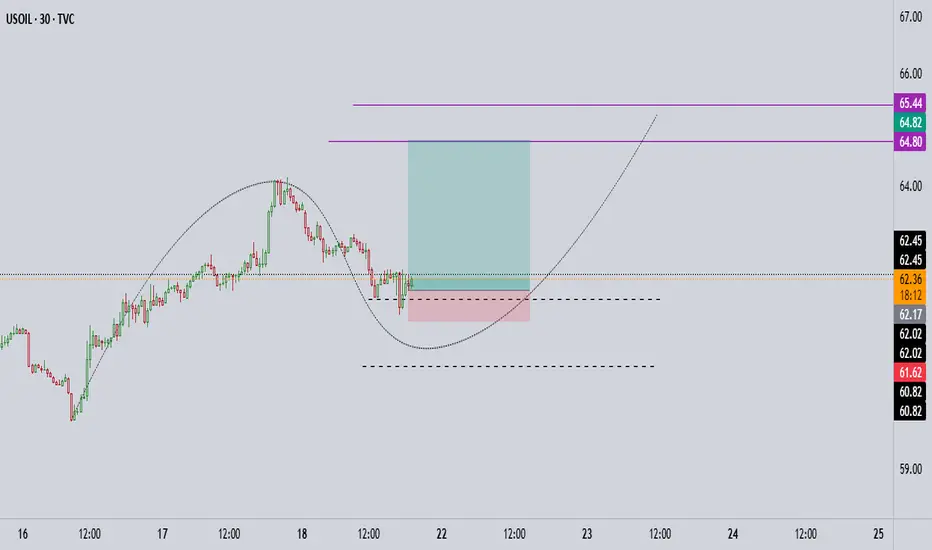
[USOIL] Trade ideaAlready took my first short position on this asset but I still have the same bias and a possible new entry level here.
Great Trade !

USOIL Technical Analysis! SELL!
My dear followers,
This is my opinion on the USOIL next move:
The asset is approaching an important pivot point 63.68
Bias - Bearish
Technical Indicators: Supper Trend generates a clear short signal while Pivot Point HL is currently determining the overall Bearish trend of the market.
Goal - 61.56
About Used Indicators:
For more efficient signals, super-trend is used in combination with other indicators like Pivot Points.
Disclosure: I am part of Trade Nation's Influencer program and receive a monthly fee for using their TradingView charts in my analysis.
———————————
WISH YOU ALL LUCK

Oil Buy Idea/Analysis ScalpingBased on reversal trading and BOS formation, I see that an uptrend is forming within a downtrend move. I assume this is going to be my retest move of the last LOW in a higher timeframe, such as the Daily, so I'm trying to take advantage of it and scalp it. There is more explanation in the video.

WTI BUY Natural Gas, WTI Oil, Brent Oil Forecasts – Oil Soars 3% As U.S. Imposes New Iran-Related Sanctions
USOIL Will Move Higher! Long!
Take a look at our analysis for USOIL.
Time Frame: 12h
Current Trend: Bullish
Sentiment: Oversold (based on 7-period RSI)
Forecast: Bullish
The market is testing a major horizontal structure 63.114.
Taking into consideration the structure & trend analysis, I believe that the market will reach 68.050 level soon.
P.S
Overbought describes a period of time where there has been a significant and consistent upward move in price over a period of time without much pullback.
Disclosure: I am part of Trade Nation's Influencer program and receive a monthly fee for using their TradingView charts in my analysis.
Like and subscribe and comment my ideas if you enjoy them!

Habibi, the Price is Right at 70-79$Habibi, the Price is Right
Post Content (with emojis version of title at the top):
🤝🛢️ Habibi, the Price is Right at 70–79$ 💸🎯
The Call That Never Happened (But Might Have)
📞 I was just updating my crude oil chart when suddenly… my phone rang.
No caller ID. I answered. And somehow— I was patched into a live call between:
🍊🦅 Trump and 🌴👑 the King of Saudi Arabia.
They mistook me for a translator.
So naturally, I stayed on the line.
Here’s how the oil market actually got settled...
🍊🦅 Trump: “Hello? Who is this? I have the best phone security. The Chinese can’t hack it. Nobody can.”
🌴👑 King: “Donald, ya’ani... it’s me!”
🍊🦅 Trump: “Me who? I know the most people, you sound like an immigrant, do you have a visa?”
🌴👑 King: “Your King of Saudi Arabia, habibi! Your favorite oil guy! I can afford all the Visas and Mastercards!”
🍊🦅 Trump: “My King! My favorite King, my guy, what a Tremendous timing. Oil prices are way too high. I need cheap oil to start my tariff wars again! ”
🌴👑 King: “Habibi, we said $88! We need to fund flying taxis and desert ski slopes. The Line isn’t building itself, ya’ani.”
🍊🦅 Trump: “But I gave you the PGA Tour! LIV Golf is huge ! You’re welcome.”
🌴👑 King: “ Mashallah , yes... but we paid this Tiger Woods $800 million just to say no. Wallah , that’s expensive rejection, Donald.”
🍊🦅 Trump: “That’s nothing my King. Peanuts. Melania’s token did better than that. Peanuts my King, peanuts for the camels. What about $76?”
🌴👑 King: “Cristiano Ronaldo costs $200M a year! And he wants an oasis with seven pools! And now we want Messi from Miami and Ronaldinho. Mashallah! ”
🍊🦅 Trump: “I need lower gas prices my King or I can’t revive the economy!
And you made Messi cry in the World Cup, my King — not my fault. You kicked his ass, not my fault..I need to check on his visa if he is legally in my great country (again) or i will send him to El Salvador and you can get him cheap from there”
🌴👑 King: “Inshallah. But we’re also building a ski slope in the desert. With real snow.
We need $88.88 oil Donald! 88$ minimum”
💙🧠 FXPROFESSOR: “Uh... sorry to interrupt... I don’t know how I got on this call... but I think I can help.
I understand charts.”
🍊🦅 Trump: “Who is that?!I know the voice, who is that?”
💙🧠 FXPROFESSOR: “I’m the FXPROFESSOR. And I might have a solution for you.
It’s called… The Compromise Zone. ”
🌴👑 King: “Ya’ani… go on.”
💙🧠 FXPROFESSOR: “$70–79. That’s where the technicals align.
Trump gets a few more months below that, help him with low oil for inflation until he can deal with Powell, then you two take it sideways in that range 70-79$ and you get stability for The Line, the AI and all the great things the Kingdom is working on.”
🍊🦅 Trump: “I know the Professor! I follow him on TradingView. Genius. Huge brain. One of the best brains. I bought Ethereum at 4400$ because of him and I'm down 60% but it's ok..peanuts, great guy the Professor, great guy”
🌴👑 King: “Inshallah. But we still have losses. Ya’ani... Donald, how do we cover them? And how did this guy get on our call habibi”
🍊🦅 Trump: “Easy King, it's easy! We launch a Great meme coin together, me and you, the greatest token in the world. We call it — $KINGOFARABIA —meme token, we Pump it on Solana. We'll pump it like you pump Oil. Gonna be Great, we will Cover the gap my King.”
🌴👑 King: “We tried blockchain before. Royal IT guy lost the wallet. Had to… correct the situation. Plus i also invested on Ethereum Donald, Solana is for the kids and the stuff”
🍊🦅 Trump: “Let's find a solution my King and i will do this for you: I’ll send Jerome Powell. A gift. Let him run your rates. Take him for free (please take him)”
🌴👑 King: “Jerome is good for my country, he is so cold he will make the temeratures drop 2 degrees, ok we take him but One more thing Donald… I want Taylor Swift at my nephew’s wedding? And please she comes dressed properly and act respectfully”
🍊🦅 Trump: “Done. Nobody says no to me. Except from the Feds, the Europeans, the Japanese, Canada and the penguins i taxed by accident. But that's ok, we make America Great again. I will send you the new Trump memorabilia collection, the best MAGA t-shirt for you my King. It's still made in China but it's soon to be made here at home, soon. ”
🌴👑 King: “Wait Donald! I just remembered.. Also... we want UFC in Riyadh, for ever! Big events. I want Dana White to agree and i want a podcast with Josh Rogans.”
🍊🦅 Trump: “I’ll talk to Joe Rogan, great guy Joe. I’ll call Dana. Maybe Khabib makes a comeback. I know fighters. Strong fighters. Big ratings. They love me. They love you too my King”
📉 And that’s how oil found balance between memes, monarchs, and macro.
📊 Chart Insights – USOIL 12h
❌ $93 = clear rejection
🟦 Compromise Zone: $70–79
🟢 $88 = Saudi’s macro target
🔻 $70 = Trump’s inflation floor
🔄 Consolidation expected unless OPEC or Powell shift the game
💬 What do you think? Are we just memeing the macro?
Or is this really how the oil market works in 2025?
One Love,
The FXPROFESSOR 💙🧠
Disclaimer: This is a fictional satire written for entertainment and educational purposes.
Any resemblance to real negotiations is purely… coincidental.
The chart is real, though — and so is the technical compromise.
Special Salam and much love to my friends in Saudi Arabia 🇸🇦 — the most wonderful people I’ve met in the world.The image is not of the new King but that's ok, great image.It's great! ❤️

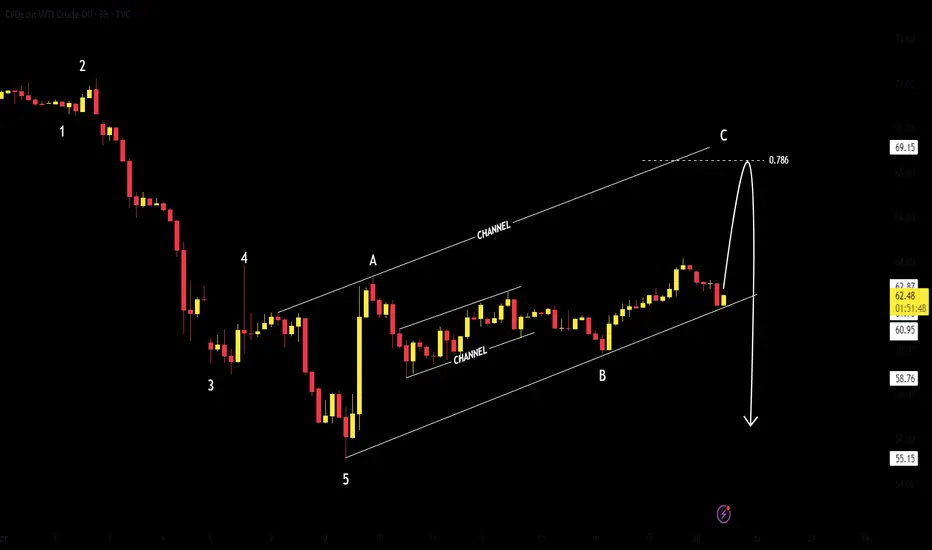
US OilCrude Oil
- Order Block
- Change of Characteristics
- Bullish Channel as an Corrective Pattern in Short Time Frame and Long Time Frame
- RSI - Divergence
- Completed " 12345 " Impulsive Waves and " AB " Corrective Waves
Crude Oil Stabilizes Above Key Fibonacci LevelFenzoFx—Crude Oil is consolidating after testing $63.9 resistance, trading near $62.23, supported by the 50.0% Fibonacci retracement.
While the bullish trend persists above the 50-period simple moving average, the Stochastic Oscillator shows an oversold condition, hinting at a rebound.
A bullish wave may target $64.00 if Oil holds above $62.00. However, if it dips below this level, momentum could extend down to $60.77, near the 78.6% Fibonacci retracement.
>>> No Deposit Bonus
>>> %100 Deposit Bonus
>>> Forex Analysis Contest
All at FenzoFx Decentralized Forex Broker

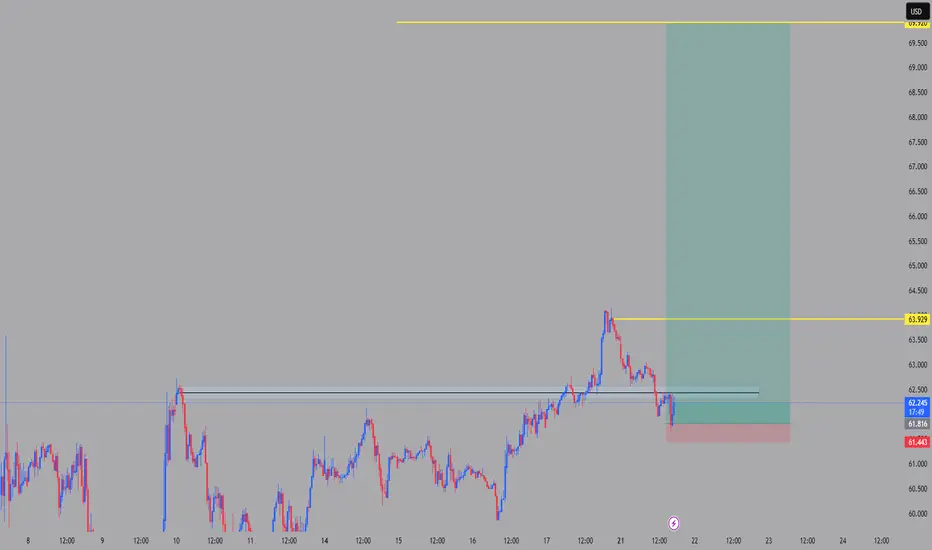
USOIL LongConsidering a long on USOIL, just a small position for now. Planning to add if price pulls back more.
Leaning bullish unless the last low gets broken.

Oil Prices will be on the stage "again"TVC:USOIL
Already break up the monthly downtrend line.
The target is based on the Fibonacci extension.

USOIL Short Opportunity Overall USOIL is in downtrend, Planning a short on USOIL as seen in screenshot
SL Above The Orderblock
TP is Open Cause The Trend is down

WTI Oil H4 | Potential bullish bounceWTI oil (USOIL) is falling towards a pullback support and could potentially bounce off this level to climb higher.
Buy entry is at 62.01 which is a pullback support.
Stop loss is at 58.60 which is a level that lies underneath a swing-low support and the 61.8% Fibonacci retracement.
Take profit is at 65.63 which is a pullback resistance that aligns with the 61.8% Fibonacci retracement.
High Risk Investment Warning
Trading Forex/CFDs on margin carries a high level of risk and may not be suitable for all investors. Leverage can work against you.
Stratos Markets Limited (tradu.com):
CFDs are complex instruments and come with a high risk of losing money rapidly due to leverage. 63% of retail investor accounts lose money when trading CFDs with this provider. You should consider whether you understand how CFDs work and whether you can afford to take the high risk of losing your money.
Stratos Europe Ltd (tradu.com):
CFDs are complex instruments and come with a high risk of losing money rapidly due to leverage. 63% of retail investor accounts lose money when trading CFDs with this provider. You should consider whether you understand how CFDs work and whether you can afford to take the high risk of losing your money.
Stratos Global LLC (tradu.com):
Losses can exceed deposits.
Please be advised that the information presented on TradingView is provided to Tradu (‘Company’, ‘we’) by a third-party provider (‘TFA Global Pte Ltd’). Please be reminded that you are solely responsible for the trading decisions on your account. There is a very high degree of risk involved in trading. Any information and/or content is intended entirely for research, educational and informational purposes only and does not constitute investment or consultation advice or investment strategy. The information is not tailored to the investment needs of any specific person and therefore does not involve a consideration of any of the investment objectives, financial situation or needs of any viewer that may receive it. Kindly also note that past performance is not a reliable indicator of future results. Actual results may differ materially from those anticipated in forward-looking or past performance statements. We assume no liability as to the accuracy or completeness of any of the information and/or content provided herein and the Company cannot be held responsible for any omission, mistake nor for any loss or damage including without limitation to any loss of profit which may arise from reliance on any information supplied by TFA Global Pte Ltd.
The speaker(s) is neither an employee, agent nor representative of Tradu and is therefore acting independently. The opinions given are their own, constitute general market commentary, and do not constitute the opinion or advice of Tradu or any form of personal or investment advice. Tradu neither endorses nor guarantees offerings of third-party speakers, nor is Tradu responsible for the content, veracity or opinions of third-party speakers, presenters or participants.

Market Analysis: WTI Crude Oil Rebounds in TandemMarket Analysis: WTI Crude Oil Rebounds in Tandem
WTI Crude oil prices climbed higher above $60.00 and might extend gains.
Important Takeaways for WTI Crude Oil Price Analysis Today
- WTI Crude oil prices started a recovery wave above the $60.00 and $61.50 resistance levels.
- There was a break below a connecting bullish trend line with support at $63.00 on the hourly chart of XTI/USD at FXOpen.
Oil Price Technical Analysis
On the hourly chart of WTI Crude Oil at FXOpen, the price started a recovery wave from $58.40 against the US Dollar. The price gained bullish momentum after it broke the $60.00 resistance and the 50-hour simple moving average.
The bulls pushed the price above the $61.50 and $62.00 resistance levels. The recent high was formed at $64.20 and the price started a downside correction. There was a minor move below the 23.6% Fib retracement level of the upward move from the $59.87 swing low to the $64.18 high.
There was a break below a connecting bullish trend line with support at $63.00. The RSI is now below the 50 level. Immediate support on the downside is near the $62.0 zone or the 50% Fib retracement level of the upward move from the $59.87 swing low to the $64.18 high.
The next major support on the WTI crude oil chart is near the $61.50 zone, below which the price could test the $59.90 level. If there is a downside break, the price might decline toward $58.40. Any more losses may perhaps open the doors for a move toward the $56.20 support zone.
If the price climbs higher again, it could face resistance near $64.20. The next major resistance is near the $65.00 level. Any more gains might send the price toward the $68.50 level.
This article represents the opinion of the Companies operating under the FXOpen brand only. It is not to be construed as an offer, solicitation, or recommendation with respect to products and services provided by the Companies operating under the FXOpen brand, nor is it to be considered financial advice.

COLLECTING CONFLUENCE across multiple timeframes is your job!!!!All the information you need to find a high probability trade are in front of you on the charts so build your trading decisions on 'the facts' of the chart NOT what you think or what you want to happen or even what you heard will happen. If you have enough facts telling you to trade in a certain direction and therefore enough confluence to take a trade, then this is how you will gain consistency in you trading and build confidence. Check out my trade idea!!
www.tradingview.com

Potential bullish rise?WTI Oil (XTI/USD) has reacted off the pivot and could rise to the 1st resistance which is a pullback resistance.
Pivot: 62.09
1st Support: 58.07
1st Resistance: 66.63
Risk Warning:
Trading Forex and CFDs carries a high level of risk to your capital and you should only trade with money you can afford to lose. Trading Forex and CFDs may not be suitable for all investors, so please ensure that you fully understand the risks involved and seek independent advice if necessary.
Disclaimer:
The above opinions given constitute general market commentary, and do not constitute the opinion or advice of IC Markets or any form of personal or investment advice.
Any opinions, news, research, analyses, prices, other information, or links to third-party sites contained on this website are provided on an "as-is" basis, are intended only to be informative, is not an advice nor a recommendation, nor research, or a record of our trading prices, or an offer of, or solicitation for a transaction in any financial instrument and thus should not be treated as such. The information provided does not involve any specific investment objectives, financial situation and needs of any specific person who may receive it. Please be aware, that past performance is not a reliable indicator of future performance and/or results. Past Performance or Forward-looking scenarios based upon the reasonable beliefs of the third-party provider are not a guarantee of future performance. Actual results may differ materially from those anticipated in forward-looking or past performance statements. IC Markets makes no representation or warranty and assumes no liability as to the accuracy or completeness of the information provided, nor any loss arising from any investment based on a recommendation, forecast or any information supplied by any third-party.

USOIL: Bearish Continuation & Short Trade
USOIL
- Classic bearish pattern
- Our team expects retracement
SUGGESTED TRADE:
Swing Trade
Sell USOIL
Entry - 64.408
Stop - 66.133
Take - 60.964
Our Risk - 1%
Start protection of your profits from lower levels
❤️ Please, support our work with like & comment! ❤️
