US OILUS OIL is reaching towards important zone which can give us a good move to the upside after it sweeps OLD LOW
Related commodities

Crude oil---sell near 67.50, target 65.00-60.00Crude oil market analysis:
Crude oil has also started to fluctuate recently. Pay attention to the impact of contract delivery on the trend of crude oil. The daily line of crude oil does not show the strength of its rebound. In terms of operation, it is still a rebound sell. Crude oil continues to b

Crude oil------sell near 70.00, target 66.70-63.00Crude oil market analysis:
Recently, crude oil has been rising, and buying is slowly climbing, but the amplitude is not particularly large. The daily line has not formed a large buying pattern. It is currently a technical repair market after falling too much. Today's idea is to sell on the rebound.

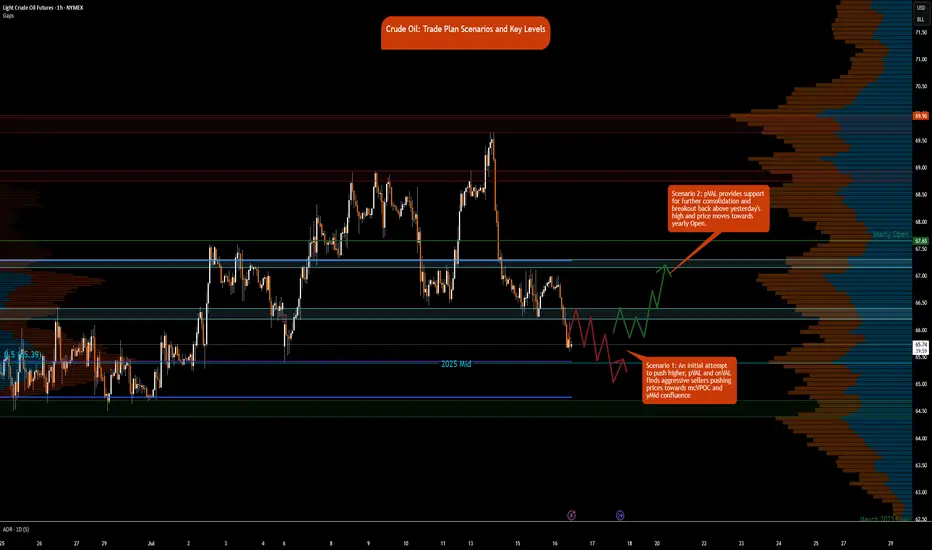
Crude Oil Trade Plan Scenarios and Key Levels
NYMEX:CL1!
It’s Wednesday today, and the DOE release is scheduled for 9:30 a.m. CT. This may provide fuel—pun intended—to push prices out of the two-day consolidation. Also, note that the August contract expires on July 22, 2025. Rollover to the September contract is expected on Thursday/Frida
WTI Crude Oil Reverses Lower Near $70 ResistanceA bearish engulfing candle has formed on the daily WTI crude oil chart, with its high perfectly respecting the 38.2% Fibonacci retracement just beneath the $70 handle. Given that the bounce from the June low has been relatively weak compared to the sharp decline from $78, I’m now on alert for a pote

WTI(20250716)Today's AnalysisMarket news:
① The annual rate of the overall CPI in the United States in June rose to 2.7%, the highest since February, in line with market expectations, and the monthly rate was 0.3%, the highest since January, in line with market expectations; the annual rate of the core CPI rose to 2.9%, the hi
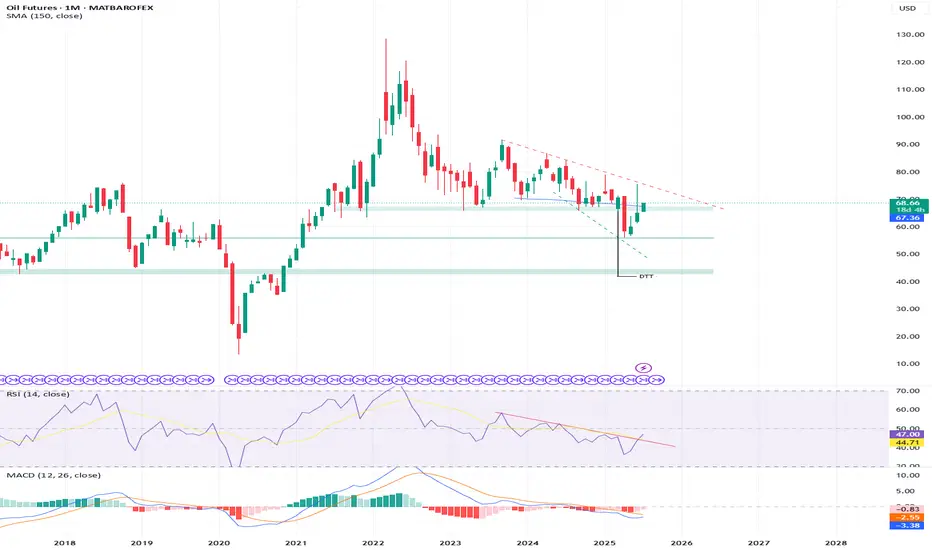
WTI Crude - Turning Bullish? Published as a supplementary analysis for BRENT CRUDE and LIOC, with further coverage to follow.
* WTI has successfully reclaimed its 4-year support line, which was breached in April 2025.
* The Monthly Momentum Indicator reveals a robust bullish breakout, signaling renewed strength.
* As long a
CL down sub $60 before moving up above $73Expected support or reversal zone based on last swing high for CL is at $60. This matches with 0.786 fib level of last move up, suggesting a standard SBS structure forming. Expecting a move up to at least $73 (fib 0.236), possibly also well beyond this.
Based on time fib of last swing high I expec

Crude Compression, Flagging Into Fire or FailureCrude Oil has been grinding higher within a clean rising wedge (bearish flag), forming within the aftermath of a strong sell-off. Price is now testing a key Intraday Fair Value Gap (1H FVG) inside a broader HTF Macro Supply Zone, while respecting a steep trend line of support.
This structure sets u

CL1! Short Setup – Fading Into Volume Shelf📉 CL1! Short Setup – Fading Into Volume Shelf
🔹 Context:
Price just tapped into a heavy upper volume shelf (68.35–68.50) — the exact area where the prior breakdown started. This zone aligns with rejection highs and the upper edge of the VRVP profile.
📌 Setup Logic:
🔺 Entry: 68.36–68.50 (in

See all ideas
Displays a symbol's price movements over previous years to identify recurring trends.