WADZ & the Petrodollar RevivalGlobal FX Shift: The Rise of WADZ (2025–2026)
In mid-2025, a war between Iran and Israel spirals fast. Iran strikes hard, Israel’s defenses go offline from cyberattacks, and the U.S. surprisingly doesn’t intervene.
Instead, America steps in quietly, setting up a “peacekeeping” zone along the Jordan-Israel border. It’s called the West Asia Demilitarized Zone (WADZ) — but behind the scenes, it’s about control, not peace.
Oil jumps to $115.
Markets flip. USD/JPY and USD/TRY spike. EUR/USD slides.
Then the U.S. launches WZ-Digital, a USD-backed oil coin. Now, all oil in the region trades through America.
OPEC fractures. Saudi and UAE fall in line.
China gets iced out. USD/CNY shoots past 8.30.
In the desert, a secret U.S. city appears: The Watchtower — a hub that manages oil, data, and borders.
Regional FX Snapshot (2026)
Europe: Gas crisis deepens. EUR/USD drops to 0.95. East Europe leans on U.S.
China: Crypto-oil push fails. Capital flight triggers USD/CNY → 8.80.
Russia: Oil-for-yuan helps short-term, but ruble stays shaky.
Africa: Egypt & Morocco adopt WZ-Digital. Local currencies stay weak.
Southeast Asia: Dual oil trade (USD/WZ). SGD steady, MYR & IDR choppy.
(BRICKS+)
Latin America: Brazil, Argentina resist — then cave. USD demand surges.
Bottom Line:
By end of 2026, USD isn’t just money — it’s a global system.
WADZ quietly reprograms the rules of energy and trade.
No invasion, no headlines. Just quiet, total control.
Bye guys
WTI1! trade ideas

Crude oil----Buy around 71.00-72.00, target 73.00-77.00Crude oil market analysis:
Last week's crude oil was very exaggerated because it broke the super suppression of 65.00 on the daily line. Once this position was broken, crude oil began to be standard. This is also the result of our many predictions of the cycle. Crude oil purchases will continue to soar this week. In addition, the escalation of the situation in the Middle East will make it difficult for crude oil to fall in the short term. I estimate that there is a possibility of repair. The retracement during the repair is our opportunity to buy again. In addition, the delivery period of crude oil futures contracts will also cause it to fluctuate violently again.
Fundamental analysis:
There are many fundamental analyses and data recently. Geopolitical factors are the main reason for its violent fluctuations. In addition, there is a holiday in the United States this week, and there is also a Federal Reserve interest rate result.
Operation suggestions:
Crude oil----Buy around 71.00-72.00, target 73.00-77.00

CL1! barking bearish trend. As observed in the weekly time frame, CL1 has broken a bearish trend that emerged after June 2022. Currently, CL1 exhibits bullish sentiment, and based on global news, it is likely to continue its upward trajectory.

ID: 2025 - 0146.16.2025
Trade #14 of 2025 executed.
Trade entry at 60 DTE (days to expiration).
BULLISH options trade executed on Crude Oil. Once price level of $75.00 gets taken out, this trade will get adjusted to secure a risk-free trade. Targets will be 100% ROI based upon this being a balanced bullish butterfly construct.
Defined risk
Defined reward
Happy Trading!
-kevin

Crude Oil - Cup and HandlePotential Cup and Handle
I have a trigger upper the top .. potential short before the new long wave
Actual we can have completed the 3 of 5.

Crude oil---Buy near 71.00, target 76.00-79.00Crude oil market analysis:
We still buy crude oil in the recent daily line, but yesterday's crude oil daily line closed with a big negative line. Short-term crude oil is about to start repairing. The retracement during the repair is our opportunity to buy again. Crude oil follows the long-term trend. In addition, the war between Iran and Israel is a long-term support for crude oil purchases. If the situation escalates, crude oil may easily stand above the 100 mark in the later period. Consider buying crude oil at 71.00 today.
Fundamental analysis:
Yesterday, Iran and Israel began to bomb each other again, and the situation began to escalate.
Operation suggestions:
Crude oil---Buy near 71.00, target 76.00-79.00

The Hidden Power of Median Price: A Recent Oil Market Case StudyIntroduction
In the world of trading, most market participants focus on popular patterns and oscillators, often missing the true “magnet” zones that drive price action. A recent move in Crude Oil (CL) perfectly illustrates how the prior year’s median price (PYM) can act as a powerful, objective key level—one that offers traders an informational edge when recognized and used properly.
Case Study: Oil’s Rally to the Prior Year Median
What Happened?
• Catalyst: Crude Oil (CL) surged several dollars overnight due to escalating geopolitical tensions and the risk of war in the Middle East.
• Key Level Test: Instead of stalling at arbitrary points, price rallied directly to the prior year’s median price—a level rarely plotted by standard indicators.
• Market Reaction: Upon reaching this PYM, oil rejected sharply not once, but twice in consecutive sessions, creating what many would recognize as a double top.
• Missed Context: While most traders saw only the double top pattern, those aware of the PYM understood the deeper reason for this reversal, adding conviction to their trade ideas.
Why the Median Price Matters
• Objective Anchor: The median price of the prior year is a statistically robust, non-arbitrary level that reflects the “center of gravity” for a full year’s worth of price action.
• Institutional Awareness: Professionals and trading algorithms often use these levels as reference points for liquidity and mean reversion, even if retail traders overlook them.
• Trade Conviction: When a double top or reversal forms at a prior year’s median price, it transforms a generic pattern into a high-conviction setup, providing a clear, data-driven reason for price to reverse or stall.
Data Snapshot: CL Price Action (June 2025)
Date High Low Close Event/Reaction
June 12, 2025 $77.52 $69.50 $73.96 Sharp rally to PYM, first rejection
June 14, 2025 $74.02 $71.48 $72.98 Second push, another rejection
June 15, 2025 $74.22 $73.19 $73.69 Double top confirmed
The $74–$77 area aligns with the 2024 median/average price for WTI crude oil, reinforcing its significance as a magnet and reversal zone.
Lessons for Traders
• Beyond Oscillators: Oscillators and generic chart patterns often lack context and can lead to false signals. Key levels like the median price explain why price reverses, not just where patterns form.
• Edge Through Awareness: Plotting prior year medians and other session-based key levels can turn ordinary setups into high-probability trades by revealing hidden order flow and institutional logic.
• Professional Mindset: Treating these levels as “market memory” aligns your approach with how professionals view the market, offering a real edge over retail-centric tools.
Conclusion
The recent oil rally and rejection at the prior year’s median price is a compelling demonstration of the power of objective, price-based key levels. While most traders saw only a double top, those aware of the PYM had a clear, data-driven reason for heightened conviction and precise execution. Incorporating such levels into your trading toolkit can provide a true informational edge—one that most indicator vendors and platforms still ignore.
Ready to take your trading to the next level? Start plotting median price levels and see the difference for yourself!

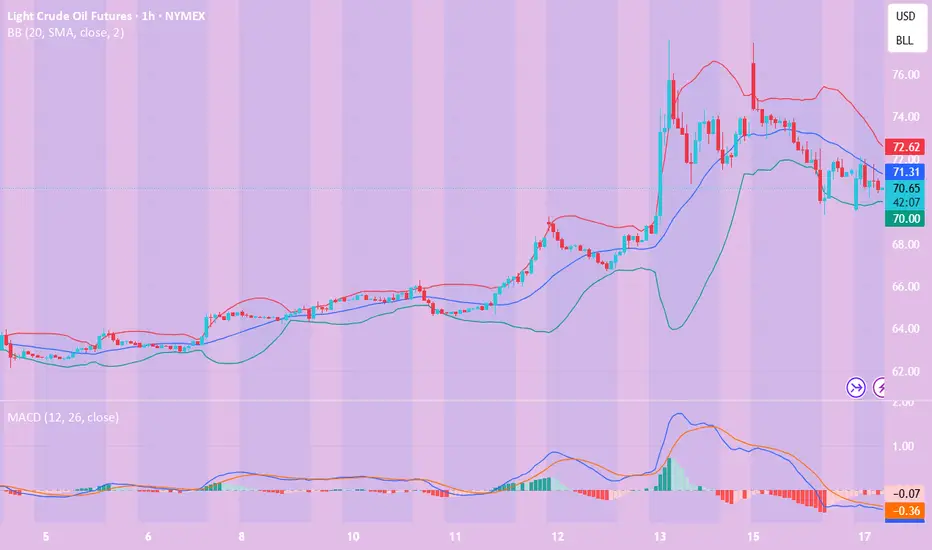
CL Futures Weekly Trade Setup — June 17, 2025🛢️ CL Futures Weekly Trade Setup — June 17, 2025
🎯 Instrument: CL (Crude Oil Futures)
📉 Strategy: Short Swing
📅 Entry Timing: Market Open
📈 Confidence: 68%
🔍 Model Insights Recap
🧠 Grok/xAI – Bearish due to overbought RSI + price stalling near MAs
🤖 Claude/Anthropic – Bearish pullback expected, despite recent strength
📊 Llama/Meta – Overextended Bollinger Band + RSI = short bias
🧬 DeepSeek – Supports downside via divergence + high volatility
⚠️ Gemini/Google – Bullish thesis based on momentum; diverges from consensus
📉 Consensus Takeaway
While short-term momentum is strong, most models forecast a pullback due to:
🔼 Overbought RSI readings
📈 Price extended well above key moving averages
🧨 High volatility and profit-taking zone near $73–$74
✅ Recommended Trade Setup
Metric Value
🔀 Direction Short
🎯 Entry Price $72.65
🛑 Stop Loss $74.20
🎯 Take Profit $68.80
📏 Size 1 contract
📈 Confidence 68%
⏰ Timing Market Open
⚠️ Key Risks & Considerations
🌍 Geopolitical events or OPEC news can cause unexpected surges
📉 If bullish momentum resumes, upside breakout could invalidate short thesis
📏 Risk management is critical—stick to stop-loss if price breaks above $74.20
🧾 TRADE_DETAILS (JSON Format)
json
Copy
Edit
{
"instrument": "CL",
"direction": "short",
"entry_price": 72.65,
"stop_loss": 74.20,
"take_profit": 68.80,
"size": 1,
"confidence": 0.68,
"entry_timing": "market_open"
}
💡 Watch price action at the open. If oil opens weak or fails to reclaim $73, this short setup has a strong edge.

Geopolitics (Iran/Israel), 6 relevant risk barometersGeopolitics is in the spotlight this week, along with the FED's monetary policy decision. Geopolitical news is covered by the general media, so there's no need here to repeat information that's accessible to everyone. We therefore propose to review our selection of stock market barometers which, in our opinion, best measure the intensity of geopolitical risk.
1) Oil and natural gas prices
Naturally, oil price trends are the main barometer of the geopolitical risk of the current confrontation between Israel and Iran. Although Iran accounts for just 3% of the world's oil supply, the region itself represents 20%, and above all there is a risk of closure of the Strait of Hormuz, through which 25% of the world's oil supply passes. Technical analysis of the oil price is therefore the primary tool for measuring the intensity of current geopolitical tensions. The price of oil recently returned to the former technical support of $65, but there is no major bullish technical signal as long as the price of US crude oil remains below resistance at $80. We must therefore keep a close eye on the $80 threshold for US oil.
2) The trend of the S&P 500 index, the benchmark of Western finance
The equity market is the second barometer of geopolitical risk that we offer. The most important thing is to select the stock indices that best represent the perception of geopolitical tensions. We believe that the S&P 500 future contract does this job well, as it is the most widely traded stock market futures index in terms of volume by global high finance.
A few days ago, we published a detailed graphical analysis of the S&P500 index, which you can consult by clicking on the image below.
3) Trends on the main stock markets in the Near and Middle East
Equity markets in the Near and Middle East are excellent indicators of the current perception of geopolitical tensions between Iran and Israel. We suggest you take a look at the Saudi Arabian Stock Exchange (Tadawul), the region's largest in terms of market capitalization. Naturally, you should also follow the trend of the Tel Aviv Stock Exchange's flagship index, the TA 35, as well as that of the Egyptian stock market. These markets have the advantage of being open on Sundays, and are often a good early indicator of trends in Asia and Europe for Monday morning.
4) The trend of the US dollar (DXY) on the foreign exchange market (Forex) and of gold on the commodities market
On the floating foreign exchange market (FX), it is the US dollar that plays to the full its safe-haven aspect. In the event of geopolitical tensions spiraling out of control, it would make a strong bullish reversal. This week, however, the US dollar will be under the influence of the FED.
So it's best to trust gold's trend as a barometer of geopolitical risk. Geopolitics is not necessarily the dominant fundamental factor, but rather the dynamics of interest rates and the US dollar.
5) The TRUFLATION trend
If current geopolitical tensions were to become a major global shock, international trade would be disrupted, and transport difficulties would lead to a sharp rise in prices, particularly for raw materials and industrial goods. This potential price rise would then be rapidly reflected in TRUFLATION, the benchmark for real-time price dynamics in the USA.
DISCLAIMER:
This content is intended for individuals who are familiar with financial markets and instruments and is for information purposes only. The presented idea (including market commentary, market data and observations) is not a work product of any research department of Swissquote or its affiliates. This material is intended to highlight market action and does not constitute investment, legal or tax advice. If you are a retail investor or lack experience in trading complex financial products, it is advisable to seek professional advice from licensed advisor before making any financial decisions.
This content is not intended to manipulate the market or encourage any specific financial behavior.
Swissquote makes no representation or warranty as to the quality, completeness, accuracy, comprehensiveness or non-infringement of such content. The views expressed are those of the consultant and are provided for educational purposes only. Any information provided relating to a product or market should not be construed as recommending an investment strategy or transaction. Past performance is not a guarantee of future results.
Swissquote and its employees and representatives shall in no event be held liable for any damages or losses arising directly or indirectly from decisions made on the basis of this content.
The use of any third-party brands or trademarks is for information only and does not imply endorsement by Swissquote, or that the trademark owner has authorised Swissquote to promote its products or services.
Swissquote is the marketing brand for the activities of Swissquote Bank Ltd (Switzerland) regulated by FINMA, Swissquote Capital Markets Limited regulated by CySEC (Cyprus), Swissquote Bank Europe SA (Luxembourg) regulated by the CSSF, Swissquote Ltd (UK) regulated by the FCA, Swissquote Financial Services (Malta) Ltd regulated by the Malta Financial Services Authority, Swissquote MEA Ltd. (UAE) regulated by the Dubai Financial Services Authority, Swissquote Pte Ltd (Singapore) regulated by the Monetary Authority of Singapore, Swissquote Asia Limited (Hong Kong) licensed by the Hong Kong Securities and Futures Commission (SFC) and Swissquote South Africa (Pty) Ltd supervised by the FSCA.
Products and services of Swissquote are only intended for those permitted to receive them under local law.
All investments carry a degree of risk. The risk of loss in trading or holding financial instruments can be substantial. The value of financial instruments, including but not limited to stocks, bonds, cryptocurrencies, and other assets, can fluctuate both upwards and downwards. There is a significant risk of financial loss when buying, selling, holding, staking, or investing in these instruments. SQBE makes no recommendations regarding any specific investment, transaction, or the use of any particular investment strategy.
CFDs are complex instruments and come with a high risk of losing money rapidly due to leverage. The vast majority of retail client accounts suffer capital losses when trading in CFDs. You should consider whether you understand how CFDs work and whether you can afford to take the high risk of losing your money.
Digital Assets are unregulated in most countries and consumer protection rules may not apply. As highly volatile speculative investments, Digital Assets are not suitable for investors without a high-risk tolerance. Make sure you understand each Digital Asset before you trade.
Cryptocurrencies are not considered legal tender in some jurisdictions and are subject to regulatory uncertainties.
The use of Internet-based systems can involve high risks, including, but not limited to, fraud, cyber-attacks, network and communication failures, as well as identity theft and phishing attacks related to crypto-assets.

WTI(20250617)Today's AnalysisMarket news:
Revised version of the Republican tax cut bill in the US Senate: It is planned to raise the debt ceiling to 5 trillion, and the overall framework is consistent with the House version.
Technical analysis:
Today's buying and selling boundaries:
70.41
Support and resistance levels:
75.98
73.90
72.55
68.27
66.92
64.84
Trading strategy:
If the price breaks through 72.55, consider buying, and the first target price is 73.90
If the price breaks through 70.41, consider selling, and the first target price is 68.27
Oil Rebounds to $59 as US Inventories Drop – Reversal Ahead?After recent declines, crude oil futures (CL1!) staged a modest recovery during Thursday’s session, trading near $59.10 per barrel. The rebound comes as US crude inventories unexpectedly dropped, easing concerns about oversupply and providing a short-term lift to prices.
Key Drivers Behind the Rebound
US Inventory Drawdown – The latest EIA report showed a decline in crude stockpiles, signaling stronger demand and helping prices stabilize.
Technical Support Holds Firm – The bounce aligns with a critical daily demand zone, which previously acted as a strong support level on the weekly chart.
Market Sentiment Shifts – While retail traders remain bearish, commercial traders (often considered "smart money") are increasing long positions, hinting at a potential trend reversal.
Traders should watch for follow-through buying to confirm whether this is a short-term correction or the start of a larger reversal.
Bottom Line: Oil’s rebound is fueled by fundamentals (lower inventories) and technicals (strong demand zone). With commercial traders betting on higher prices, the stage may be set for a bullish reversal—if buyers sustain momentum.
✅ Please share your thoughts about CL1! in the comments section below and HIT LIKE if you appreciate my analysis. Don't forget to FOLLOW ME; you will help us a lot with this small contribution.

WTI(20250616)Today's AnalysisMarket news:
Trump: The United States may still intervene in the Iran-Israel conflict. If Iran launches an attack on the United States, the United States will "fight back with all its strength on an unprecedented scale." Iran and Israel should reach an agreement.
Technical analysis:
Today's buying and selling boundaries:
71.11
Support and resistance levels:
78.59
75.79
73.98
68.24
66.43
63.64
Trading strategy:
If the price breaks through 73.98, consider buying in, the first target price is 75.79
If the price breaks through 71.11, consider selling in, the first target price is 68.24

Crude Oil - we follow up with the momenetumCrude Oil Analysis: Why Prices Could Keep Rising Amid Israel-Iran Conflict? 🛢 🛢 🛢
📈 📈 📈The ongoing tensions between Israel and Iran have significantly intensified geopolitical risk in the Middle East—home to a third of the world’s oil supply. As hostilities escalate, crude oil prices are poised for continued upward momentum due to three key factors:
1️⃣ Supply Disruption Fears: The Strait of Hormuz, a critical chokepoint through which 20% of global oil flows, could be compromised if Iran retaliates or is targeted more directly. Any disruption—even speculative—typically sends prices higher.
2️⃣ Production Uncertainty: Iran, a major OPEC member, may face new sanctions or physical damage to infrastructure. In retaliation, Iran could also target regional energy infrastructure, including in the UAE or Saudi Arabia, shrinking global supply.
3️⃣ Market Sentiment and Risk Premiums: Investors tend to price in risk quickly. With oil markets already tight due to OPEC+ cuts and tepid U.S. production growth, heightened instability adds a strong speculative premium.
Bottom Line: Unless the Israel-Iran conflict de-escalates, crude oil has a strong bullish case. With limited spare capacity globally and increased geopolitical fragility, expect prices to remain elevated or climb further—especially if rhetoric turns into regional escalation. 💡 💡
📌 Trade plan
⬇️ Entry : On market open
✅Target : 79.00
❌SL: 64.00

#202524 - priceactiontds - weekly update - wti crude oil futuresGood Day and I hope you are well.
comment: Good week for oil bulls but still a lower high below the April high 78.1. Now what? If this buying is the real thing and market is expecting higher prices for longer, the pullback will stay above 70. If bulls do that, we can expect at least a second leg up to retest 75+ or even 80+. We are seeing a full on war between Israel and Iran but you should not trade based on that. There are bulls who bought above 73 on Friday and lost Money so far.
current market cycle: trading range 54 - 78 on the weekly tf. Decent chance we are in a bull trend that could lead to 80/84 or higher.
key levels: 70 - 77
bull case: Bulls have all the arguments on their side. They now need to leave a big open gap to 69.3 and then we can do a measured move up. My lowest target for that is 80. Structure on the 1h chart is a textbook two-legged pullback and above 74.5 it’s a clear buy signal.
Invalidation is below 70.8 but can likely also be 70
bear case: Bears do not have much. They trapped late bulls on Friday and that’s a likely reason we sold off 677 ticks from the high. They need lower lows below 70.8 and close the gap to the Thursday high before the news-bomb hit. For that to happen they have to break 2 bull trend lines. I will not look for shorts on this tbh.
Invalidation is above 74.5
short term: Bullish. Maybe a bit more sideways but I have given two invalidation prices for bulls and couple of targets above. I don’t think looking for shorts makes any sense unless you are really good at scalping.
medium-long term - Update from 2025-06-15: Maybe we have seen the 2-year trading range coming to an end on Friday and we are in a new bull trend that could lead oil to 80 or higher. Right now it’s pure guesswork until we print higher highs above Friday’s 77.62. Oil above 80 is not something we have seen since end of 2023 so expect some ripples.

CL ready for new move upBased on time fib and Feigenbaum constants, CL is closing in on the bottom for this swing, expected within marked timezone. The swing highs/lows follows the Feigenbaum projections for the last few swings. I expect a dip below $57 before a new run higher, at least to $72-73.

Oil | Long | Smart Money Accumulation | (June 2025)Oil | Long | Geopolitical Conflict & Smart Money Accumulation | (June 2025)
1️⃣ Short Insight Summary:
We're watching a long-term bullish setup in crude oil, driven by rising geopolitical tensions, smart money accumulation, and a potential reclaim of key levels from a historic triangle pattern.
2️⃣ Trade Parameters:
Bias: LongEntry: Watching for a reclaim of the $72 level (re-entry into triangle zone)Stop Loss: $62 (just below the recent liquidation zone)
TP1: $106
TP2: $116
TP3: $123
3️⃣ Key Notes:
This setup originates from a macro triangle structure formed since September 2012. Oil broke out post-2020 and surged, but recent volatility has shaken out many long positions—especially those from around $60.8. A reclaim of $72 would indicate a failed auction and potential continuation higher.
Geopolitical instability—particularly in the Middle East—continues to provide bullish tailwinds. JPMorgan has projected potential upside targets as high as $230 if tensions escalate.
The Volatility Index (VIX) is around 19, suggesting a calm market—often a precursor to strong directional moves. Smart money seems to be stepping in, accumulating positions during dips.
✅ This confluence makes oil a compelling candidate for macro upside, especially if global uncertainty deepens.
4️⃣ Optional Follow-up Note:
If the setup confirms, I’ll update this idea with revised targets and entry levels. Keep an eye on geopolitical developments—they’ll be key triggers.
Please LIKE 👍, FOLLOW ✅, SHARE 🙌 and COMMENT ✍ if you enjoy this idea! Also share your ideas and charts in the comments section below! This is best way to keep it relevant, support us, keep the content here free and allow the idea to reach as many people as possible.
Disclaimer: This is not a financial advise. Always conduct your own research. This content may include enhancements made using AI.

Crude Oil - Two Scenarios and about Brain PowerPrice retests the L-MLH.
VI. - Price breaks upward, target is the centerline
VII. - Price reverses again, then the target is the 1/4 line, with a subsequent extended target at the red centerline, and possibly even lower at the white dashed warning line.
On a personal note:
I was once again told that the price didn’t do what I had projected.
...yeah, really, that’s how it is §8-)
After over 30 years in the markets and hundreds of coaching sessions, I’m still amazed that people think you can predict price movements as if with a magic crystal ball.
The fact that this belief still persists (even though they don’t understand even the absolute basics of trading) deeply concerns me at the core of my trading soul.
Because this growing irrationality clearly indicates that far too little is being done in terms of education – or humanity might simply go extinct in the next 100 years due to rapidly declining intelligence!
...maybe I should just create a chart and apply a few median lines/forks?
Happy trading to all of you and I pray for those with lesser brain power.

Oil Market on Edge Any disruption to Iranian oil supply could prompt OPEC to boost output quickly, says ING's Warren Patterson. But there's a limit to how much the cartel can buffer the market—especially if tensions escalate in the Persian Gulf, where most of OPEC's 5M bbl/day spare capacity sits.
🛢️ The Strait of Hormuz is critical—any supply shock here could trigger a global response to secure energy flows.
📈 Crude has spiked after the surprise attack, testing key resistance at $76.90–$80.77 (200-week MA). A break above? Eyes shift to $95. Support? Watch $68.58—200-day MA.
Volatility is back. Keep your eyes on the charts and the geopolitics. 🌍📊
Disclaimer:
The information posted on Trading View is for informative purposes and is not intended to constitute advice in any form, including but not limited to investment, accounting, tax, legal or regulatory advice. The information therefore has no regard to the specific investment objectives, financial situation or particular needs of any specific recipient. Opinions expressed are our current opinions as of the date appearing on Trading View only. All illustrations, forecasts or hypothetical data are for illustrative purposes only. The Society of Technical Analysts Ltd does not make representation that the information provided is appropriate for use in all jurisdictions or by all Investors or other potential Investors. Parties are therefore responsible for compliance with applicable local laws and regulations. The Society of Technical Analysts will not be held liable for any loss or damage resulting directly or indirectly from the use of any information on this site.

CL - Crude Oil - long strategyCL - Crude Oil - long strategy
RSI confirmed potential new long opportunities
H&S reversal pattern
There are conditions for inversion

Chasing Oil Spikes? How Geopolitics Can Wreck SetupsOil prices surged over 12% in Asia on Middle East headlines, sparking a surge of volatility across safe-haven currencies and stock market futures during thin trade.
It felt like a good time to provide food for thought to newer traders looking to chase these moves, highlight the mockery geopolitics can make of technical analysis with recent examples, and provide a filter for when the waters may be safer to reenter.
Matt Simpson, Market Analyst at City Index and Forex.com

crude oil on good pattern formation crude oil on good pattern formation , entry with minor sl can deliver good R:R
(6100-6200) can be a good stand for near term

WTI(20250613)Today's AnalysisMarket news:
The number of initial jobless claims in the United States for the week ending June 7 was 248,000, higher than the expected 240,000, the highest since the week of October 5, 2024. The monthly rate of the core PPI in the United States in May was 0.1%, lower than the expected 0.30%. Traders once again fully priced in the Fed's two interest rate cuts this year.
Technical analysis:
Today's buying and selling boundaries:
66.96
Support and resistance levels:
69.10
68.30
67.78
66.13
65.61
64.81
Trading strategy:
If the price breaks through 67.78, consider buying in, and the first target price is 68.30
If the price breaks through 66.96, consider selling in, and the first target price is 66.13

Light Crude Oil Futures will dump between 61.16 and 57.55 (-15%)CL1! In the monthly timeframe is showing strong selling side that will lead the price between the region of 57.55 and 61.16 that is the value area low from march20 and the fibonacci 61.8% from the same low.
