Crude oil----sell near 64.00, target 63.00-60.00Crude oil market analysis:
Yesterday's crude oil still failed to rise. The buying price still failed to stand above 65.00 and was still fluctuating. Today, we continue to look at the range wave. We still consider selling it when it is close to 64. The crude oil inventory data does not give us much room for imagination. In addition, the recent fundamentals of crude oil are not strong, and they do not support the long position of crude oil, which has caused crude oil to fluctuate and hover. The current fluctuation range we see is 65.00-60.00.
Operation suggestions:
Crude oil----sell near 64.00, target 63.00-60.00
WTI1! trade ideas

Liquidity Hunt: Crude Oil's Next TargetFenzoFx—Crude Oil remains below the $64.19 resistance level. The Stochastic Oscillator is in overbought territory, and RSI 14 signals bearish divergence, suggesting a possible price dip.
Oil could briefly surpass $64.19 to grab liquidity before facing selling pressure. In this case, a drop toward the $61.72 support level may occur to fill the bullish fair value gap.
However, if Oil stabilizes above $64.19, the bearish outlook becomes invalid.
>>> Trade Crude Oil without swap and low spread at FenzoFx

Crude oil futures Trade the range In this video I look at the current range that we are in and I have laid out a plan in the scenario that we break that range to the upside and what we could possibly expect .
I have given some reaction zones where I anticipate price to react when we reach there .
I have used Fibonacci, volume profile, and vwap in this video .
Thankyou for your support


#202522 - priceactiontds - weekly update - wti crude oil futuresGood Day and I hope you are well.
comment: 3 weeks inside a tight range but market keeps getting rejected under the weekly 20ema and it’s consecutive bear bars now. Below 59.8 I favor the bears for more downside.
current market cycle: monthly time frame is a broad bear channel - weekly tf is a bear wedge - daily is a trading range
key levels: 55 - 64
bull case: Bulls need a daily close above 64 to retest the bear trend line of this big bear wedge from the January high 78.1. That’s the whole story for now. Market oscillates around 61 without any momentum, so buy low, sell high until it stops working.
Invalidation is below 59.8.
bear case: Bears need a daily close below 59.8 for more downside but market has been pretty much in balance for 3 weeks around 61. Problem for the bulls is, that we closed lower again and the tails above the weekly bars are much bigger than the ones below bars. So bears are slightly favored but only very slightly.
Invalidation is above 64.4
short term: Neutral. Playing the range until it stops working but mostly only small scalps. Market is likely waiting for an end to the tariff madness which might not come.
medium-long term - Update from 2025-05-25: Need a clear break of the trading range 54 - 64 before we can come up with new targets. Bear trend (wedge) is valid until the trend line breaks.

Oil Bears May Look to PounceCrude oil futures have teetered for weeks, and the bears may be getting ready to pounce.
The first pattern on today’s chart is the sharp drop in early April after President Trump announced higher-than-expected tariffs. CL1! quickly broke the 65.27 level where it bounced in September and early March. Prices have stayed there since, which may reflect a lack of buying interest.
Second is the recent consolidation zone above the May 8 high of 60.29. Could a close below that level trigger selling?
Third, prices have remained consistently below their 50-day simple moving average since early February. That may suggest the intermediate-term trend is bearish.
Finally, the 8-day exponential moving average (EMA) recently crossed below the 21-day EMA. That may suggest the short-term trend is getting bearish.
These patterns could be important to watch heading into this weekend’s OPEC+ meeting.
Check out TradingView's The Leap competition sponsored by TradeStation.
TradeStation has, for decades, advanced the trading industry, providing access to stocks, options and futures. If you're born to trade, we could be for you. See our Overview for more.
Past performance, whether actual or indicated by historical tests of strategies, is no guarantee of future performance or success. There is a possibility that you may sustain a loss equal to or greater than your entire investment regardless of which asset class you trade (equities, options or futures); therefore, you should not invest or risk money that you cannot afford to lose. Online trading is not suitable for all investors. View the document titled Characteristics and Risks of Standardized Options at www.TradeStation.com . Before trading any asset class, customers must read the relevant risk disclosure statements on www.TradeStation.com . System access and trade placement and execution may be delayed or fail due to market volatility and volume, quote delays, system and software errors, Internet traffic, outages and other factors.
Securities and futures trading is offered to self-directed customers by TradeStation Securities, Inc., a broker-dealer registered with the Securities and Exchange Commission and a futures commission merchant licensed with the Commodity Futures Trading Commission). TradeStation Securities is a member of the Financial Industry Regulatory Authority, the National Futures Association, and a number of exchanges.
TradeStation Securities, Inc. and TradeStation Technologies, Inc. are each wholly owned subsidiaries of TradeStation Group, Inc., both operating, and providing products and services, under the TradeStation brand and trademark. When applying for, or purchasing, accounts, subscriptions, products and services, it is important that you know which company you will be dealing with. Visit www.TradeStation.com for further important information explaining what this means.

CL Trade Idea – Waiting for Buy Reaction in Demand Zonem currently watching Crude Oil Futures (CL) closely.
Price has broken below my EMA and is heading toward the demand zone marked in green . I’m not rushing in — waiting patiently for price to reach that zone and give me a reaction.
📌 What I'm Looking For:
A clear bullish reaction within the zone.
Volume confirmation showing buyer intent.
Order flow alignment (buyers stepping in, absorption, or reversal signs on the tape).
If all three line up, I’ll look for a long entry from that area targeting previous resistance levels.
Let’s see if buyers show up at the right spot. No confirmation = no trade.

Crude Oil is in Buy Side Discount LevelFenzoFx—Crude Oil formed a hammer candlestick pattern near weekly support after losing 4.0% of its value on Thursday. The London session began with a bullish FVG in the lower time frame, with support at $60.55.
The price is expected to target the immediate resistance at $61.3.

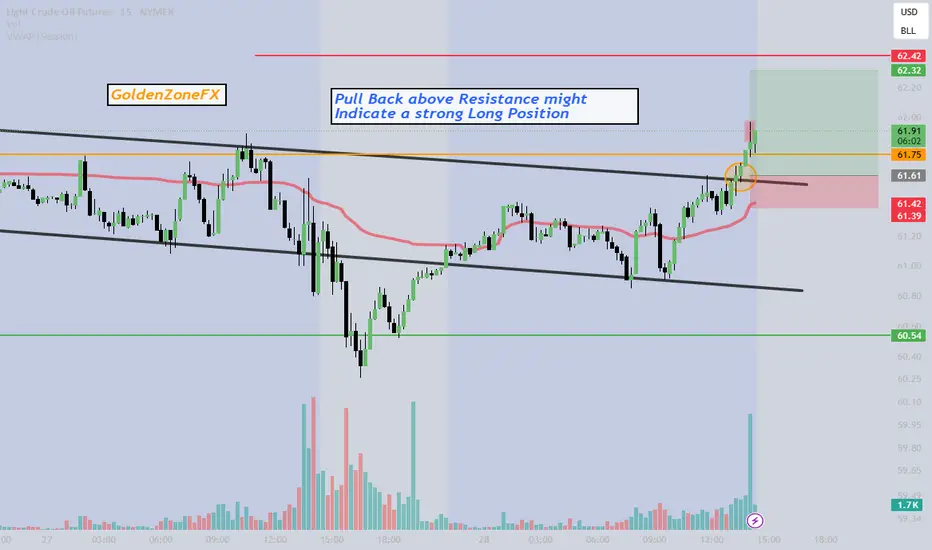
CL1 Breakout & Pullback Above Resistance – Strong Buy Signal ?The price has broken above the $61.75 resistance and successfully pulled back to retest it as support, confirming a strong buy opportunity.
Key Confirmations:
Breakout above resistance: Signals bullish strength.
Pullback retest: Former resistance now acting as support.
Volume surge: High buying interest reinforces the move.
VWAP positioning: Trading well above VWAP ($61.36), favoring bulls.
Profit Zone: Green-marked target area for potential upside.
Stop-Loss Consideration: Manage risk with a stop in the red-marked zone.
Trade Idea: If momentum holds, this setup could lead to a continued uptrend. Watch price action near support to confirm further movement.
Follow @GoldenZoneFX for more content and valuable insights!
What do you think? Let’s discuss this setup!
CL Analysis – May 28, 2025Currently, I believe Crude Oil (CL) is trading within a well-defined range. My strategy is clear:
🔴 Sell only at the red supply zone above, but only after confirmed seller reactions backed by order flow.
🟢 Buy only at the green demand zone below, once buyer strength is confirmed through price action and order flow.
No trades in between — I’m staying patient and letting the market come to my levels.

crude bulloversold sold rsi on the bottom of a strong wedge... strong support on the lows. looking to long crude

The Holy Trinity Gold Btc Up
Oi Down
Smells like OiL and Gold is under the custody of KREMLiN
playing GOD
GOLd drops oil should skyrocket
and BTC just follow a week or so later

CL Futures Outlook May 27, 2025 Compression Near Structure ZonesToday, CL is trading just above a key mid-structure zone, continuing its sideways movement between defined supply and demand levels.
🔹 Current Technical Picture:
Price remains inside a compression range
Resistance at the top red zone where price was rejected yesterday
Mid green zone acting as current structure support
Lower green zone marked by last week's strong buyer reaction
Volume profile is neutral, showing no aggressive buyer or seller dominance at the moment. A failed breakout attempt above the descending channel in the previous session keeps this structure coiled and reactive.
🔍 My Outlook:
If price retests the middle zone with strong volume + bullish reaction, it could offer a continuation toward resistance.
If price climbs into the red zone and rejects with weakness, there’s potential for a move back toward the middle zone.
A sharp drop into the lower green zone with strong buyer confirmation would create a high-reward reversal opportunity.
No trades are taken blindly. I only act when price shows clear intent at key levels. Today is a reactive environment — not one for forced setups.
📉 Analysis based on volume structure, order flow, and key S/R zones.
⚠️ This post is for educational purposes only and does not constitute financial advice. Trading futures involves risk.


OPEC Countdown: Inverted H&S Signals Potential Oil Price Rise🧭 Market Context – OPEC in Focus
As Crude Oil Futures (CL) grind in tight consolidation, the calendar reminds traders that the next OPEC meeting takes place on May 28, 2025. This is no ordinary headline event — OPEC decisions directly influence global oil supply. From quota adjustments to production cuts, their moves can rapidly shift price dynamics across energy markets. Every tick in crude oil reflects not just current flows but also positioning ahead of such announcements.
OPEC — the Organization of the Petroleum Exporting Countries — coordinates oil policy among major producers. Its impact reverberates through futures markets like CL and MCL (Micro Crude), where both institutional and retail traders align positions weeks in advance. This time, technicals are speaking loud and clear.
A compelling bottoming structure is taking shape. The Daily timeframe reveals an Inverted Head and Shoulders pattern coinciding with a bullish flag, compressing into a potential breakout zone. If momentum confirms, CL could burst into a trend move — just as OPEC makes its call.
📊 Technical Focus – Inverted H&S + Flag Pattern
Price action on the CL daily chart outlines a classic Inverted Head and Shoulders — a reversal structure that traders often monitor for high-conviction setups. The neckline sits at 64.19, and price is currently coiled just below it, forming a bullish flag that overlaps with the pattern’s right shoulder.
What makes this setup powerful is its precision. Not only does the flag compress volatility, but the symmetry of the shoulders, the clean neckline, and the breakout potential align with high-quality chart pattern criteria.
The confirmation of the breakout typically requires trading activity above 64.19, which would trigger the measured move projection. That target? Around 70.59, which is near a relevant UFO-based resistance level — a region where sellers historically stepped in with force (UnFilled Orders to Sell).
Importantly, this bullish thesis will fail if price drops below 60.02, the base of the flag. That invalidation would potentially flip sentiment and set up a bearish scenario with a target near the next UFO support at 53.58.
To properly visualize the dual scenario forming in Crude Oil, a multi-timeframe approach is often very useful as each timeframe adds clarity to structure, breakout logic, and entry/exit positioning:
Weekly Chart: Reveals two consecutive indecision candles, reflecting hesitation as the market awaits the OPEC outcome.
Daily chart: Presents a MACD bullish divergence, potentially adding strength to the reversal case.
Zoomed-in 4H chart: Further clarifies the boundaries of the bullish flag.
🎯 Trade Plan – CL and MCL Long/Short Scenarios
⏫ Bullish Trade Plan:
o Product: CL or MCL
o Entry: Break above 64.19
o Target: 70.59 (UFO resistance)
o Stop Options:
Option A: 60.02 (tight, under flag)
Option B: ATR-based trailing stop
o Ideal for momentum traders taking advantage of chart pattern combined with fundamental data coming out of an OPEC meeting
⏬ Bearish Trade Plan:
o Trigger: Break below 60.02
o Target: 53.58 (UFO support)
o Stop Options:
Option A: 64.19 (tight, above flag)
Option B: ATR-based trailing stop
o Ideal for momentum traders fading pattern failures
⚙️ Contract Specs – CL vs MCL
Crude Oil can be traded through two futures contracts on CME Group: the standard CL (WTI Crude Oil Futures) and the smaller-sized MCL (Micro WTI Crude Oil Futures). Both offer identical tick structures, making MCL a powerful instrument for traders needing more flexibility in position sizing.
CL represents 1,000 barrels of crude per contract. Each tick (0.01 move) is worth $10, and one full point of movement equals $1,000. The current estimated initial margin required to trade one CL contract is approximately $6,000 per contract, although this may vary based on market volatility and brokerage terms.
MCL, the micro version, represents 100 barrels per contract — exactly 1/10th the size of CL. Each 0.01 tick move is worth $1, with one point equaling $100. The estimated initial margin for MCL is around $600, offering traders access to the same technical setups at significantly reduced capital exposure.
These two contracts mirror each other tick-for-tick. MCL is ideal for:
Testing breakout trades with lower risk
Scaling in/out around events like OPEC
Implementing precise risk management strategies
Meanwhile, CL provides larger exposure and higher dollar returns but requires tighter control of risk and account drawdowns. Traders can choose either—or both—based on their strategy and account size.
🛡️ Risk Management – The Foundation of Survival
Technical setups don’t make traders profitable — risk management does.
Before the OPEC meeting, traders must be aware that volatility can spike, spreads may widen, and whipsaws can invalidate even the cleanest chart pattern.
That’s why stop losses aren’t optional — they’re mandatory. Whether you choose a near level, a deeper stop below the head, or an ATR-based trailing method, the key is clear: define risk before entry.
MCL helps mitigate capital exposure for those testing breakout confirmation. CL demands higher margin and greater drawdown flexibility — but offers bigger tick rewards.
Precision also applies to exits. Targets must be defined before entry to maintain reward-to-risk discipline. Avoid adding to losers or chasing breakouts post-event.
And most importantly — never hold a losing position into an event like OPEC, hoping for recovery. Risk is not a gamble. It’s a calculated variable. Treat it with respect.
When charting futures, the data provided could be delayed. Traders working with the ticker symbols discussed in this idea may prefer to use CME Group real-time data plan on TradingView: www.tradingview.com - This consideration is particularly important for shorter-term traders, whereas it may be less critical for those focused on longer-term trading strategies.
General Disclaimer:
The trade ideas presented herein are solely for illustrative purposes forming a part of a case study intended to demonstrate key principles in risk management within the context of the specific market scenarios discussed. These ideas are not to be interpreted as investment recommendations or financial advice. They do not endorse or promote any specific trading strategies, financial products, or services. The information provided is based on data believed to be reliable; however, its accuracy or completeness cannot be guaranteed. Trading in financial markets involves risks, including the potential loss of principal. Each individual should conduct their own research and consult with professional financial advisors before making any investment decisions. The author or publisher of this content bears no responsibility for any actions taken based on the information provided or for any resultant financial or other losses.

Sell Cruide Oil Ladies & gentlemen,
We have an opportunity to sell WTI—small stop loss with big targets.
Good Luck
#202521 - priceactiontds - weekly update - wti crude oil futuresGood Day and I hope you are well.
comment: The past week we saw 3 tries by the bulls to push above 63 and they found no acceptance. I got trapped once because the spike looked so strong but it got zero follow-through. Markets will only try one direction so many times before they try the other one.
current market cycle: monthly time frame is a broad bear channel - weekly tf is a bear wedge - daily is a trading range
key levels: 55 - 63
bull case: Bulls need to stay above 60 or risk that the market tries back down to 56 or lower. If they can go sideways inside the given range, the better and if we hit 63 enough, it will break. Problem for them is, they tried couple of times now and the odds that 60 breaks are bigger than the breakout above 63. Friday was strong enough to expect not a big bear day on Monday but I am not eager to buy this.
Invalidation is below 59.8.
bear case: Bears need a stronger break below 59.8 for more downside and they need to make a lower high below 62. That’s the whole story. They are slightly favored since we are at the top of the current range that has been going on for almost 2 months now. They have defended the bear gap up to 64.5 more than 5 times.
Invalidation is above 64.4
short term: Neutral. Shorts closer to 63 are good or on a clear break below 59.8. No interest in buying up here unless bulls do something big above 64.4 and break the bear trend line.
medium-long term - Update from 2025-05-25: Need a clear break of the trading range 54 - 64 before we can come up with new targets. Bear trend is valid until the trend line breaks.

Weekly Walkthrough on Currencies & CommoditiesCovering weekly price action on majors and other assets. Outlined the weekly displacements along with proper reasoning. Go ahead check it out

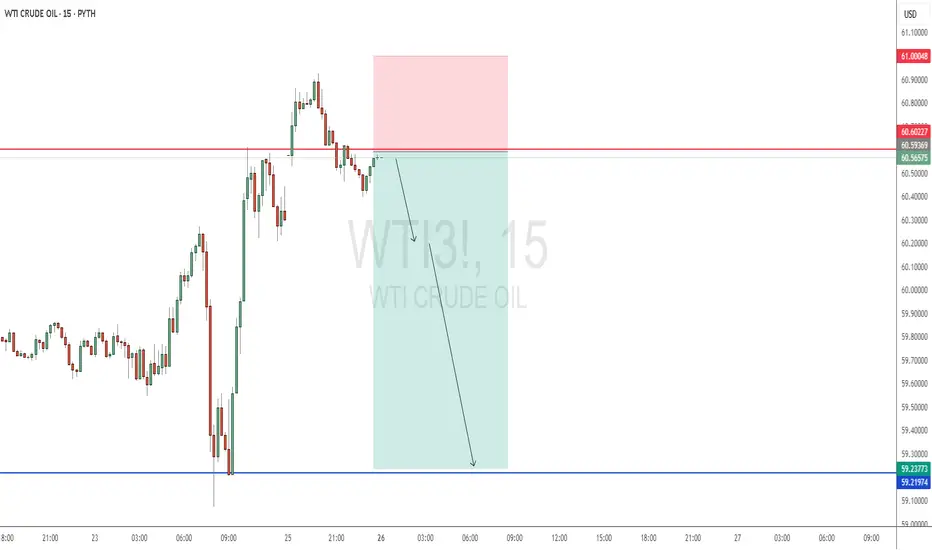
[CL] Trade ideaShort setup for this trade, looking for a low target on this one so need to manage the position in case we reverse long.
Great Trade !

CRUDE OILPreferably suitable for scalping and accurate as long as you watch carefully the price action with the drawn areas.
With your likes and comments, you give me enough energy to provide the best analysis on an ongoing basis.
And if you needed any analysis that was not on the page, you can ask me with a comment or a personal message.
Enjoy Trading ;)

Light Crude Oil Daily Double Bottom Bullish Reversal Trade Plan
Price has formed a clear Double Bottom pattern with a neckline as current Temporary Resistance.
• ✅ Entry is triggered only after a confirmation candle breaks above the neckline.
• Buy Stop is placed below the neckline to catch the momentum move.
• Stop Loss is at the recent lower Low (safe and logical placement).
• 🎯 Take Profit levels are based on measured move projections.
Trade Plan:
• Entry: 64.20
• Stop Loss: 55.12
• Take Profit 1: 73.28
• Take Profit 2: 82.36
• Volume: 0.21 X 2
“Waiting for neckline to break with Bulliwh confirmation candle” – this ensures you enter only on strong momentum.
Light Crude Oil future is forming a classic Bullish Reversal pattern with clear structure. A break of the neckline confirms the setup
Key Highlights:
• ✅ Pattern: Double Bottom
• ⚠️ Confirmation: Break + Bullish candle
• 🔄 Risk Management: Tight SL, 2 TP levels
• 🧩 Confluence: Trendline break + structure shift + RSI Divergence

Eyes Key Resistance: Will Prices Push Higher?
Targets:
- T1 = $63.85
- T2 = $65.25
Stop Levels:
- S1 = $61.25
- S2 = $59.90
**Wisdom of Professional Traders:**
This analysis synthesizes insights from thousands of professional traders and market experts, leveraging collective intelligence to identify high-probability trade setups. The wisdom of crowds principle suggests that aggregated market perspectives from experienced professionals often outperform individual forecasts, reducing cognitive biases and highlighting consensus opportunities in Crude Oil.
**Key Insights:**
Crude Oil is trading near critical resistance levels that may signal a bullish breakout. Historical data suggests that oil has a tendency to rebound sharply during periods of geopolitical tension and seasonal demand increases. The $64–$65 range remains pivotal, as overcoming this resistance could attract institutional momentum buying. Supply constraints, coupled with signals of recovering global demand, are lending support to the bullish outlook in the short term.
However, traders remain cautious due to macroeconomic uncertainties. Oil prices are particularly sensitive to policy shifts in OPEC+ production and expectations around inflation in the global economy. Additionally, the potential renewal of Iranian sanctions could create volatility, impacting short-term price trends.
**Recent Performance:**
Crude Oil has shown range-bound behavior between $60 and $65 over the past few weeks. Short-term pullbacks have frequently tested the $60.78 support level but failed to breach it. Attempted rallies toward $65 have met strong resistance, indicating that any established move above this level may trigger further upside. Price action reflects increased buying interest near the current levels, but confirmation of a breakout is pending.
**Expert Analysis:**
Numerous analysts highlight the significance of approaching seasonal trends, within which oil demand typically sees a boost. Technical analysis confirms that moving averages are recovering, and oil remains above key channels that signal a bullish continuation. Moreover, volume analysis indicates increasing activity among institutional buyers as prices hover above $62.00.
While geopolitics remain a double-edged sword, OPEC+ production cuts alongside demand visibility for 2023 are suggesting a window for bullish movement. Near-term consolidations may offer strategic long opportunities with proper risk management.
**News Impact:**
Recent headlines on Middle Eastern production agreements and U.S. inventory data are driving sentiment. Decreasing stockpile levels have alleviated some of the oversupply concerns. Meanwhile, global policymaking on energy transition continues to play a role in longer-term price sustainability. Traders are keenly watching any updates on Iranian nuclear deal talks as a major disruptor.
**Trading Recommendation:**
Given current price movement and favorable seasonal trends, a LONG position on Crude Oil is recommended. The ability of prices to stay above $62.00 offers a window for upside opportunities toward $65 and beyond. Short-term targets are set at $63.85 and $65.25, while stop levels should be carefully placed at $61.25 and $59.90 to protect against further dips. Recent consolidations and institutional buying signal a promising rally, but traders should remain vigilant about macroeconomic news as a potential risk factor.

.382 's atm bull or bear - Same idea as last 3 charts which don't seem to be updating - watching if it can climb up to the 65.24 / .382 above bull needs to hold these grain sheds/demand green mthly -blue fib . the dollar just got downgraded by Moodys -might be interesting . keep your stick on the ice GL .
