Crudeoil performance using algo Trend sniper algo indicator having 3 modes of trading strategy. Auto signal Based on price action, Buy only on up trend ; Sell only on down trend. With signal live alert .
WTI3! trade ideas

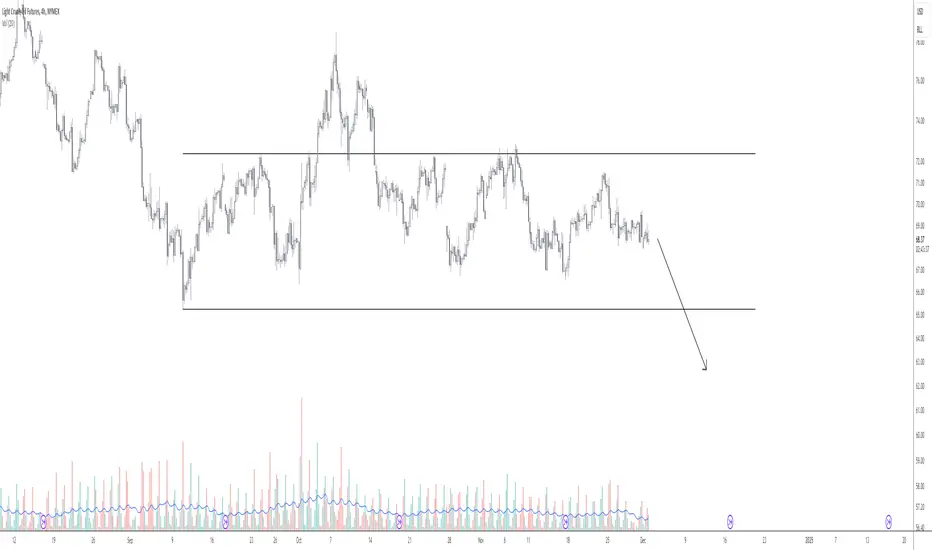
OIL _ PlummetsImagine oil going to $40 and now imagine it going even to $13.
Oil is going to plummet.
A financial crisis is going to send ripples across the globe.
NFA

Crude Oil Intraday Technical Analysis for 05 December 2024!🚀 Unlock the potential with my #CrudeOil Intraday Technical Analysis for 05 December 2024!
✨ Boost, follow, and engage for more detailed insights. Your support helps us bring you the latest and most accurate updates! 🚀❤️
📍 Range Trigger Point (RTP): 5,839
📅 Day Range: 158
📈 Long Position
🔹 Buy Above: 5,924
📊 Average Position: 5,905
🎯 Target 1: 5,937
🎯 Target 2: 5,997
⛔ Stoploss: 5,871
📉 Short Position
🔹 Sell Below: 5,886
🎯 Target 1: 5,741
🎯 Target 2: 5,681
⛔ Stoploss: 5,939
✨ With over 6 years of research and back-tested strategies, I provide clear intraday and positional trading levels for indices such as Nifty50, Bank Nifty, Fin Nifty, and Mid-Cap Nifty, along with commodities like Crude Oil, Natural Gas, Gold, Silver, Copper, and Zinc in both US and MCX markets.
My analysis is based on the position of buyers and sellers on previous day's technical charts. By studying candlestick patterns, trading volume, indicator confirmations, and other important signals, I identify the best price ranges, entry points, timing, and appropriate stop-loss levels.
I teach a specific trading approach based on live market confirmations to make the most of these levels. Follow and connect with me to learn how to effectively implement these strategies and improve your trading results! 📈
#CrudeOil #CrudeOilMCX #Commodities #TradingSignals #IntradayTrading #MCX #NumroTrader

Can the HOUSE Capitalize LONG ABOVE Ranging EQ Level $69.50?NYMEX:MCL1!
'2025 For a Gr8ter Reward, we must go to the Valley to CONQUER.' -500KTrey
Here on OIL we have been caught in the Range from low $66.25 to high $72.75 and EQ Level $69.50.
As we can see clearly to the left that the Daily Demand Zone has held from late Sept til now however sellers are very heavily present @ $70.00 Per Barrel N Higher making it Premium Pricing to Sell... However Could we get a break N a 1Hr Candle closure above EQ Level $69.50 and possibly above MKL $70.00 Per Barrel? If so I may be interested in GOING LONG from a LTF Entry Confirmation, if we get the break N candle closure above EQ Level on the 1Hr TF I will be interested in entering the Market LONG N making my target the 4Hr HIGH $71.50... remember nothing in the market is set in STONE we play the long term game of probability...
Our Profession is to manage the downside costs of printing HIGHSIDE Returns of $$$ consistently... Lets focus on risking the Highest Probable Set-Ups during NY ONLY!!!
#BHM500K

Oil December 4th I wanted to look at oil because generally the pattern looks contracted to me. when I'm not clear on things I not only look at the daily chart but I'll look at some bigger time frames and when I saw the weekly chart it became apparent to me that I could actually trade this market today and certainly yesterday. There are times when you really have to go one time frame higher if you want clarity even though most of the time you'll probably look for a lower time frames for clarity but that doesn't apply when you're trying to find a trade on this current market in my opinion. but go ahead and look at it I'm not sure if it's going to break out to the higher time frame or not but it did give you a couple $1000 Target if we traded inside the range box.

Oil: No monthly green candle following October inverted hammer November monthly continuation to the upside failed following October's monthly inverted hammer candle signaling bearishness into December
Last November daily candle signaled price in the process of going down so coming week should see further downside.
Price target is last's year low.

2024-12-03 - priceactiontds - daily update - wti crude oilGood Evening and I hope you are well.
tl;dr
wti crude oil futures - Neutral. Bulls did what they had to, to prevent a flush down to 66. Market traded above 70 and we made a higher low. Bulls would need to print 71.5 for a higher high and I can’t see that happening as of now. Chop between 68 and 70 is most likely here.
comment : Midpoint of this triangle is around 69.3 and this will be a magnet until we either make higher highs or lower lows. It’s a trading range, don’t over analyze it.
current market cycle : trading range (big triangle on the daily chart)
key levels: 66 - 70
bull case: Bulls had a decent day and turned the market completely neutral again. Only above 71.5 they are favored for higher prices. For tomorrow I expect some more sideways price action between 69 and 70.5.
Invalidation is below 66.27
bear case : Bears need to keep it below 71.5 or we are making higher highs again. They tried to close below 68 for 4 days and today we saw bears giving up on it. Bears are still favored to keep it inside the triangle, so either play the range or don’t trade at all. Betting on a huge breakout is not a decent strategy after going sideways for so long.
Invalidation is above 71.5.
short term: Neutral inside the triangle. Area round 70.5 should be huge resistance.
medium-long term - Update from 2024-11-10 : Unless an event comes up, this will very likely close around 70 for the year.
current swing trade: Nope
trade of the day: Could have longed anywhere and made money. 1h 20ema is strong support until broken.

Crude OilUS Oil - Crude Oil
Descending Triangle as an Corrective Pattern in Short Time Frame
RSI - Divergence
Break of Structure
Demand Zone
Fibonacci Level - 61.80%

Could oil prices fall to $60?Could oil prices fall to $60?
This week, oil markets remained stable with WTI crude futures closing at $68.5 per barrel. Investors were alert to positive economic data from China and the upcoming OPEC+ meeting.
Chinese manufacturing activity is reported to have picked up for the second consecutive month, at a faster pace than in the past five months, indicating a recovery in the world's largest oil importer. At the same time, Saudi Arabia announced a reduction in crude oil prices for Asian buyers starting in January, bringing them to their lowest level in four years.
The OPEC+ meeting that was originally scheduled for this week has been postponed, and further discussions are expected to be required before a decision on increased production is made.
Geopolitical tensions in the Middle East are also impacting the oil market.
Although there has been a ceasefire agreement, Israel has resumed attacks on Lebanon, and Iran is supporting the Syrian government after rebels took control of Aleppo, the country's largest city. In addition, there is concern that Saudi Arabia may increase production if other countries do not do the same to keep prices stable.
The OPEC issue is again at the center of discussions, with some countries trying to gain an advantage by producing more oil than agreed upon.
During a telematic meeting, OPEC representatives blamed Iraq for exceeding its daily production limit of 400,000 barrels in August according to data provided by S&P Global Ratings, and Kazakhstan, which expects to increase production due to the return of the Tengiz oil field to 720,000 barrels per day. “There is no point in adding new stocks if there is no demand for them in the market,” one of the representatives said during the call. “It is important that all states respect the agreements set by OPEC+ and keep quiet.” In recent months, oil prices have fallen by 9 percent across all major benchmarks.
Despite OPEC+'s efforts to stabilize oil markets, prices continue to fall. Although the group has proposed several extensions of production cuts, this has not prevented prices from falling further. According to IEA data, OPEC's market share has declined to 48 percent this year, down from 50 percent in 2023 and 51 percent in 2022.
Competition is expected to intensify next year, with projected increases in production in the United States, Guyana and Brazil, which could lead to an increase of more than 1 million barrels per day in global supply. Although Brazil joined OPEC+ this year, they have stated that they will not participate in production cuts to maintain their market share.
According to my forecast, we will see oil prices fall to new lows of around $60 in the coming quarters, with a possibility in 2025 of seeing prices even lower than $50 per barrel if a dispute within OPEC occurs.
The crude oil futures curve still shows a contango trend, which means it may be advantageous to consider instruments such as ETFs for long-term investing.
However, it is advisable to avoid direct investment in the oil stock sector at present, as the value of the dollar is strong and prices of companies in the sector are very high.
If you would like to be notified whenever I post a new article, just click on “FOLLOW” at the top. Also, if you would like to elaborate on a particular topic or need some advice, please comment below the article and I will be happy to help you.

Analysis of Crude Oil - Breakdown?
Analysis of Crude Oil (1-Hour Timeframe)
The chart shows crude oil trading within a descending channel, indicating bearish sentiment in the short term. Price is currently consolidating near the lower trendline, showing potential for a pullback or a continuation.
Key Levels:
Resistance Levels:
5,829 (55 EMA level): Immediate resistance to watch.
5,860: Upper trendline of the descending channel.
5,900: A breakout above this could signal bullish momentum.
Support Levels :
5,780: Current local support near the recent low.
5,720: Next critical level below if the downtrend continues.
Potential Scenarios:
Bullish Breakout: If the price breaks above the descending channel and sustains above 5,860, it could rally towards 5,900 and beyond.
Bearish Continuation: Failure to break 5,829 and a move below 5,780 could push the price towards 5,720.
Risk Management: Set stop-loss orders to protect your position against unexpected price reversals.
Disclaimer: This analysis is based on available data and should not be considered financial advice. Always manage your risk responsibly.

View of Renko next to 30 min CRUDEOIL1!This is a view of CRUDEOIL1! with renko and 30 min candle with pivots


WTI ShortWyckoff Re distribution Process, showing Supply is trying to push de prince to Lower Prices
WTI Crude Oil 2024: Range-Bound Trends and Key LevelsBig Picture:
WTI Crude Oil Futures prices have been largely range-bound for most of 2024 with yearly low of 62.54 and high at 81.75 defining the trading range. Analyzing the Composite Volume Profile since January 2022 reveals that 2024’s price action has been contained within the Composite Value Area High (CVAH) at $79.91 and Composite Value Area Low (CVAL) at $63.57
We further note that while there are many bearish and bullish analyses for crude oil floating from different market analysts, market auction theory and charts point towards further range bound price action for December 2024 and foreseeable 2025 ahead until proven otherwise.
OPEC+ meeting is scheduled to take place on December 5th, 2024. It was previously planned to take place on Dec 1st, 2024. The change accommodates the Kuwait Summit, with Saudi Arabia and its allies expected to discuss production quotas—a decision that could influence market dynamics.
Additionally, U.S. crude oil production in 2024 has reached record-high levels.
Geopolitical issues have not had a major impact on Crude prices as prices remain range bound. Intraday volatility remains amidst geopolitical uncertainty.
WTI Crude Oil Key Levels:
CVAH : 79.91
CVAL : 63.57
2024 Yearly Mid : 72.15
2024 Yearly Lo : 62.54
2024 CVAH : 75.60
2024 CVAL : 66.97
Market Scenarios:
Short Term Resistance (2024 Mid and CVAH) : Price movements toward the upper range (CVAH at $79.91 or $75.60) could signal buyer exhaustion, with limited upside momentum expected.
Short Term Support (CVAL and Yearly Low) : Movements toward lower levels (CVAL at $63.57 or $66.97) may indicate seller exhaustion, preventing a significant breakdown.
As crude oil remains range-bound, traders should monitor these key levels and the OPEC+ meeting outcomes for potential catalysts. Until then, the market appears set to maintain its current trading range.
Disclaimer : The views expressed are personal opinions and should not be interpreted as financial advice. Derivatives involve a substantial risk of loss and are not suitable for all investors.

WTI ShortWTI Short
Wyckoff Re distribution Process, showing Supply is trying to push de prince to Lower Prices

WTI ShortWTI Short
Wyckoff Re distribution Process, showing Supply is trying to push de prince to Lower Prices

CL1 - Light Crude Oil H1Wave (c) of zigzag pattern to complete wave ((d)) of a triangle.
Triangle invalid if price move below wave ((b))

#202448 - priceactiontds - weekly update - wti crude oil futuresGood Evening and I hope you are well.
tl;dr
wti crude oil futures: Bearish. Bears printed 4 consecutive bear bars and made new lows. Next target is 67. Only a daily close above 70 would do it for the bulls but even then the next bear trend line runs below 71. Market is once again forming nested triangles on the daily chart. Tough to trade.
Quote from last week:
comment: Was also bullish on this and bulls finally came around. Clear break of the bear trend line and next target is 72.6. Is this a very bullish structure? Hell no. I expect more sideways movement just in a bigger range 69 - 72/73 until the bear gap is closed. If bulls somehow manage to close it next week, we can expect 75+ next. Continuation of the current range is much more likely though and that is why you should not over analyze trading ranges. Market is in balance in the midpoint, so mark it and fade the extremes.
comment: The most likely outcome was a continuation of the trading range and that’s what we got. Bears are on their way to test 67 again and the market now have formed a head & shoulders pattern like in August where we broke down to make new lows. Most h&s patterns fail and are just continuation patterns. We will likely get the answer to that next week. Anything between 68 and 70 is a dead zone and I will only be interested in longs around 67, if bulls come around again. Shorts do not make sense below 70.
current market cycle: trading range
key levels: 67 - 72.6
bull case: Horrible week for the bulls with a clear sell signal going into next week. They have to defend 67 or we will likely go down to 66 or 65.74 again. Bulls who bought 67 have made money since September and we have no reason to expect it to be different this time. Daily close above 69 brings 70 and 70.5 in play.
Invalidation is below 67.
bear case: I do think Monday’s bar was a big bear surprise and market went mostly sideways afterwards. They also had a really good reversal on Friday which is a sell signal going into next week. They want to test the November low 66.27 and break below the very shallow bull trend line to test 65.73 or the lower bull trend line starting December 2023 at around 64.
Invalidation is above 71.6.
outlook last week:
short term: Bullish that we reach 72 but upside is probably limited after that. Pullbacks are likely to be bought if not too strong and if we stay above 68.
→ Last Sunday we traded 71.24 and now we are at 68. Outlook was just plain wrong and that was already clear on Monday at US open. Market basically went nowhere after that.
short term: Neutral 68 - 70 and I doubt we make lower lows below 66. Even if bears push below, downside is likely limited.
medium-long term - Update from 2024-11-10: Unless an event comes up, this will very likely close around 70 for the year.
current swing trade: None
chart update: Nothing worth mentioning.

Crude Oil Buy opportunityLight Crude Oil Futures Analysis – NYMEX (CL)
Crude Oil Futures (CL) are presenting a compelling buying opportunity as the price consolidates within a symmetrical triangle, suggesting an imminent breakout. This technical setup often leads to significant upward momentum when the price breaks through the upper resistance. With the current support around $66.18 holding strong, there is a favorable risk-reward ratio for traders looking to enter a bullish position.
Technical Indicators Signal Potential Upside:
Support Zone: The lower boundary at $66.18 has consistently provided a solid foundation, indicating strong buying interest at this level.
Bullish Momentum: A breakout above the $71.30 resistance could confirm a bullish reversal, with targets around $74-$75 in the near term.
This setup offers an attractive buying opportunity with minimal downside risk, especially if CL can break through key resistance levels. Given current market dynamics and technical indicators, a bullish outlook appears favorable for the upcoming sessions.
Light Crude Oil Futures, NYMEX, bullish setup, buying opportunity, support, resistance, breakout, technical analysis, price action.
#CrudeOil #Bullish #BuyOpportunity #OilFutures #TechnicalAnalysis

Crude Oil || BREAKOUT FROM TRIANGLE PATTERN Chart Analysis: Crude Oil (1-Hour Timeframe)
Pattern: A symmetrical triangle pattern is forming, signaling potential consolidation before a breakout.
The price is approaching the apex of the triangle, indicating that a breakout could occur soon.
Key Levels:
Support: Around 5,821 (Fibonacci 0.236 level).
Resistance: At 5,927 (Fibonacci 0.618 level) and 6,034 (Fibonacci 1.0 level).
The 55 EMA (5,874) is acting as dynamic resistance.
Long Trade (Bullish Breakout):
Entry: Above 5,895 (triangle breakout)
Target 1: 5,927
Target 2: 6,034
Stop Loss: 5% - 10%
Short Trade (Bearish Breakdown):
Entry: Below 5,821 (triangle breakdown).
Target: 5,750
Stop Loss: Above 5,862

The current outlook for crude oil appears mixed but leans slightThe current outlook for crude oil appears mixed but leans slightly bullish due to the following factors:
Inventory Trends: While there was a smaller-than-expected build in crude oil inventories (+500,000 barrels), it contrasts with larger builds from previous weeks. Additionally, gasoline inventories rose, but middle distillate inventories only slightly declined, signaling some supply-demand balancing.
Geopolitical Risks: Tensions between Russia and Ukraine add a potential "war premium" to prices, but the market reaction has been muted compared to previous years, suggesting limited immediate impact.
Chinese Demand: Signs of improving demand from China—a major oil consumer—provide support for a bullish sentiment as global demand stabilizes.
IEA Forecast: The International Energy Agency now suggests tighter-than-expected supply, revising its Q4 inventory decline estimate from 300,000 barrels per day (bpd) to over 1.1 million bpd. This implies a more constrained market moving forward.
However, bearish risks stem from:
Perceptions of a generally well-supplied market, potentially capping upside momentum.
Reduced war-related price shocks compared to prior years.
Conclusion for Traders:
Crude oil shows bullish potential, especially if demand signals from China strengthen or inventory draws accelerate. Short-term volatility remains, but opportunities might exist for buying dips rather than shorting, particularly as geopolitical risks and seasonal demand factors play out.
ILL CONSIDER SCALING IN EVEN MORE AT EACH GREEN LINE. COT report suggests some bullish momentum for this week

US OilUS Oil - Crude Oil
Completed " 12345 " Impulsive Waves and " AB " Corrective Waves
Break of Structure and Retracement
Change of Characteristics
Demand Zone
Falling Wedge as an Corrective Pattern in Short Time Frame

Elliott Wave View: Oil (CL) Short Term May See More DownsideShort Term Elliott Wave View in Oil (CL) suggests that cycle from 10.8.2024 high is in progress as a 5 waves impulse. Down from 10.8.2024 high, wave 1 ended at 66.72. Wave 2 rally ended at 72.89 as the 1 hour chart below shows. It has then turned lower again in wave 3. Down from wave 2, wave (i) ended at 70.94 and wave (ii) bounce ended at 71.64. Wave (iii) lower ended at 66.94 and wave (iv) rally ended at 69.39. Final wave (v) lower ended at 66.61 which completed wave ((i)). Oil then rallied in wave ((ii)) with internal subdivision of a zigzag.
Up from wave ((i)), wave (a) ended at 70.15 and wave (b) ended at 68.75. Wave (c) higher ended at 71.51 which completed wave ((ii)). Oil has turned lower and structure of the decline looks impulsive. Down from wave ((ii)), wave i ended at 70.4 and wave ii ended at 71.24. Wave iii lower ended at 68.57. Expect wave iv to end soon and then it should turn lower in wave v to complete wave (i). Afterwards, expect oil to rally in wave (ii) in 3, 7, or 11 swing before the decline resumes. Near term, as far as pivot at 72.89 high stays intact, expect rally to fail in 3, 7, 11 swing for more downside.
