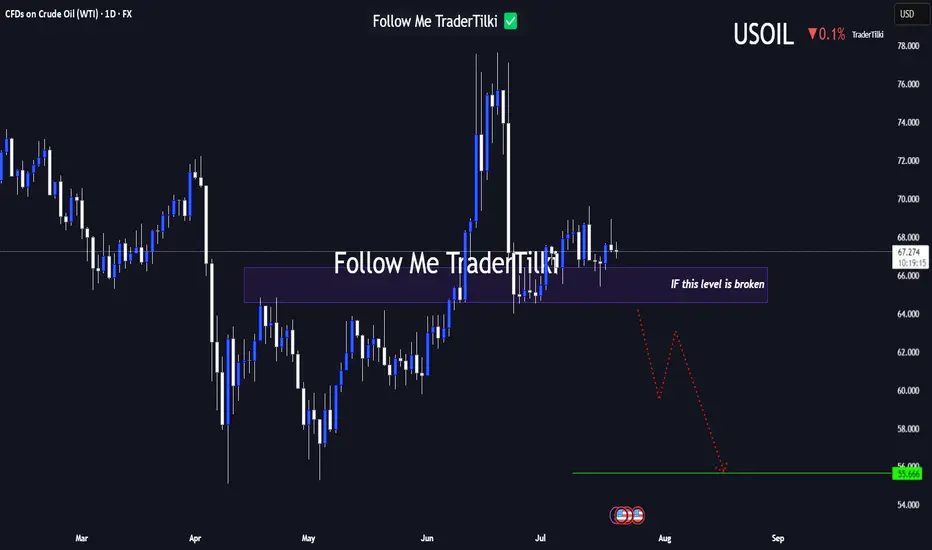
USOIL Under Technical Pressure: 1D Timeframe Breakdown Hey Guys,
The 66.584 level currently stands as the strongest support zone for USOIL. If this level breaks with a candle close, the next major target could drop to 55.666.
This setup is based on the 1-day timeframe. I highly recommend keeping a close watch on that key level.
Every like from you is my biggest motivation to keep sharing these insights. Thanks so much to everyone who’s showing support!
WTICOUSD trade ideas
Bullish bounce?WTI Oil (XTI/USD) has bounced off the pivot and could rise to the 1st resistance that is slightly below the 50% Fibonacci retracement.
Pivot: 65.64
1st Support: 60.22
1st Resistance: 71.20
Risk Warning:
Trading Forex and CFDs carries a high level of risk to your capital and you should only trade with money you can afford to lose. Trading Forex and CFDs may not be suitable for all investors, so please ensure that you fully understand the risks involved and seek independent advice if necessary.
Disclaimer:
The above opinions given constitute general market commentary, and do not constitute the opinion or advice of IC Markets or any form of personal or investment advice.
Any opinions, news, research, analyses, prices, other information, or links to third-party sites contained on this website are provided on an "as-is" basis, are intended only to be informative, is not an advice nor a recommendation, nor research, or a record of our trading prices, or an offer of, or solicitation for a transaction in any financial instrument and thus should not be treated as such. The information provided does not involve any specific investment objectives, financial situation and needs of any specific person who may receive it. Please be aware, that past performance is not a reliable indicator of future performance and/or results. Past Performance or Forward-looking scenarios based upon the reasonable beliefs of the third-party provider are not a guarantee of future performance. Actual results may differ materially from those anticipated in forward-looking or past performance statements. IC Markets makes no representation or warranty and assumes no liability as to the accuracy or completeness of the information provided, nor any loss arising from any investment based on a recommendation, forecast or any information supplied by any third-party.

LONG ON USOIL OIL has just completed a sweep of sell side liquidity, leaving behind lots of BUY side liquidity.
DXY is falling on top of economic news stating trump will possibly fire Jerome Powell.
All this with OPEC increase oil production.
I expect oil to make a $5-$10 move throughout the rest of the week.
That's 500-1000 pips!

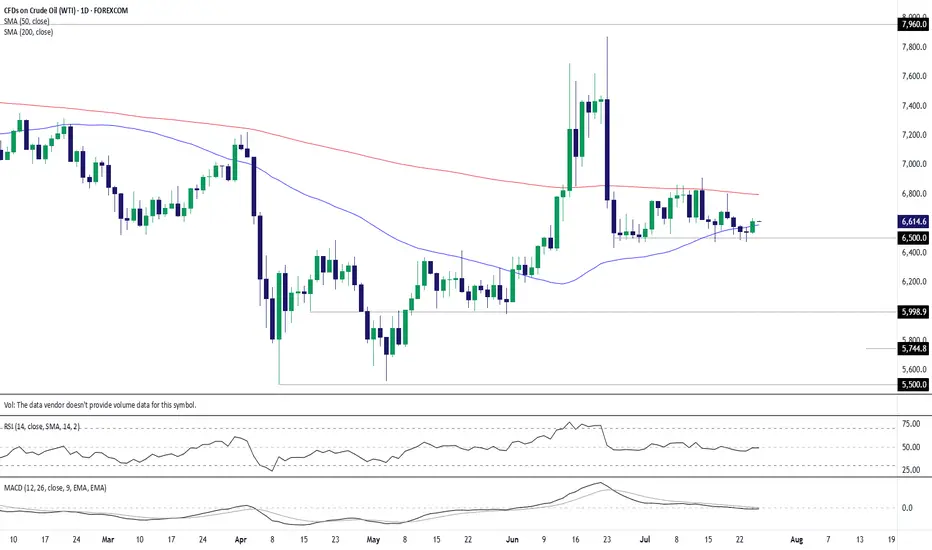
WTI OIL Extreme 1D MA50-200 squeeze to deliver break-out!WTI Oil (USOIL) has been consolidating for almost the past 30 days within the 1D MA50 (blue trend-line) and 1D MA200 (orange trend-line). The squeeze is now so tight that the trend will be revealed soon with a break-out.
Based on the 2-year Channel Down, that should be bearish, resembling the May 2024 consolidation that broke downwards and almost hit the 0.786 Fibonacci retracement level. Notice also the similar Sell Zone rejection on the 1W RSI.
As a result, we expect WTI to decline and target $61.00.
-------------------------------------------------------------------------------
** Please LIKE 👍, FOLLOW ✅, SHARE 🙌 and COMMENT ✍ if you enjoy this idea! Also share your ideas and charts in the comments section below! This is best way to keep it relevant, support us, keep the content here free and allow the idea to reach as many people as possible. **
-------------------------------------------------------------------------------
Disclosure: I am part of Trade Nation's Influencer program and receive a monthly fee for using their TradingView charts in my analysis.
💸💸💸💸💸💸
👇 👇 👇 👇 👇 👇

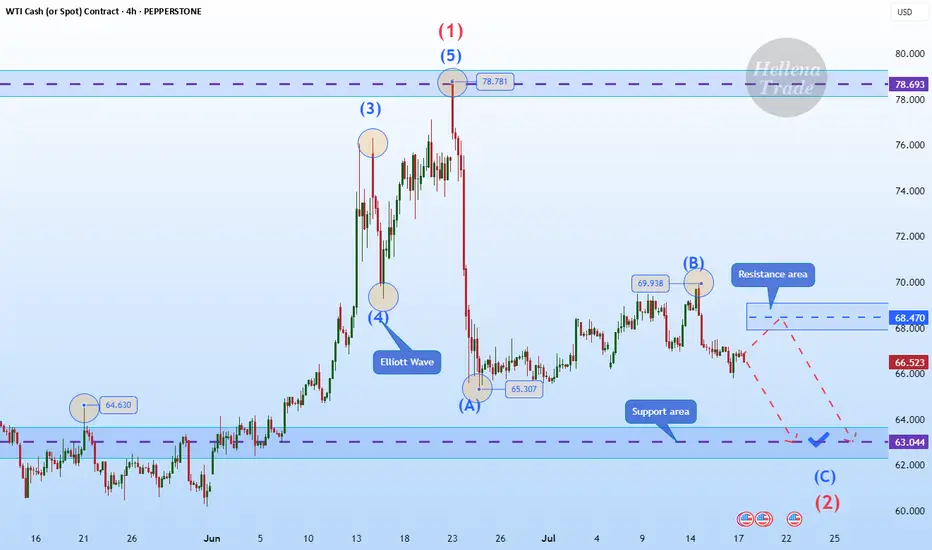
Hellena | Oil (4H): SHORT to support area of 63.000.Colleagues, I believe that wave “B” has formed at the level of 69.938, and now we expect the downward movement to continue with the aim of completing wave ‘C’ of the middle order and wave “2” of the higher order in the support area of 63,000.
It is quite possible that the price could reach the 60,000 level, but I think that for now it is worth focusing on the nearest targets.
Manage your capital correctly and competently! Only enter trades based on reliable patterns!
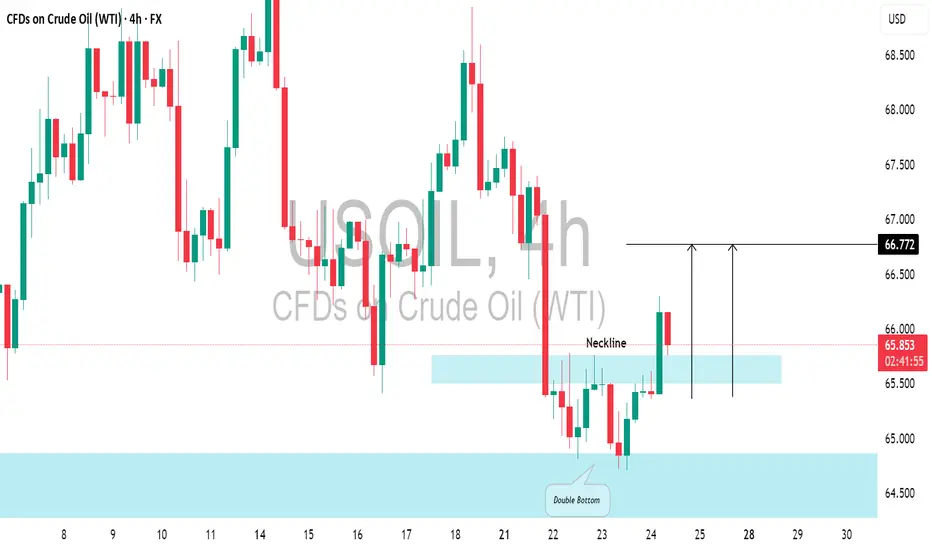
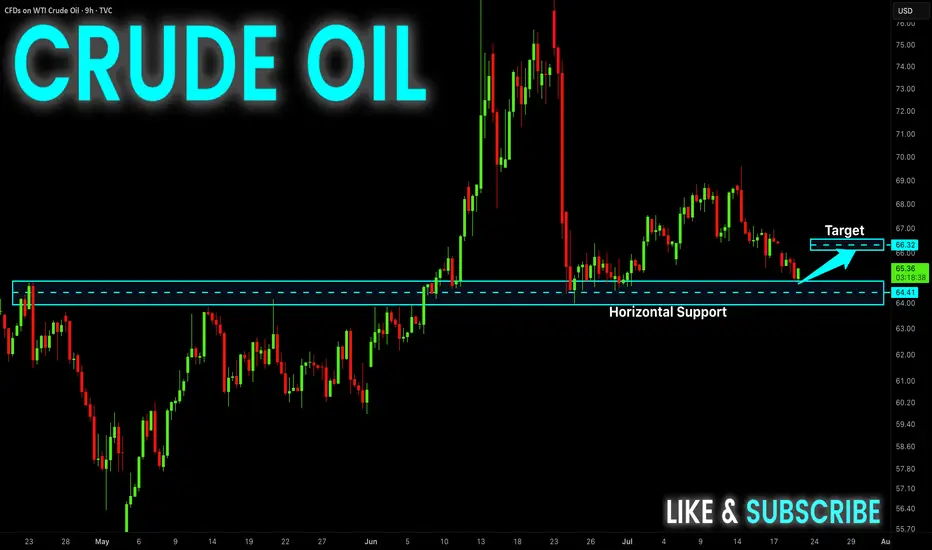
US CRUDE OIL (WTI): Pullback From Support📈USOIL responded well to the highlighted daily support level.
The price formed a double bottom pattern on that and broke above its neckline.
There's a strong likelihood that the price will continue to increase and reach 66.72 shortly.
Oil Bearish for next weekOil will be bearish for next week. Toxic Sell and Calender spread shows the direction.

Crude Oil Short Setup
Entry: 66.40
SL: 67.20
TP: 64.85
Risk to Reward: 1.93
Bias: Bearish
I expect mid-term downside pressure on crude oil prices, mainly due to the following reasons:
The U.S. is mitigating the impact of energy tariffs by increasing domestic supply.
Pressure on OPEC to boost production is rising.
Global demand growth remains uncertain.
These factors may keep energy prices capped in the medium term and support bearish scenarios.

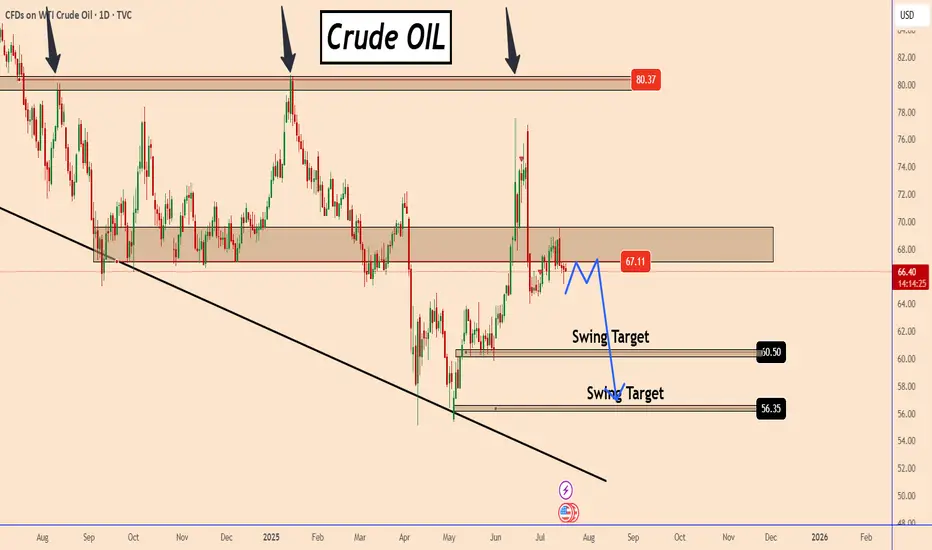
OIL: The Chances To Drop Are Growing FurtherOIL: The Chances To Drop Are Growing Further
OIL has days in this zone. Overall it's developing as I explained earlier.
The price increased a bit more than expected but again it's in a strong structure zone and is holding strong.
I think that OIL has to create a better pattern, but overall it looks poised to drop further from this zone with targets 60 and 56
You may find more details in the chart!
Thank you and Good Luck!
PS: Please support with a like or comment if you find this analysis useful for your trading day
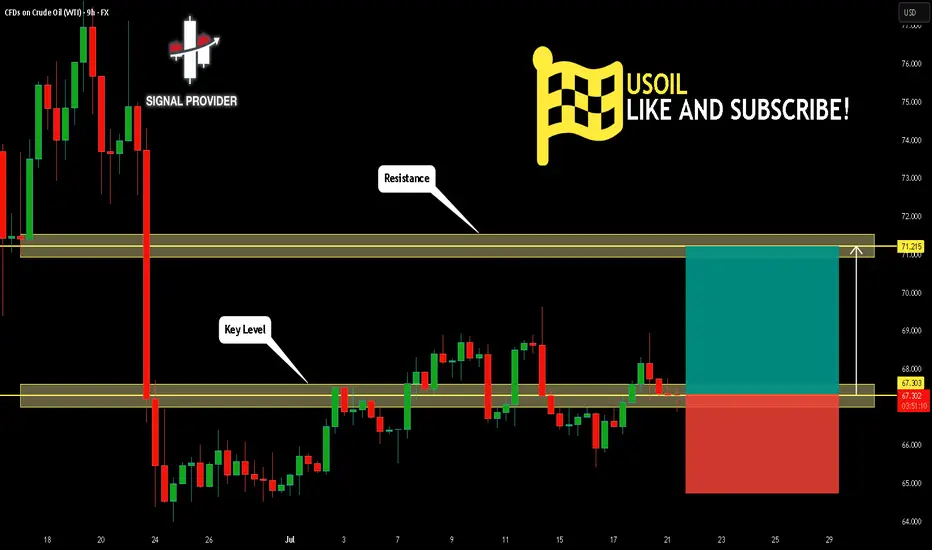
USOIL Will Go Higher! Buy!
Take a look at our analysis for USOIL.
Time Frame: 9h
Current Trend: Bullish
Sentiment: Oversold (based on 7-period RSI)
Forecast: Bullish
The market is approaching a key horizontal level 67.303.
Considering the today's price action, probabilities will be high to see a movement to 71.215.
P.S
We determine oversold/overbought condition with RSI indicator.
When it drops below 30 - the market is considered to be oversold.
When it bounces above 70 - the market is considered to be overbought.
Disclosure: I am part of Trade Nation's Influencer program and receive a monthly fee for using their TradingView charts in my analysis.
Like and subscribe and comment my ideas if you enjoy them!
One Last Dip Before the Pop?On the daily timeframe, we anticipate two possible scenarios for USOIL’s movement. In the red-labeled scenario, USOIL is expected to undergo a correction to test the 63.71–64.03 area. However, in the best-case scenario, if USOIL manages to hold above 64.03, it has the potential to strengthen toward the 68.27–72.53 range.

WTI crude: $65 floor holds again as bulls test 50-day MAAfter nine failures to break and close beneath $65 per barrel over the past month, you have to wonder how much longer bears will persist in attempting to take out the level. Following a nice pop higher on Thursday, completing a morning star pattern and closing above the 50-day moving average, it may be time for WTI bulls to have their day in the sun.
For those eyeing long setups, positions could be initiated above the 50-day moving average with a stop beneath for protection against reversal.
As for potential targets, the contract had little luck breaking cleanly above the 200-day moving average earlier this month, making it screen as a suitable level. It’s found just below $68 per barrel today.
Good luck!
DS
USOIL Long From Support! Buy!
Hello,Traders!
USOIL made a retest of
The horizontal support
Level of 64.86$ from where
We are already seeing a bullish
Reaction so we will be expecting
A further local move up
Buy!
Comment and subscribe to help us grow!
Check out other forecasts below too!
Disclosure: I am part of Trade Nation's Influencer program and receive a monthly fee for using their TradingView charts in my analysis.
WTI USOIL As of July 19, 2025, the WTI crude oil price is hovering around $67.342 to $68.83 per barrel after attempting 77.52$ per barrel on Israel Iran conflict in the middle east. As a trader Make out time to look into OPEC WORLD OIL OUTLOOK(WOO) REPORT,SPR REPORT , this woo report provide comprehensive industry forecast and strategic petroleum reserve gives insight into united state energy status.
OPEC meetings are usually held in Vienna and involves discussions and agreement on oil production quotas affecting the global crude oil supply and prices.
oil sharply rose during Israel and Iran geopolitical tension and on the supply roof rejected AT 77.52$ PER BARREL ..
Supply remains cautiously controlled because price is influenced by demand and supply system , but global economic uncertainties and trade tensions, especially involving tariffs and sanctions, continue to influence oil demand expectations.
the US Strategic petroleum reserve (SPR) is the united states emergency crude oil stockpile managed by department of energy ,it act as a buffer to protect against significant supply disruption of oil market, the SPR holds hundreds of millions of barrels of crude oil stored in the underground salt caverns along the gulf coast.it can be tapped to stabilize the market during supply crises or emergencies .
the U.S government occasionally release oil from the SPR to ease supply shortage or control fuel prices coordinated with other countries through the international energy agency if need be.the status and release are regularly monitored as they affect global oil prices and energy security
Am holding WTI OIL low buy and will continue until the break of demand floor and might add more buy if the sentiment holds buy idea.
Trading OIL AND GAS is 100% probability , No one can tell the next crisis and global energy supply disruption.
Manage your risk.

CRUDE OIL (LONG IDEA)🛢️ OILUSD (WTI Crude Oil) – LONG SETUP 🛢️
🚦 Bias: BULLISH (Long)
💰 Entry: Market @$65.408 (or buy dips)
🛑 Stop Loss:$60.00 (HTF protection)
🎯 Take Profits:
• TP1:$69.65
• TP2:$72.00
• TP3:$85.00 🚀 (HTF buy-side liquidity)
🔍 Why This Trade?
✨ Multi-Timeframe Confluence:
📈 Weekly: Bullish structure shift, liquidity sweep
🟩 Daily: Strong bounce from order block + FVG
⏰ 4H: BOS, FVG tap, higher lows = bullish flow
🔥 Fundamentals:
🏦 EIA: Big crude inventory drawdown
🌍 OPEC/IEA: Q3 demand rising
⚡ Geopolitics: Middle East/Red Sea risk premium
💵 Macro: USD weakness = oil tailwind
🧠 Sentiment:
🧑💻 Retail: Still net short
🏦 Managed money: Adding longs
🚀 Fuel for upside!
🛠️ Execution Plan:
💸 Buy now @$65.408 or scale in on dips $64.50–63.50)
🛡️ Stop Loss:$59.780 (HTF structure)
🎯 Targets:
TP1:$69.65
TP2:$72.00
TP3:$85.00 🚀
❌ Invalidation:
Weekly close <$60.00 = exit
⚡ Summary:
All signals GO! 🚦 Multi-timeframe bullish structure, strong demand, and fundamentals + sentiment all align for a high-conviction long. Risk defined at $60.00 for max protection. Targeting major buy-side liquidity at $85.00!
#OILUSD #CrudeOil #Long #SmartMoney #TradeSetup 🚀

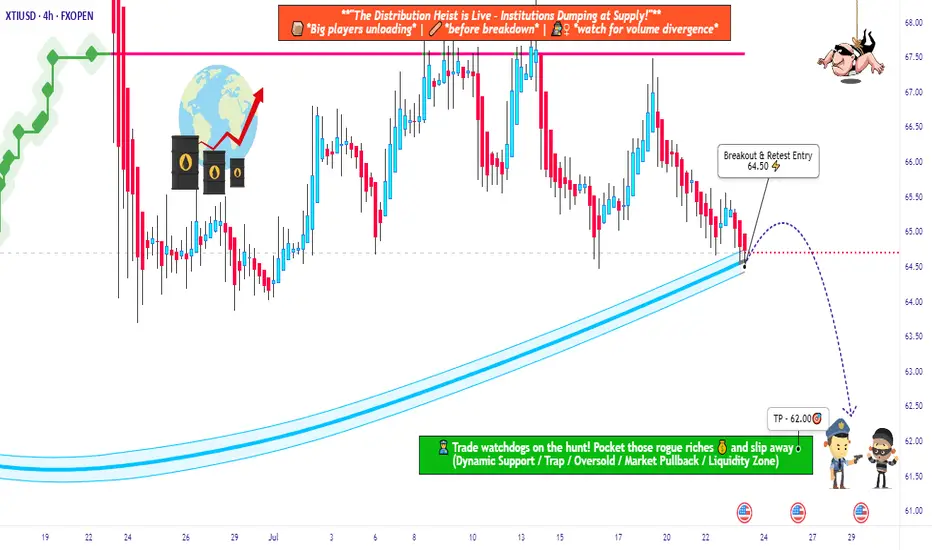
USOIL Robbery Alert! Smart Entry Plan Below Key MA Level🔐💥 “WTI Energy Heist: Thief Trader’s Bearish Master Plan” 💥🔐
The Official Robbery Blueprint for Smart Traders
🌟 Hi! Hola! Ola! Bonjour! Hallo! Marhaba! 🌟
💸 Welcome, Money Makers & Market Robbers! 💸
🚨 Get ready to break into the "US Oil Spot/WTI" market with precision-crafted bearish strategy from the one and only — Thief Trader Style!
📉💣 THE HEIST IS ON: SHORT PLAN LOADED! 💣📉
We’ve analyzed the charts using Thief Technicals + Fundamental Lockpick Tools and spotted a high-risk GREEN zone – a consolidation trap where greedy bulls usually get caught. This is where we strike.
🔑 ENTRY:
"Wait for the Neutral Moving Average to Break — Then Make Your Move!"
🎯 Focus zone: 64.50
☠️ Wait for the breakout – do NOT enter before it happens.
✅ Use sell stop orders above the MA line or place sell limit orders on the pullback after the breakout (target within the 15–30 min candle near swing high/low).
🧠 Thief Tip: Layer in entries using the DCA (layered attack strategy) to catch price on its way down. Set a chart alert so you don’t miss the strike moment.
🛑 STOP LOSS:
"Set it smart or don’t set it at all — you choose the fire you want to play with!"
📍 SL only gets placed AFTER breakout.
🎯 Recommended SL at 66.00 on the 4H swing level.
☠️ DO NOT place any orders or SL before confirmation breakout.
📊 Your SL depends on your risk %, lot size, and number of entries stacked.
🎯 TARGET ZONE: 62.50
💸 Lock profits before the bulls wake up. This level is based on market exhaustion zones and historical bounce areas.
🧠 WHY WE'RE SHORTING THIS?
This isn’t just a chart move — it’s backed by full-scale robbery research:
📰 COT Reports
📈 Macro & Seasonal Trends
🛢️ Crude Oil Inventories
💹 Sentiment & Intermarket Correlation
📉 Supply-Demand Dynamics
📚 Before pulling the trigger, educate yourself with the fundamentals. Dive into COT, Seasonal, and Macro reports. Don’t rob blindly — rob smart.
⚠️ Risk Management Alert:
Major news releases? Step back.
Trailing stops? Lock it in.
Position sizing? Know your risk.
Trade like a professional robber, not a street pickpocket.
💥💖 SUPPORT THE ROBBERY PLAN 💖💥
🧨 Smash that BOOST button to support this trading style and help more traders rob the market clean. Every like, every boost makes this community stronger.
💬 Drop a comment, share your entry levels, or post your winning trades.
This is a trading crew – we rob together, we profit together.
🔔 Stay tuned — more heist plans dropping soon.
Until then... Rob Smart. Trade Hard. Take Profits. 💰💪🎯
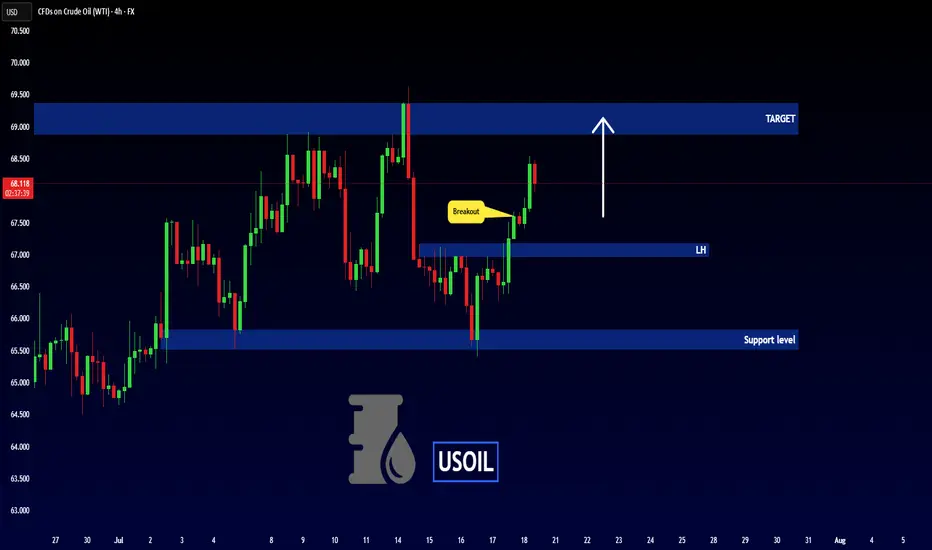
USOIL - BULLISH MOVE !Hello Traders !
The USOIL failed to create a new lower low!
The price broke the lower high (choch).
So, I expect a bullish move🚀
______________
TARGET: 68.880🎯
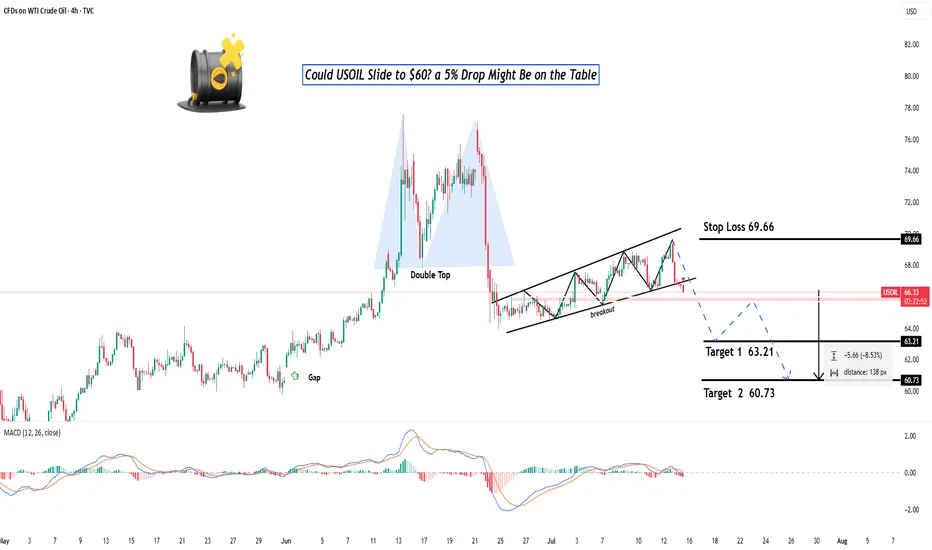
Could OIL Slide to $60? a 5% Drop Might Be on the Table? Hey Realistic Traders!
Price action is weakening. Will USOIL find support or slide further?
Let’s Break It Down..
On the 4H timeframe, oil has formed a double top pattern followed by a neckline breakout, which is a classic sign of a potential shift from a bullish to a bearish trend.
This breakout was confirmed by a break below the bullish trendline, accompanied by consecutive bearish full-body candlesticks that reinforce the bearish momentum. Afterward, the price formed a bearish continuation pattern known as a rising wedge, which was followed by a breakdown.
The combination of bearish reversal and continuation pattern breakouts signals further downside movement and confirms the shift into a bearish trend.
Therefore, we foresee the price forming lower lows and lower highs toward the first target at 63.21, with a potential extension to the close the gap at 60.73.
The bearish outlook remains valid as long as the price stays below the key stop-loss level at 69.66.
Support the channel by engaging with the content, using the rocket button, and sharing your opinions in the comments below.
Disclaimer: This analysis is for educational purposes only and should not be considered a recommendation to take a long or short position on USOIL.
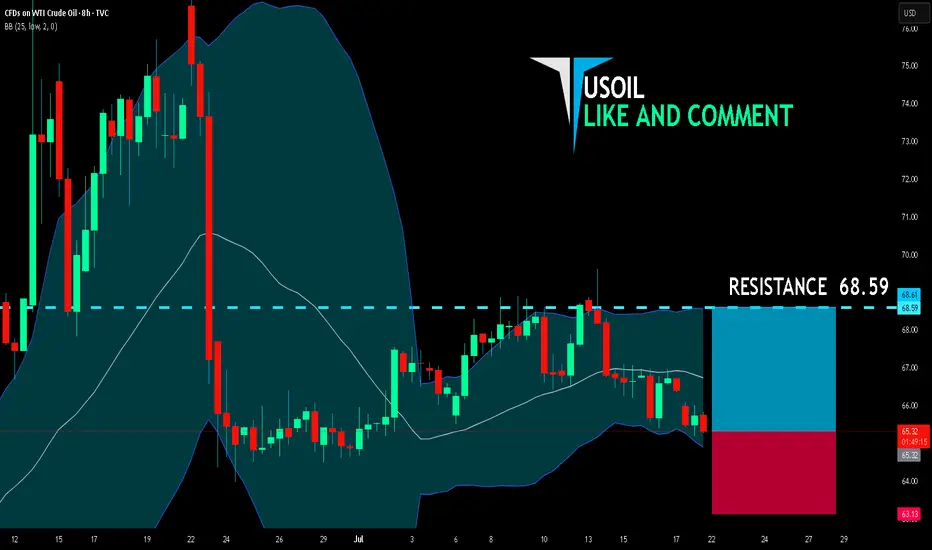
USOIL BULLS ARE STRONG HERE|LONG
USOIL SIGNAL
Trade Direction: long
Entry Level: 65.32
Target Level: 68.59
Stop Loss: 63.13
RISK PROFILE
Risk level: medium
Suggested risk: 1%
Timeframe: 8h
Disclosure: I am part of Trade Nation's Influencer program and receive a monthly fee for using their TradingView charts in my analysis.
✅LIKE AND COMMENT MY IDEAS✅
Oil weekly bear flagPresetly: seeing a weekly bear flag spotted on oil
Expecting: next weekly candle to be continuation red candle
Potential Long on WTI
Crude oil is showing potential for a bullish move due to increasing speculation about a possible agreement between China and the United States.
As we approach August 1st – the date associated with Trump's proposed tariff actions – the chances of a diplomatic breakthrough are growing.
If the two economic giants reach any form of understanding, it could trigger a wave of optimism in the oil market, potentially leading to a strong upward move.
Market participants should closely watch developments related to the US-China negotiations over the coming days.

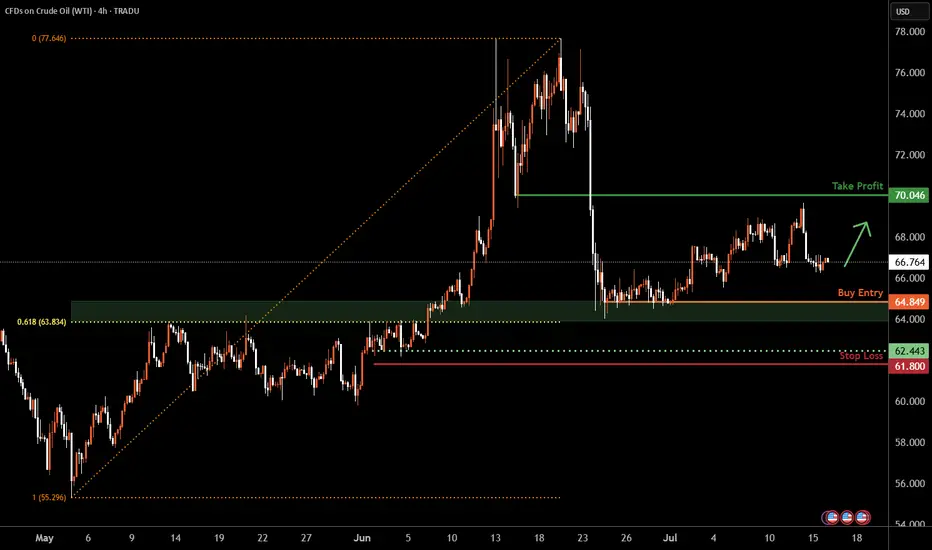
WTI Oil H4 | Potential bounce off a multi-swing-low supportWTI oil (USOIL) is falling towards a multi-swing-low support and could potentially bounce off this level to climb higher.
Buy entry is at 64.84 which is a multi-swing-low support that aligns closely with the 61.8% Fibonacci retracement.
Stop loss is at 61.80 which is a level that lies underneath a multi-swing-low support.
Take profit is at 70.04 which is a pullback resistance.
High Risk Investment Warning
Trading Forex/CFDs on margin carries a high level of risk and may not be suitable for all investors. Leverage can work against you.
Stratos Markets Limited (tradu.com ):
CFDs are complex instruments and come with a high risk of losing money rapidly due to leverage. 63% of retail investor accounts lose money when trading CFDs with this provider. You should consider whether you understand how CFDs work and whether you can afford to take the high risk of losing your money.
Stratos Europe Ltd (tradu.com ):
CFDs are complex instruments and come with a high risk of losing money rapidly due to leverage. 63% of retail investor accounts lose money when trading CFDs with this provider. You should consider whether you understand how CFDs work and whether you can afford to take the high risk of losing your money.
Stratos Global LLC (tradu.com ):
Losses can exceed deposits.
Please be advised that the information presented on TradingView is provided to Tradu (‘Company’, ‘we’) by a third-party provider (‘TFA Global Pte Ltd’). Please be reminded that you are solely responsible for the trading decisions on your account. There is a very high degree of risk involved in trading. Any information and/or content is intended entirely for research, educational and informational purposes only and does not constitute investment or consultation advice or investment strategy. The information is not tailored to the investment needs of any specific person and therefore does not involve a consideration of any of the investment objectives, financial situation or needs of any viewer that may receive it. Kindly also note that past performance is not a reliable indicator of future results. Actual results may differ materially from those anticipated in forward-looking or past performance statements. We assume no liability as to the accuracy or completeness of any of the information and/or content provided herein and the Company cannot be held responsible for any omission, mistake nor for any loss or damage including without limitation to any loss of profit which may arise from reliance on any information supplied by TFA Global Pte Ltd.
The speaker(s) is neither an employee, agent nor representative of Tradu and is therefore acting independently. The opinions given are their own, constitute general market commentary, and do not constitute the opinion or advice of Tradu or any form of personal or investment advice. Tradu neither endorses nor guarantees offerings of third-party speakers, nor is Tradu responsible for the content, veracity or opinions of third-party speakers, presenters or participants.
Crude oil trading reminder: triple positive support
💡Message Strategy
After three consecutive days of sluggishness, both U.S. and Brent crude oil remained above the 100-day moving average on Thursday (July 24). U.S. crude oil is currently up 0.4%, trading around 65.46; Brent crude oil is currently up 0.1%, trading around US$68.67 per barrel. The three engines of trade negotiations, unexpected decline in inventories, and geopolitical games are ignited at the same time. Oil prices showed signs of stabilizing, allowing bulls to "smell" the long-awaited rebound opportunity.
1. The trade war breaks the ice: the US, Japan and Europe have reached a series of agreements to ignite market hopes.
2. Inventories plummeted by 3.2 million barrels! The balance of supply and demand suddenly tilted.
3. Geopolitical black swan: The war between Russia and Ukraine burns the energy supply chain
📊Technical aspects
The short-term (4H) trend of crude oil fluctuated upward slightly. The moving average system gradually formed a bullish arrangement, and the short-term objective trend direction was upward. In terms of momentum, the MACD indicator opened upward above the zero axis, and the bullish momentum was sufficient.
In terms of form, the oil price broke through the neckline, and the head and shoulders bottom reversal pattern was established. It is expected that after the intraday crude oil trend retests the neckline position, the probability of forming another upward rhythm is high.
💰Strategy Package
Long Position:65.50-66.50,SL:64.00,Target:67.75-68.00
