USOIL Will Move Higher! Buy!
Please, check our technical outlook for USOIL.
Time Frame: 1D
Current Trend: Bullish
Sentiment: Oversold (based on 7-period RSI)
Forecast: Bullish
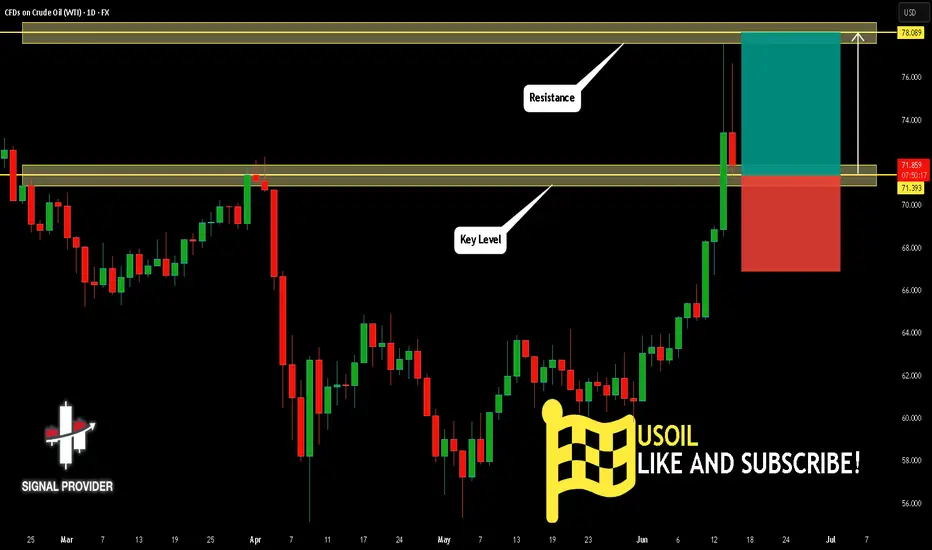
The price is testing a key support 71.393.
Current market trend & oversold RSI makes me think that buyers will push the price. I will anticipate a bullish movement at least to 78.089 level.
P.S
Overbought describes a period of time where there has been a significant and consistent upward move in price over a period of time without much pullback.
Disclosure: I am part of Trade Nation's Influencer program and receive a monthly fee for using their TradingView charts in my analysis.
Like and subscribe and comment my ideas if you enjoy them!
WTICOUSD trade ideas
Crude oil bottom?Crude oil was in big trouble back in April, just 2 months ago.
And just like that, the quarterly chart does its magic and reduced so much noise!
What looked like a critical breakdown, has now reversed, leaving an impressive lower wick on the candle!

USOIL Will Go Higher From Support! Buy!
Take a look at our analysis for USOIL.
Time Frame: 2h
Current Trend: Bullish
Sentiment: Oversold (based on 7-period RSI)
Forecast: Bullish
The market is testing a major horizontal structure 67.337.
Taking into consideration the structure & trend analysis, I believe that the market will reach 69.433 level soon.
P.S
The term oversold refers to a condition where an asset has traded lower in price and has the potential for a price bounce.
Overbought refers to market scenarios where the instrument is traded considerably higher than its fair value. Overvaluation is caused by market sentiments when there is positive news.
Disclosure: I am part of Trade Nation's Influencer program and receive a monthly fee for using their TradingView charts in my analysis.
Like and subscribe and comment my ideas if you enjoy them!

WTI Crude Oil Regains Bullish MomentumWTI Crude Oil Regains Bullish Momentum
WTI Crude oil prices climbed higher above $70.00 and might extend gains.
Important Takeaways for WTI Crude Oil Price Analysis Today
- WTI Crude oil prices started a decent increase above the $65.00 and $68.50 resistance levels.
- There is a major bullish trend line forming with support at $71.50 on the hourly chart of XTI/USD at FXOpen.
Oil Price Technical Analysis
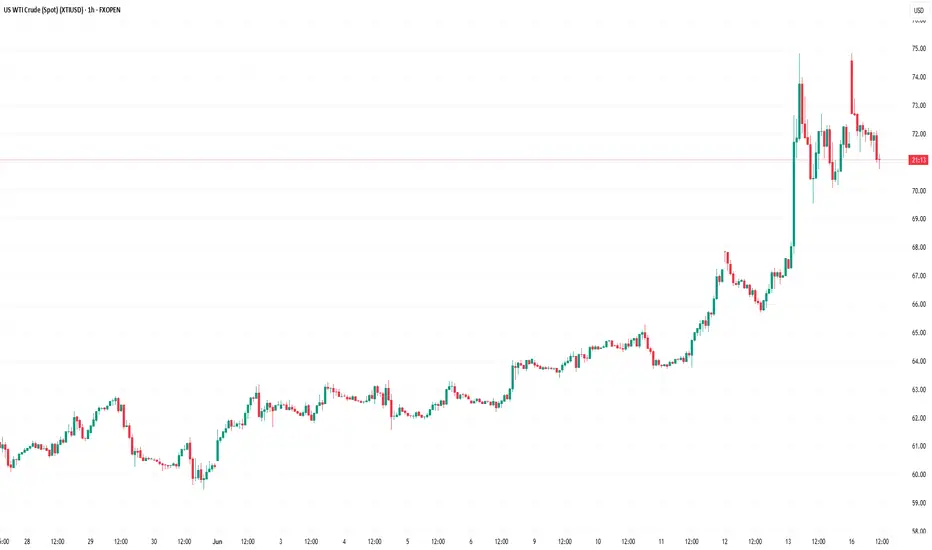
On the hourly chart of WTI Crude Oil at FXOpen, the price started a decent upward move from $65.00 against the US Dollar. The price gained bullish momentum after it broke the $68.50 resistance and the 50-hour simple moving average.
The bulls pushed the price above the $69.50 and $71.50 resistance levels. The recent high was formed at $74.80 and the price started a downside correction. There was a minor move below the 50% Fib retracement level of the upward move from the $69.55 swing low to the $74.83 high.
The RSI is now below the 60 level. Immediate support on the downside is near the $71.50 zone. There is also a major bullish trend line forming with support at $71.50 and the 61.8% Fib retracement level of the upward move from the $69.55 swing low to the $74.83 high.
The next major support on the WTI crude oil chart is near the $69.50 zone, below which the price could test the $67.90 level. If there is a downside break, the price might decline toward $65.20. Any more losses may perhaps open the doors for a move toward the $63.75 support zone.
If the price climbs higher again, it could face resistance near $72.50. The next major resistance is near the $74.80 level. Any more gains might send the price toward the $78.50 level.
This article represents the opinion of the Companies operating under the FXOpen brand only. It is not to be construed as an offer, solicitation, or recommendation with respect to products and services provided by the Companies operating under the FXOpen brand, nor is it to be considered financial advice.
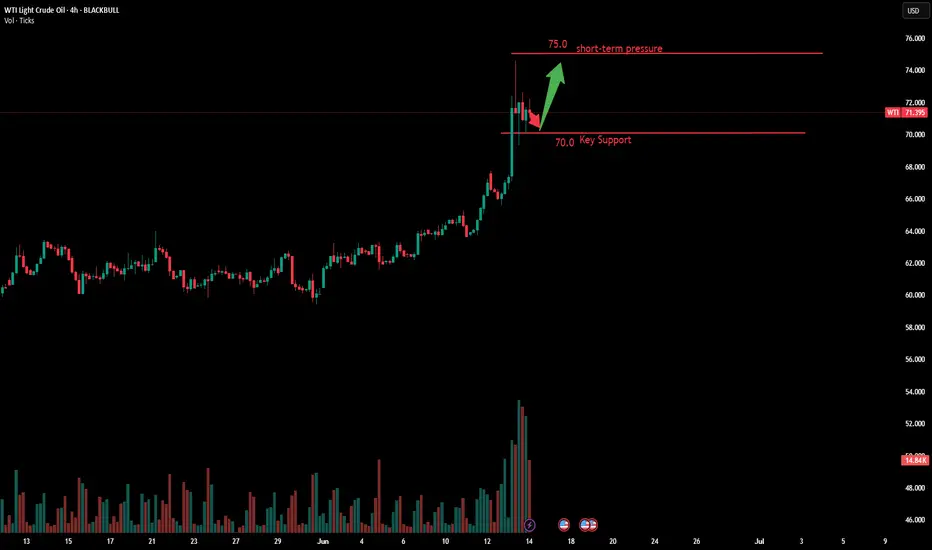
Today's Crude Oil Trend Analysis and Trading RecommendationsFrom a daily chart perspective, the violent rally in USOIL driven by external factors has completely disrupted prior technical expectations. The sharp surge has also significantly exhausted future upside potential, explaining today's gap-up and subsequent decline. With minimal likelihood of near-term de-escalation in the Iran situation, USOIL is likely to remain bullish. However, severe overbought conditions on technical charts have disrupted structural expectations, necessitating a price correction.
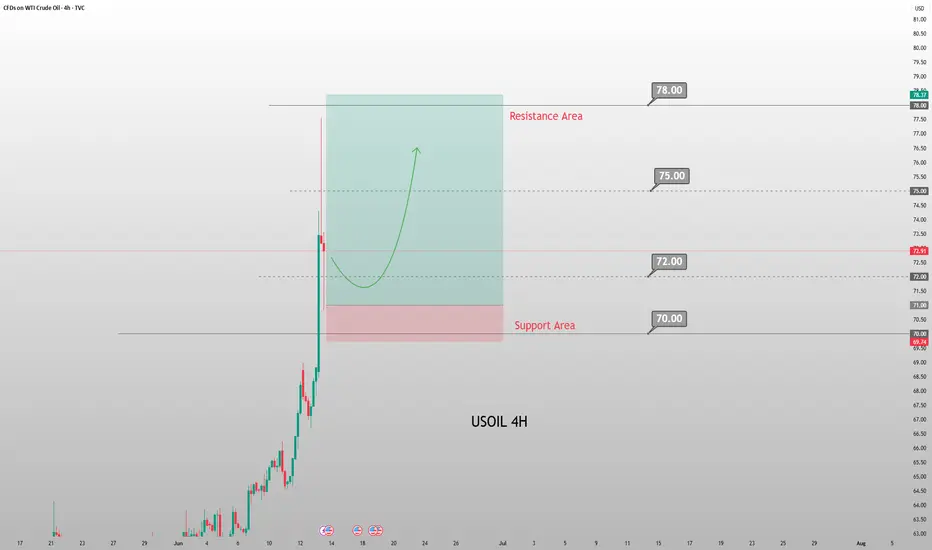
Technically, the $70-$75 range serves as a reasonable short-term consolidation zone, contingent on no severe escalation in Iran tensions. Given the high probability of worsening tensions, USOIL may retest $75 and even challenge $80 driven by geopolitical developments.
Thus, while the market remains focused on Iran-related risks, the short-term bias remains bullish. Avoid chasing the rally recklessly. Focus on the $70.5-$71.5 pullback zone early in the week—consider long entries only after price consolidation in this area.
USOIL
buy@70.50-71.50
tp:74-76-78
Investment itself is not the source of risk; it is only when investment behavior escapes rational control that risks lie in wait. In the trading process, always bear in mind that restraining impulsiveness is the primary criterion for success. I share trading signals daily, and all signals have been accurate without error for a full month. Regardless of your past profits or losses, with my assistance, you have the hope to achieve a breakthrough in your investment.

Crude oil is the ultimate winner
💡Message Strategy
Currently trading around $70.00 a barrel during Friday's European session, crude oil prices surged on growing concerns about supply disruptions. Rising tensions in the Middle East threaten navigation through the Strait of Hormuz, a key passage for about 20% of global oil shipments.
📊Technical aspects
From the daily chart level, crude oil prices in the medium term broke through the upper resistance of the range and tested a new high of 75.50. The moving average system is in a bullish arrangement, and the medium-term objective trend is upward.
The current trend is in the upward rhythm of the main trend. The MACD indicator fast and slow lines overlap with the bullish column above the zero axis, indicating that the bullish momentum is currently full, and it is expected that the medium-term trend is expected to usher in a wave of rising rhythm.
The short-term (1H) trend of crude oil continued to fluctuate upward, and the price near 74 was tested. The moving average system relies on the bullish arrangement of oil prices, and the short-term objective trend direction remains upward. Oil prices hit a new high near 75.30, and then fell back and closed with a negative real candlestick. The short-term momentum is still bullish, and it is expected that the trend of crude oil will continue to maintain a high-level oscillation upward rhythm.
💰 Strategy Package
Long Position:70.09-71.50

WTI Oil H1 | Potential bullish bounceWTI oil (USOIL) is falling towards a multi-swing-low support and could potentially bounce off this level to climb higher.
Buy entry is at 71.83 which is a multi-swing-low support.
Stop loss is at 68.50 which is a level that lies underneath a pullback support and the 50% Fibonacci retracement.
Take profit is at 77.60 which is a swing-high resistance.
High Risk Investment Warning
Trading Forex/CFDs on margin carries a high level of risk and may not be suitable for all investors. Leverage can work against you.
Stratos Markets Limited (tradu.com ):
CFDs are complex instruments and come with a high risk of losing money rapidly due to leverage. 63% of retail investor accounts lose money when trading CFDs with this provider. You should consider whether you understand how CFDs work and whether you can afford to take the high risk of losing your money.
Stratos Europe Ltd (tradu.com ):
CFDs are complex instruments and come with a high risk of losing money rapidly due to leverage. 63% of retail investor accounts lose money when trading CFDs with this provider. You should consider whether you understand how CFDs work and whether you can afford to take the high risk of losing your money.
Stratos Global LLC (tradu.com ):
Losses can exceed deposits.
Please be advised that the information presented on TradingView is provided to Tradu (‘Company’, ‘we’) by a third-party provider (‘TFA Global Pte Ltd’). Please be reminded that you are solely responsible for the trading decisions on your account. There is a very high degree of risk involved in trading. Any information and/or content is intended entirely for research, educational and informational purposes only and does not constitute investment or consultation advice or investment strategy. The information is not tailored to the investment needs of any specific person and therefore does not involve a consideration of any of the investment objectives, financial situation or needs of any viewer that may receive it. Kindly also note that past performance is not a reliable indicator of future results. Actual results may differ materially from those anticipated in forward-looking or past performance statements. We assume no liability as to the accuracy or completeness of any of the information and/or content provided herein and the Company cannot be held responsible for any omission, mistake nor for any loss or damage including without limitation to any loss of profit which may arise from reliance on any information supplied by TFA Global Pte Ltd.
The speaker(s) is neither an employee, agent nor representative of Tradu and is therefore acting independently. The opinions given are their own, constitute general market commentary, and do not constitute the opinion or advice of Tradu or any form of personal or investment advice. Tradu neither endorses nor guarantees offerings of third-party speakers, nor is Tradu responsible for the content, veracity or opinions of third-party speakers, presenters or participants.

POSSIBLE BUY OPPORTUNITY ON OILOIL has been strongly bullish lately. We see a nice area of demand converging on a support line. We aim to take a buy at this point!

Next Week's Crude Oil Trend Analysis and Trading RecommendationsThe continued escalation of geopolitical tensions in the Middle East remains the core driver propelling oil prices higher. With U.S.-Iran relations at a critical juncture and the Ukrainian attack on the Crimean Bridge exacerbating the Russia-Ukraine conflict, markets are increasingly concerned about potential disruptions to Black Sea crude exports. As a key channel for 2% of global crude oil supplies, risks to Black Sea exports directly threaten supply chain security, triggering a surge in short-term market risk aversion and driving oil prices sustainably higher.
Since crude oil broke through the $64.8 resistance level with a solid candlestick last week, we have maintained a consistent bullish stance. After two weeks of consolidative oscillations, prices finally broke free from the trading range, fully demonstrating the dominance of bullish momentum. When oil prices pulled back to the $71.5–$72.0 range last Friday, we once again emphasized the short-term long strategy, which was subsequently followed by a sharp rally catalyzed by news developments. With the current trend clearly defined, we advise trading in line with the momentum: short-term long positions can be initiated above $71.0 at the start of the week.
USOIL
buy@71-72
tp:75-78
Investment itself is not the source of risk; it is only when investment behavior escapes rational control that risks lie in wait. In the trading process, always bear in mind that restraining impulsiveness is the primary criterion for success. I share trading signals daily, and all signals have been accurate without error for a full month. Regardless of your past profits or losses, with my assistance, you have the hope to achieve a breakthrough in your investment.
USOIL Remains Bullish Amid Geopolitical Tensions and Steady Fed USOIL – Bullish Outlook Amid Geopolitical and Policy Factors
The ongoing escalation in the Middle East, combined with Jerome Powell's stance on holding interest rates steady, continues to support bullish momentum across commodities, including oil.
Technical Outlook:
USOIL remains bullish as long as it trades above 72.72 and more firmly above 70.40, with upside potential toward 77.30 and 79.50. If bullish momentum persists, a further extension to 84.14 is possible, supported by geopolitical risks.
A bearish shift is only likely if significant de-escalation or negotiations between Israel and Iran take place.
Key Levels:
• Pivot Point: 72.90
• Resistance: 77.29, 79.50, 84.10
• Support: 66.87, 63.52, 59.00
Trend Outlook:
Bullish while price holds above 68.53

WTI OIL SPOT / Crude Oil SpotCrude has appreciated from 55 odd levels to 73+
In the wake of Iran israel conflict...
Crude is likely to surge higher...
Above 94$ Crude cruising to 102/104 levels in all likelihood.
Have marked important levels on chart for ur perusal
Happy trading
Like...... Share........ and Follow for more updates...

Crude Oil to Continue Breaking Higher HighsMiddle East Tensions Escalate Sharply: Israel Launches Preemptive Strike on Iran, Targeting Nuclear-related Facilities
Iran's state media confirmed that senior Revolutionary Guard leaders were killed in the attack, with nuclear scientists and facilities also suffering heavy damage. In the short term, geopolitical risks will continue to dominate market sentiment. Oil prices are likely to oscillate at high levels or even edge higher. From a daily chart perspective, crude oil's moving average system forms a bullish arrangement, confirming the unchanged short-term objective uptrend. The morning session K-line closes as a large bullish candlestick, aligning with the primary upward trend. The MACD indicator is bullishly diverging above the zero axis, with bullish momentum prevailing. Intraday crude oil is expected to continue breaking higher.
Humans need to breathe, and perfect trading is like breathing—maintaining flexibility without needing to trade every market swing. The secret to profitable trading lies in implementing simple rules: repeating simple tasks consistently and enforcing them strictly over the long term.
Trading Strategy:
buy@70.0-71.0
TP:74.0-75.0
Bearisj outlook on usoil Structurally, usoil is in a bearish engineering liquidity phase , I expect to see a bearish push tohe downside from his level

Crude oil is gaining volatilityCrude oil accelerates the momentum as the geopolitical situation escalates. Volatility is high, so trading might be dangerous both for longs and shorts, especially for day or short-term traders.
So, it would make sense to wait for a while until the “smoke goes down” and the price would establish a temporary trading range, which would later be broken to any direction.
The price currently is above the 20-day moving average for $12 in terms of asset price, which is more than 5 times greater than the average daily volatility. It either points to the “overheated” situation or potentially a momentum situation, which means the rapid continuation to the upside after a short phase of consolidation (usually 2-3 days).
Don't forget - this is just the idea, always do your own research and never forget to manage your risk!

Unfortunate but an opportunity nonetheless Welcome to warring times. Energy of all kinds, oil, and many of the likes will see major spikes as conflicts and tensions rise. Currencies will spike and crash and gold MAY inflate as times of uncertainties rallies gold bulls like school bells to kids for recess.

USOIL: Absolute Price Collapse Ahead! Short!
My dear friends,
Today we will analyse USOIL together☺️
The recent price action suggests a shift in mid-term momentum. A break below the current local range around 73.387 will confirm the new direction downwards with the target being the next key level of 72.481.and a reconvened placement of a stop-loss beyond the range.
❤️Sending you lots of Love and Hugs❤️

USOIL The current conflict between Iran and Israel has caused a sharp spike in oil prices due to fears of supply disruptions in a geopolitically sensitive region that is critical for global energy flows.
Key Effects on Oil Prices:
Price Surge:
Oil prices jumped over 7% on June 13, 2025, reaching multi-month highs. Brent crude rose to $76.190 close 73.535 per barrel, while U.S. West Texas Intermediate (WTI) crude climbed to around $77.542 before closing at 72.91 per barrel on Friday
Earlier intraday spikes were even higher, with Brent briefly surging over 13% and WTI over 14%, marking the largest single-day gains since March 2022.
Risk Premium and Supply Concerns:
The Israeli strike on Iran significantly raised the "risk premium" on oil prices as markets worry about potential retaliation by Iran targeting oil infrastructure or blocking the Strait of Hormuz, a vital shipping route for about 20% of the world’s oil.
Iran produces about 3.3 million barrels per day (3% of global supply) and exports 1.5 million barrels daily, mainly to China and Turkey. Disruptions here could tighten global supply considerably.
Potential for Further Price Increases:
Analysts warn that if the conflict escalates, oil prices could surge beyond current levels, potentially topping $93 to $100 per barrel if Iran blocks the Strait of Hormuz or attacks Gulf energy installations.
Goldman Sachs projects Brent crude could peak slightly above $90 per barrel before falling back as supply stabilizes.
Broader Market Impact:
The conflict has also caused stock market declines and a flight to safe-haven assets like gold, which rose sharply alongside the oil price spike.
U.S. gasoline prices are expected to rise in the coming days due to higher crude costs, potentially increasing fuel prices significantly if the conflict worsens.
Summary
The Iran-Israel conflict has already caused a major jump in oil prices due to fears of supply disruptions in a key oil-producing region. The risk of Iran retaliating by targeting oil infrastructure or blocking the Strait of Hormuz could lead to sustained higher prices, with some analysts warning of a possible spike to $93–$100 per barrel if tensions escalate further. This situation is closely monitored by markets given its potential to impact global energy supplies and inflation worldwide
#USOIL #OIL

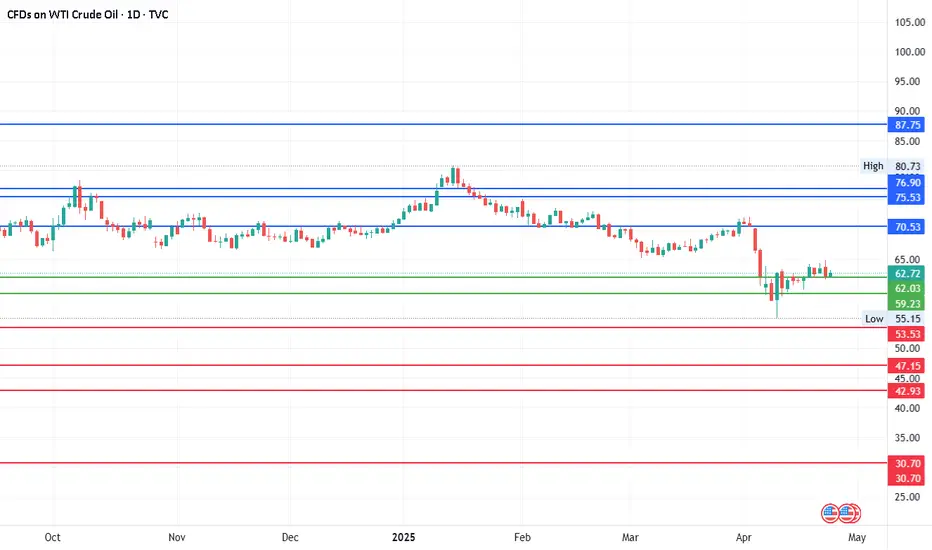
Crude oilCurrent Price: 62.60
Mid-Point Range: 59.23 to 62.03
Upside Targets: 70.53, 75.53, 76.90 and 87.75 (Between 75.53 & 76.90 could be next
Posible range to be in a consolidation mode.
Downside Targets: 53.53, 47.15, 42.93, 30.70
USOIL Will Go Up From Support! Long!
Please, check our technical outlook for USOIL.
Time Frame: 12h
Current Trend: Bullish
Sentiment: Oversold (based on 7-period RSI)
Forecast: Bullish
The price is testing a key support 73.374.
Current market trend & oversold RSI makes me think that buyers will push the price. I will anticipate a bullish movement at least to 78.914 level.
P.S
The term oversold refers to a condition where an asset has traded lower in price and has the potential for a price bounce.
Overbought refers to market scenarios where the instrument is traded considerably higher than its fair value. Overvaluation is caused by market sentiments when there is positive news.
Disclosure: I am part of Trade Nation's Influencer program and receive a monthly fee for using their TradingView charts in my analysis.
Like and subscribe and comment my ideas if you enjoy them!

Crude Oil Weekly Chart Watch
The weekly crude oil line is still running within the channel. This is very interesting.
Last week, due to geopolitical conflicts, crude oil rose rapidly to the upper edge of the weekly channel.
It closed with a long upper shadow weekly K line.
This point is not suitable for chasing more. Observe more.
Wait and see
My personal opinion:Still leaning towards bullish
If it were you, what would you choose?
Welcome to discuss

Iran vs Israel Conflict: Which assets are being affected?The ongoing conflict between Iran and Israel has had a notable impact on global stock markets and currency pairs, primarily driven by concerns over oil supply disruptions and increased geopolitical uncertainty.
Here's a breakdown of the affected assets:
Stocks
Overall Market Decline: Major global stock indices, including the Dow Jones Industrial Average, S&P 500, Nasdaq Composite, and India's Sensex and Nifty 50, have experienced declines following the escalation of tensions.
Negatively Impacted Sectors/Stocks:
Airlines & Travel: Companies like United Airlines, Delta Air Lines, American Airlines, and cruise operators (e.g., Norwegian Cruise Line Holdings, Carnival Corp.) have seen sharp losses due to surging fuel costs and reduced travel sentiment. Hotel operators (e.g., Hilton, Marriott) and car rental companies (e.g., Avis Budget Group, Hertz) also felt the impact.
Consumer Discretionary: Companies tied to discretionary spending and those with high energy-input costs (e.g., General Motors, Ford, Target, Best Buy, Nike) have been negatively affected, as rising oil prices can impact consumer behaviour.
Technology & Financials: Broad technology companies, particularly those producing consumer goods, and the financial sector have seen declines.
US-listed Israeli Companies: Companies like Check Point Software Technologies, Teva Pharmaceutical Industries, Mobileye Global, and eToro Group experienced drops.
Positively Impacted/Benefiting Sectors/Stocks:
Oil & Energy: Oil prices surged, leading to gains for energy stocks such as Exxon Mobil, ConocoPhillips, and Diamondback Energy.
Defence: Defence contractors like Lockheed Martin, RTX Corporation, and Northrop Grumman have rallied due to increased geopolitical uncertainty.
Gold Miners: Shares of gold miners (e.g., Newmont, AngloGold Ashanti) rose as gold prices climbed, driven by safe-haven demand.
Renewable Energy/EVs: Electric-vehicle maker Tesla and solar power companies like First Solar and SolarEdge Technologies saw gains, possibly as alternatives to fossil fuels.
Currency Pairs
Safe-Haven Currencies Strengthen:
US Dollar (USD): The US dollar has rallied against most G7 currencies, benefiting from safe-haven flows.
Japanese Yen (JPY): The Japanese Yen strengthened as investors sought safety.
Swiss Franc (CHF): The Swiss Franc also gained alongside other safe-haven assets.
Gold (XAU/USD): Gold prices surged to multi-month highs, trading above $3,400 per troy ounce, reflecting strong safe-haven demand.
Risk-Sensitive Currencies Weaken:
Euro (EUR/USD): The EUR/USD pair retreated, with the Euro being "hardly damaged" initially but experiencing downward pressure from the escalating conflict.
Australian Dollar (AUD) & New Zealand Dollar (NZD): These risk-sensitive Asian currencies weakened.
Indian Rupee (INR): The Indian Rupee weakened against the US dollar due to the impact of rising crude oil prices on India, a major oil importer.
While the immediate market response has shown volatility and a "risk-off" sentiment, some analysts suggest that the longer-term impact will depend on the conflict's duration and whether it escalates into a broader regional or global issue, particularly concerning oil supply disruptions.


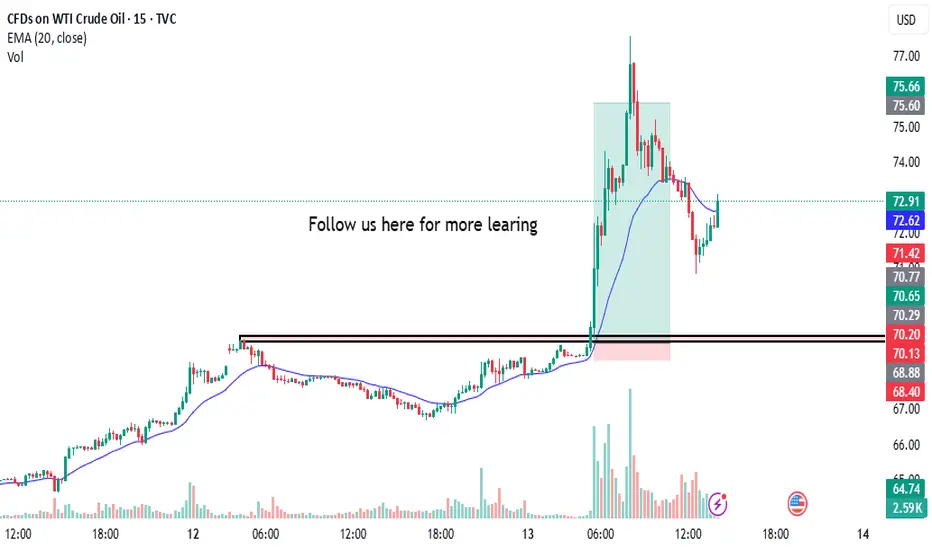
Captures 1:15 in US OIL Today i captures 1:15 in us oil
the annalysis was simple and clean as always i took trade on breakout of zone with proper research & annalysis and booom, as always we got our profit
follow us for more learing here