West Texas OilWest Texas OilWest Texas Oil

West Texas Oil

No trades
See on Supercharts

West Texas Oil forum


USOIL
USOIL Intraday Trade Setups

💡 Intraday Buy Setup

Entry: 🎯 69.31 (Confluence of Daily Fib 50% Retracement & Trendline Support)
Stop Loss: ⚠️ 68.80 (Below Swing Low & Liquidity Pool)
Take Profit 1: 🏁 70.20 (Immediate Fib Resistance)
Take Profit 2: 🚩 70.75 (Structural Swing High)

Reason:

Bullish RSI divergence on 1H timeframe at 69.31
OPEC+ supply cuts speculation supporting prices

💡 Intraday Sell Setup

Entry: 🎯 69.75 (Daily Pivot Resistance & Bearish Order Block)
Stop Loss: ⚠️ 70.30 (Above Fib 61.8% Extension)
Take Profit 1: 🏁 69.00 (Key Fib Support)
Take Profit 2: 🚩 68.50 (Swing Low Target)

Reason:

Bearish MACD crossover on 4H chart at 69.75
Rising US crude inventories pressuring sentiment

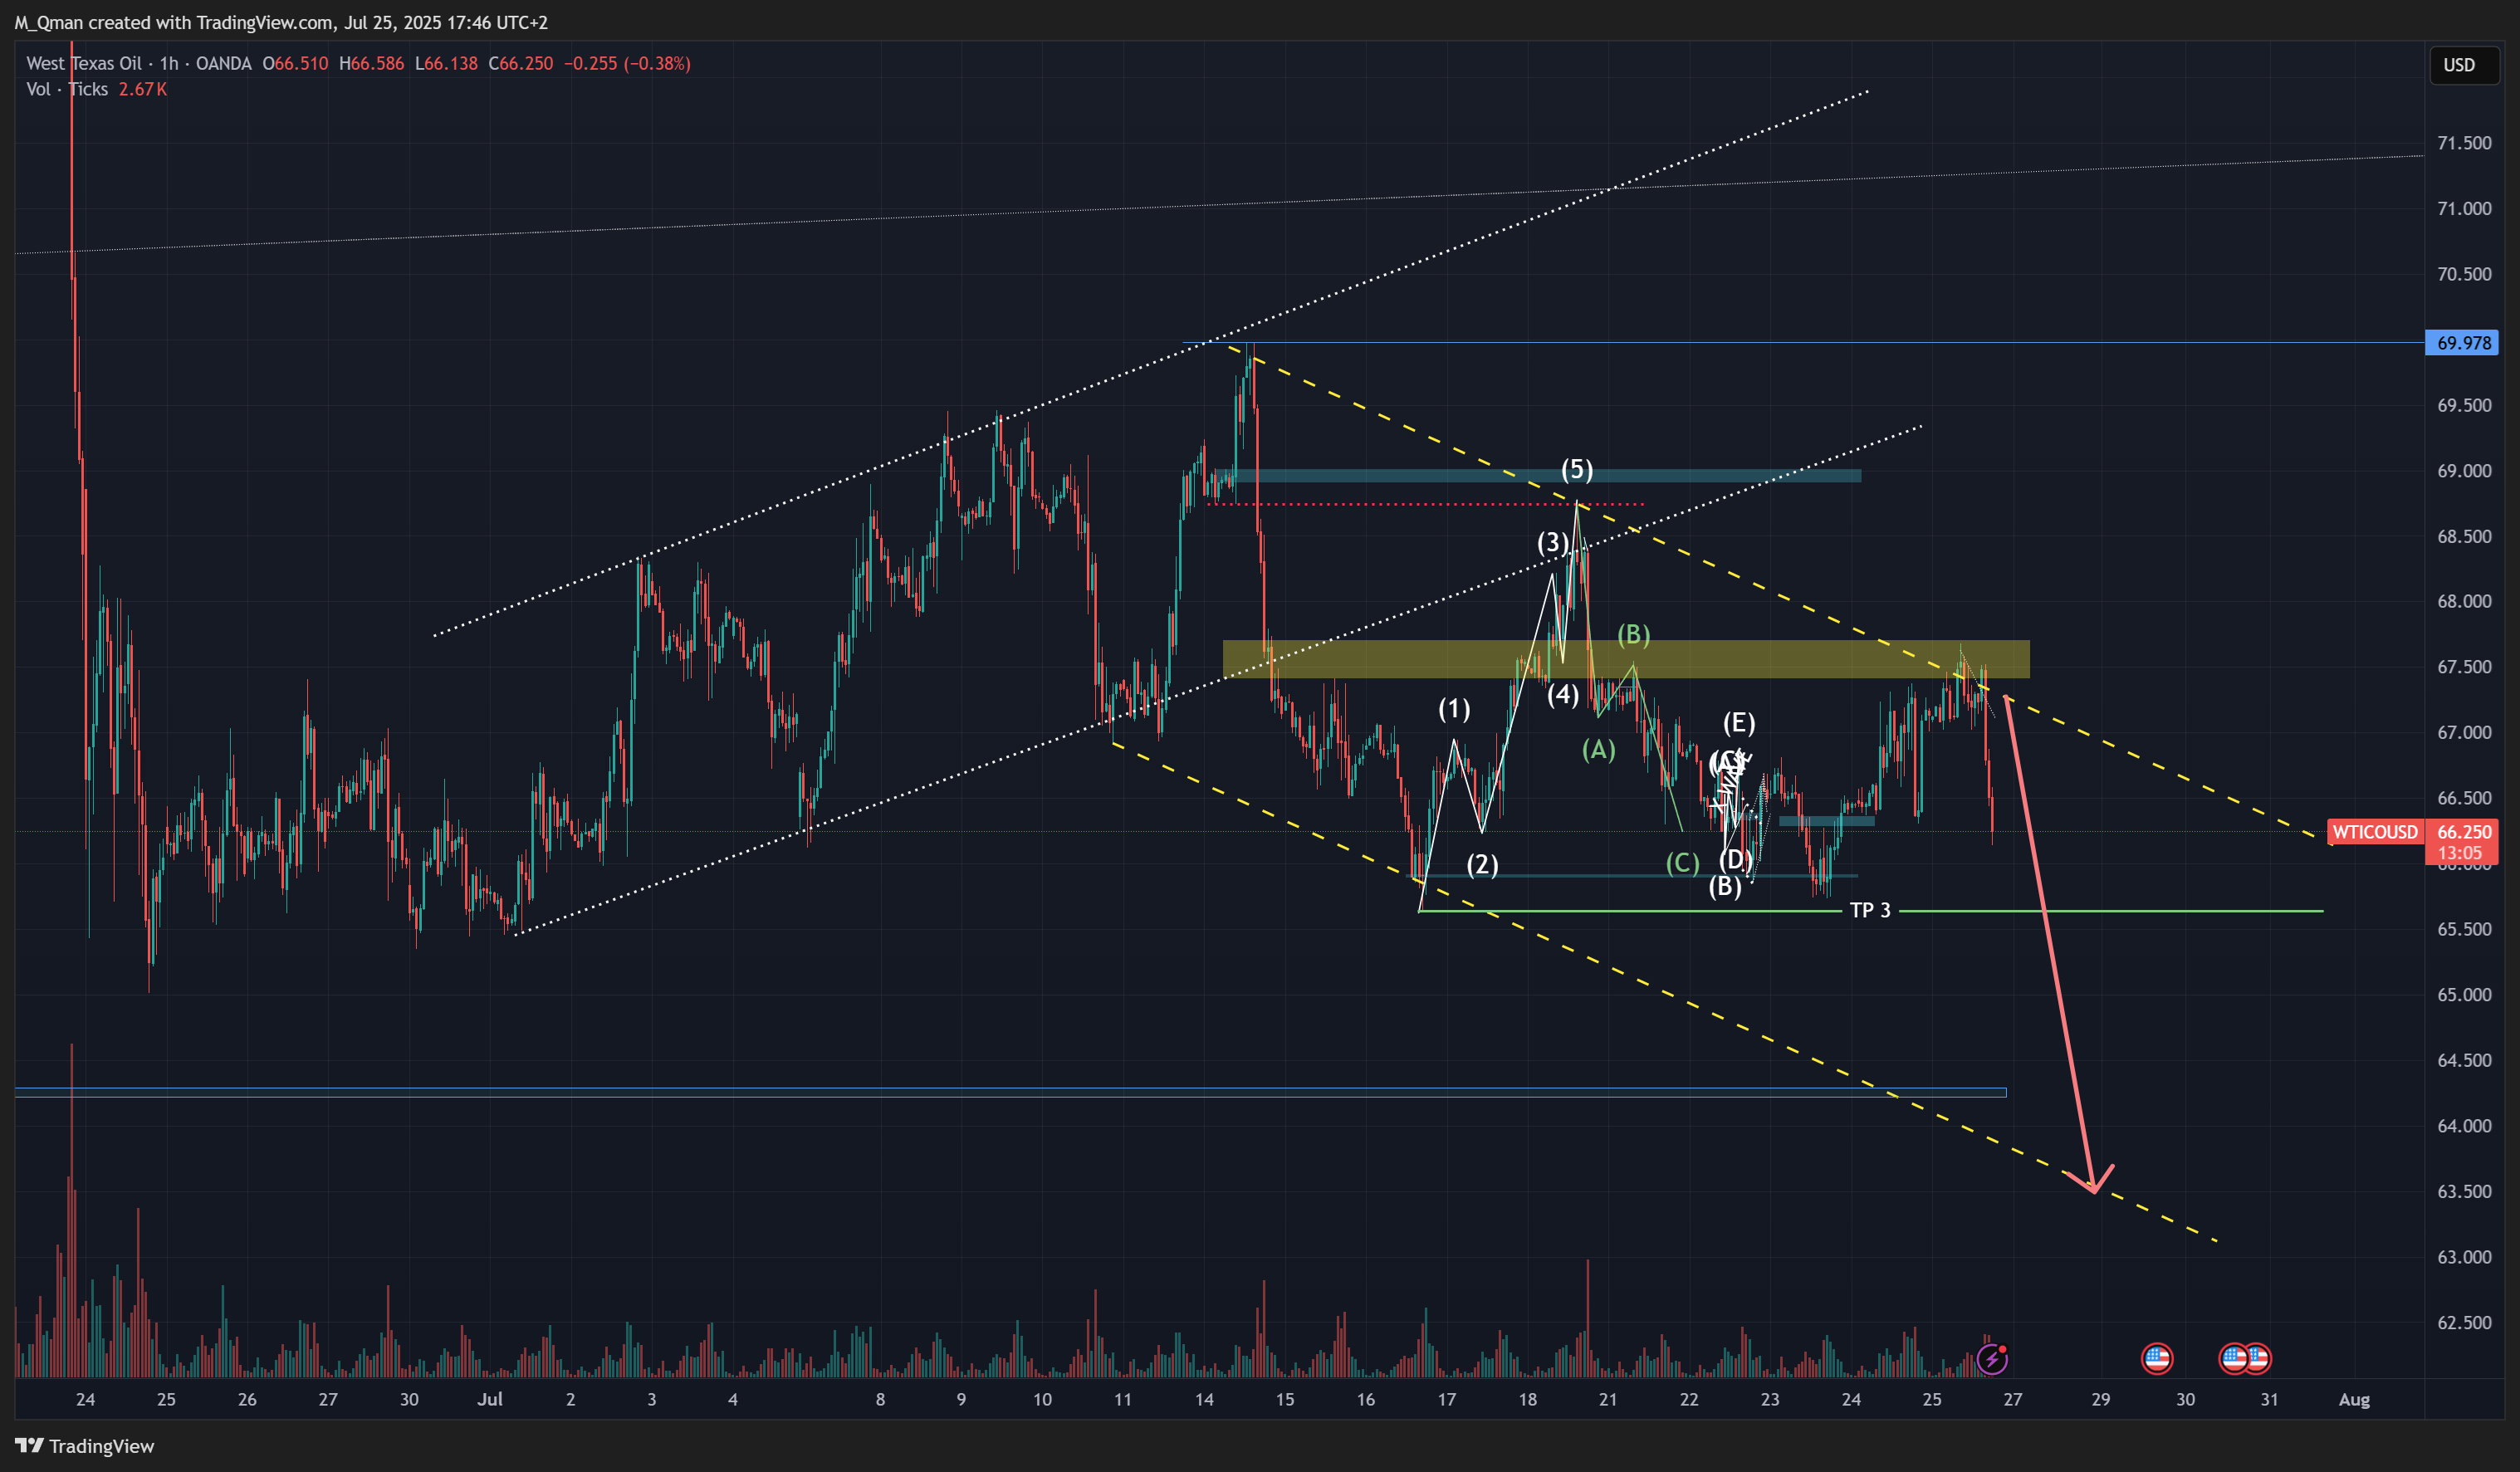
USOIL i see a nasty C wave here.

the ABC corrective wave played out as a tripple top so far. i think we are still in C Wave and aiming to the FVG at 67.5 USD.

It's the first structure in C wave, after an impulse ZigZag down. Structure is forming a giant ABC Pattern, which hit the Swing Highs of 5 And the B wave.

Nice reaction on top, and now fall back down. We see a Giant M, often forms before Wave C getting momentum.

The White dashed Chanel still in play. TopTrendline is respected. now the 4th hit will be down. Aiming to the Area of Wave 2, which has the FVG and the Chanel bottom inside.

Market is volantile today. everything possible. but bulls don't seem to break break above the Chanel. Strong Resistance around 70 USD.
Snapshot

USOIL
USOIL Daily Analysis Based on Main Key Levels – 31 March 2025

Daily Current Market Price (DCMP): 69.48

🗝️ Critical Price Framework
Below DCMP (Support):

🟢 69.04 (Swing Low Confluence & Fib Support)
🟢 68.21 (High-Liquidity Zone Anchor)

Above DCMP (Resistance):

🔴 69.88 (Immediate Swing High)
🔴 70.46 (Multi-Session Barrier)

🌐 Market Context

Swing Levels:

◼ Structural Swing High: 73.11
◼ Structural Swing Low: 66.12

Fibonacci Framework:

▫ 61.8% Retracement Cluster: 68.60–69.31 (Reversal Zone)
▫ 127.2% Extension Threshold: 70.02 (Breakout Catalyst)

📊 Technical Momentum Snapshot

✅ RSI Divergence: Neutral at 52.4 (4H bullish divergence emerging)
✅ MACD Signal: Histogram nearing zero line crossover (bullish momentum buildup)
✅ Volume Profile: Heavy liquidity at 68.87–69.75 range

💡 Trade Idea 1: Intraday Buy Setup

Entry: 🎯69.04 (Confluence of Weekly Pivot & Fib Support)
Stop Loss: ⚠️68.16 (Below Key Liquidity Pool)
Take Profit 1: 🏁69.75 (Immediate Resistance)
Take Profit 2: 🚩70.46 (Structural High Retest)

Rationale:

Bullish hammer pattern on 4H timeframe at 69.04
OPEC+ supply cut rumors supporting downside protection

💡 Trade Idea 2: Intraday Sell Setup

Entry: 🎯69.88 (Confluence of Swing High & Fib Extension)
Stop Loss: ⚠️70.46 (Above Multi-Session Resistance)
Take Profit 1: 🏁69.31 (Retracement Base)
Take Profit 2: 🚩68.60 (Liquidity Grab Zone)

Rationale:

Bearish rejection at 70.02 resistance cluster
Rising US crude inventories pressuring upside

📉 Strategic Observations

Price Magnetism:

Institutional orders clustered at 69.31 (200-period EMA)

Sentiment Shift:

Rising geopolitical risk premium in Middle East

Event Risk:

Wednesday’s EIA inventory data may amplify volatility

🔭 Forward Guidance

Monitor:

◼ Sustained close above 69.88 → Targets 70.46
◼ Breakdown below 69.04 → Opens 68.21 retest

Note: Implement 1:3 risk-reward ratios with trailing stops. Confirm trades with closing price breaks beyond key levels.

📌 Key Insight:

USOIL consolidates between 69.04–69.88. Prioritize range-fade strategies at tested technical boundaries with 1% risk tolerance, aligning with API inventory data-driven liquidity pools.


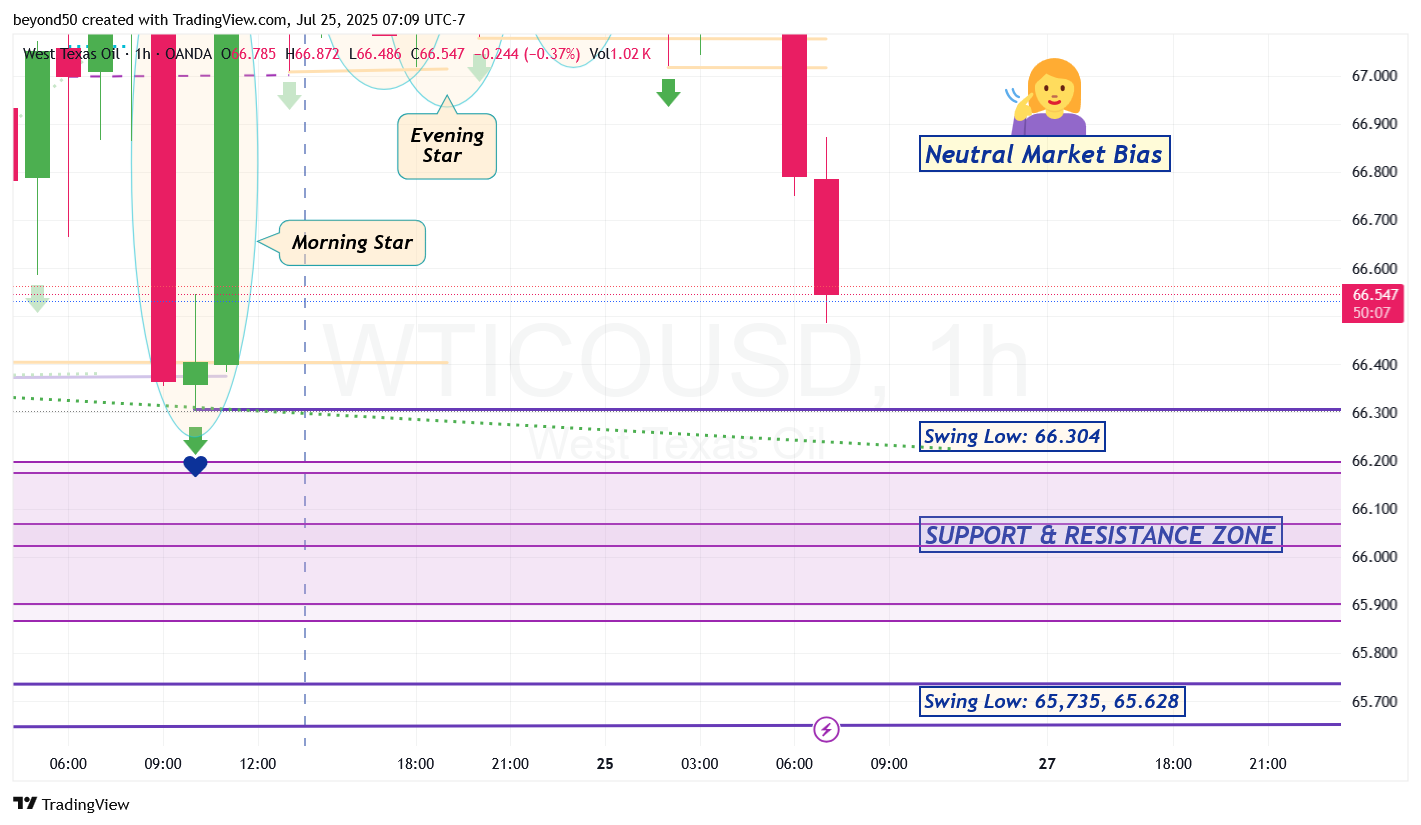
USOIL Switching to the Daily. A Bearish Pressure Zone formed earlier that encouraged the drop down.

If the current, Daily candle still forming does not do a candle close below the low of the previous bearish candle (shown as an orange dotted line at 68.90), then there will be no follow through of a bearish move down from bullish pressure building.

But, if the bears do breach the low of the previous bearish candle (at 68.90), then the bearish thrust will continue.
Snapshot

WTI Special Alert!
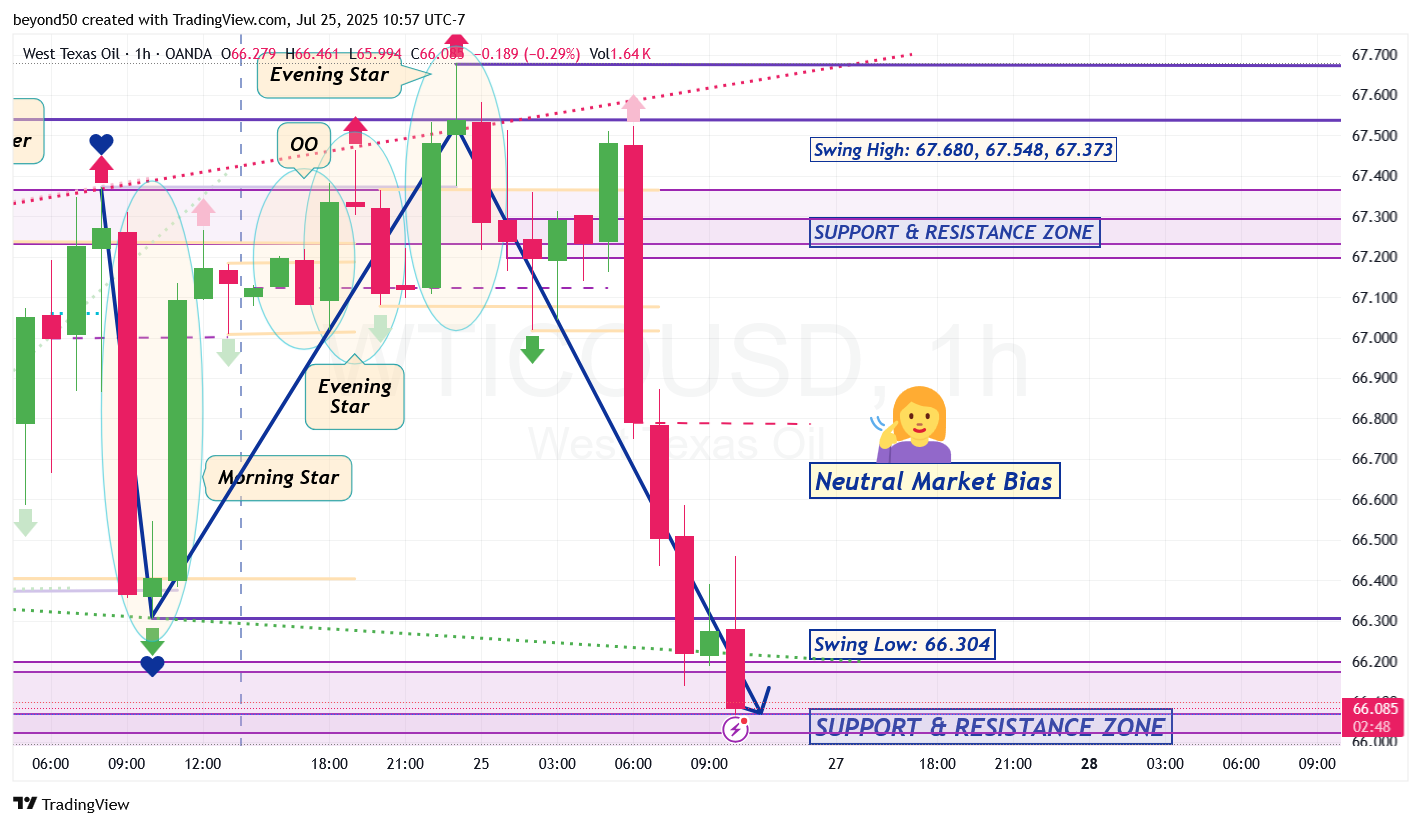
A Triple Inside Day printed on the Hourly that is in Bearish Market Bias. That shows a very BIG move is coming, either to the upside or downside.

A Double Bottom formed earlier from the rejection of the Swing Low (at 68.615) by the bears.

Also, a second tier formed to create a tall S&R Zone. We'll see if the bulls can rise above it to bounce up from because two bearish candles formed a Tweezers Bottom to have the same price at their lows - creating a Resistance Line.

If no rise above the S&R Zone, the bears can break the Resistance Line created by the Tweezers Bottom, leading to a BIG drop below towards the Swing Lows of 68.615 and 68.395 to breach them.
Snapshot


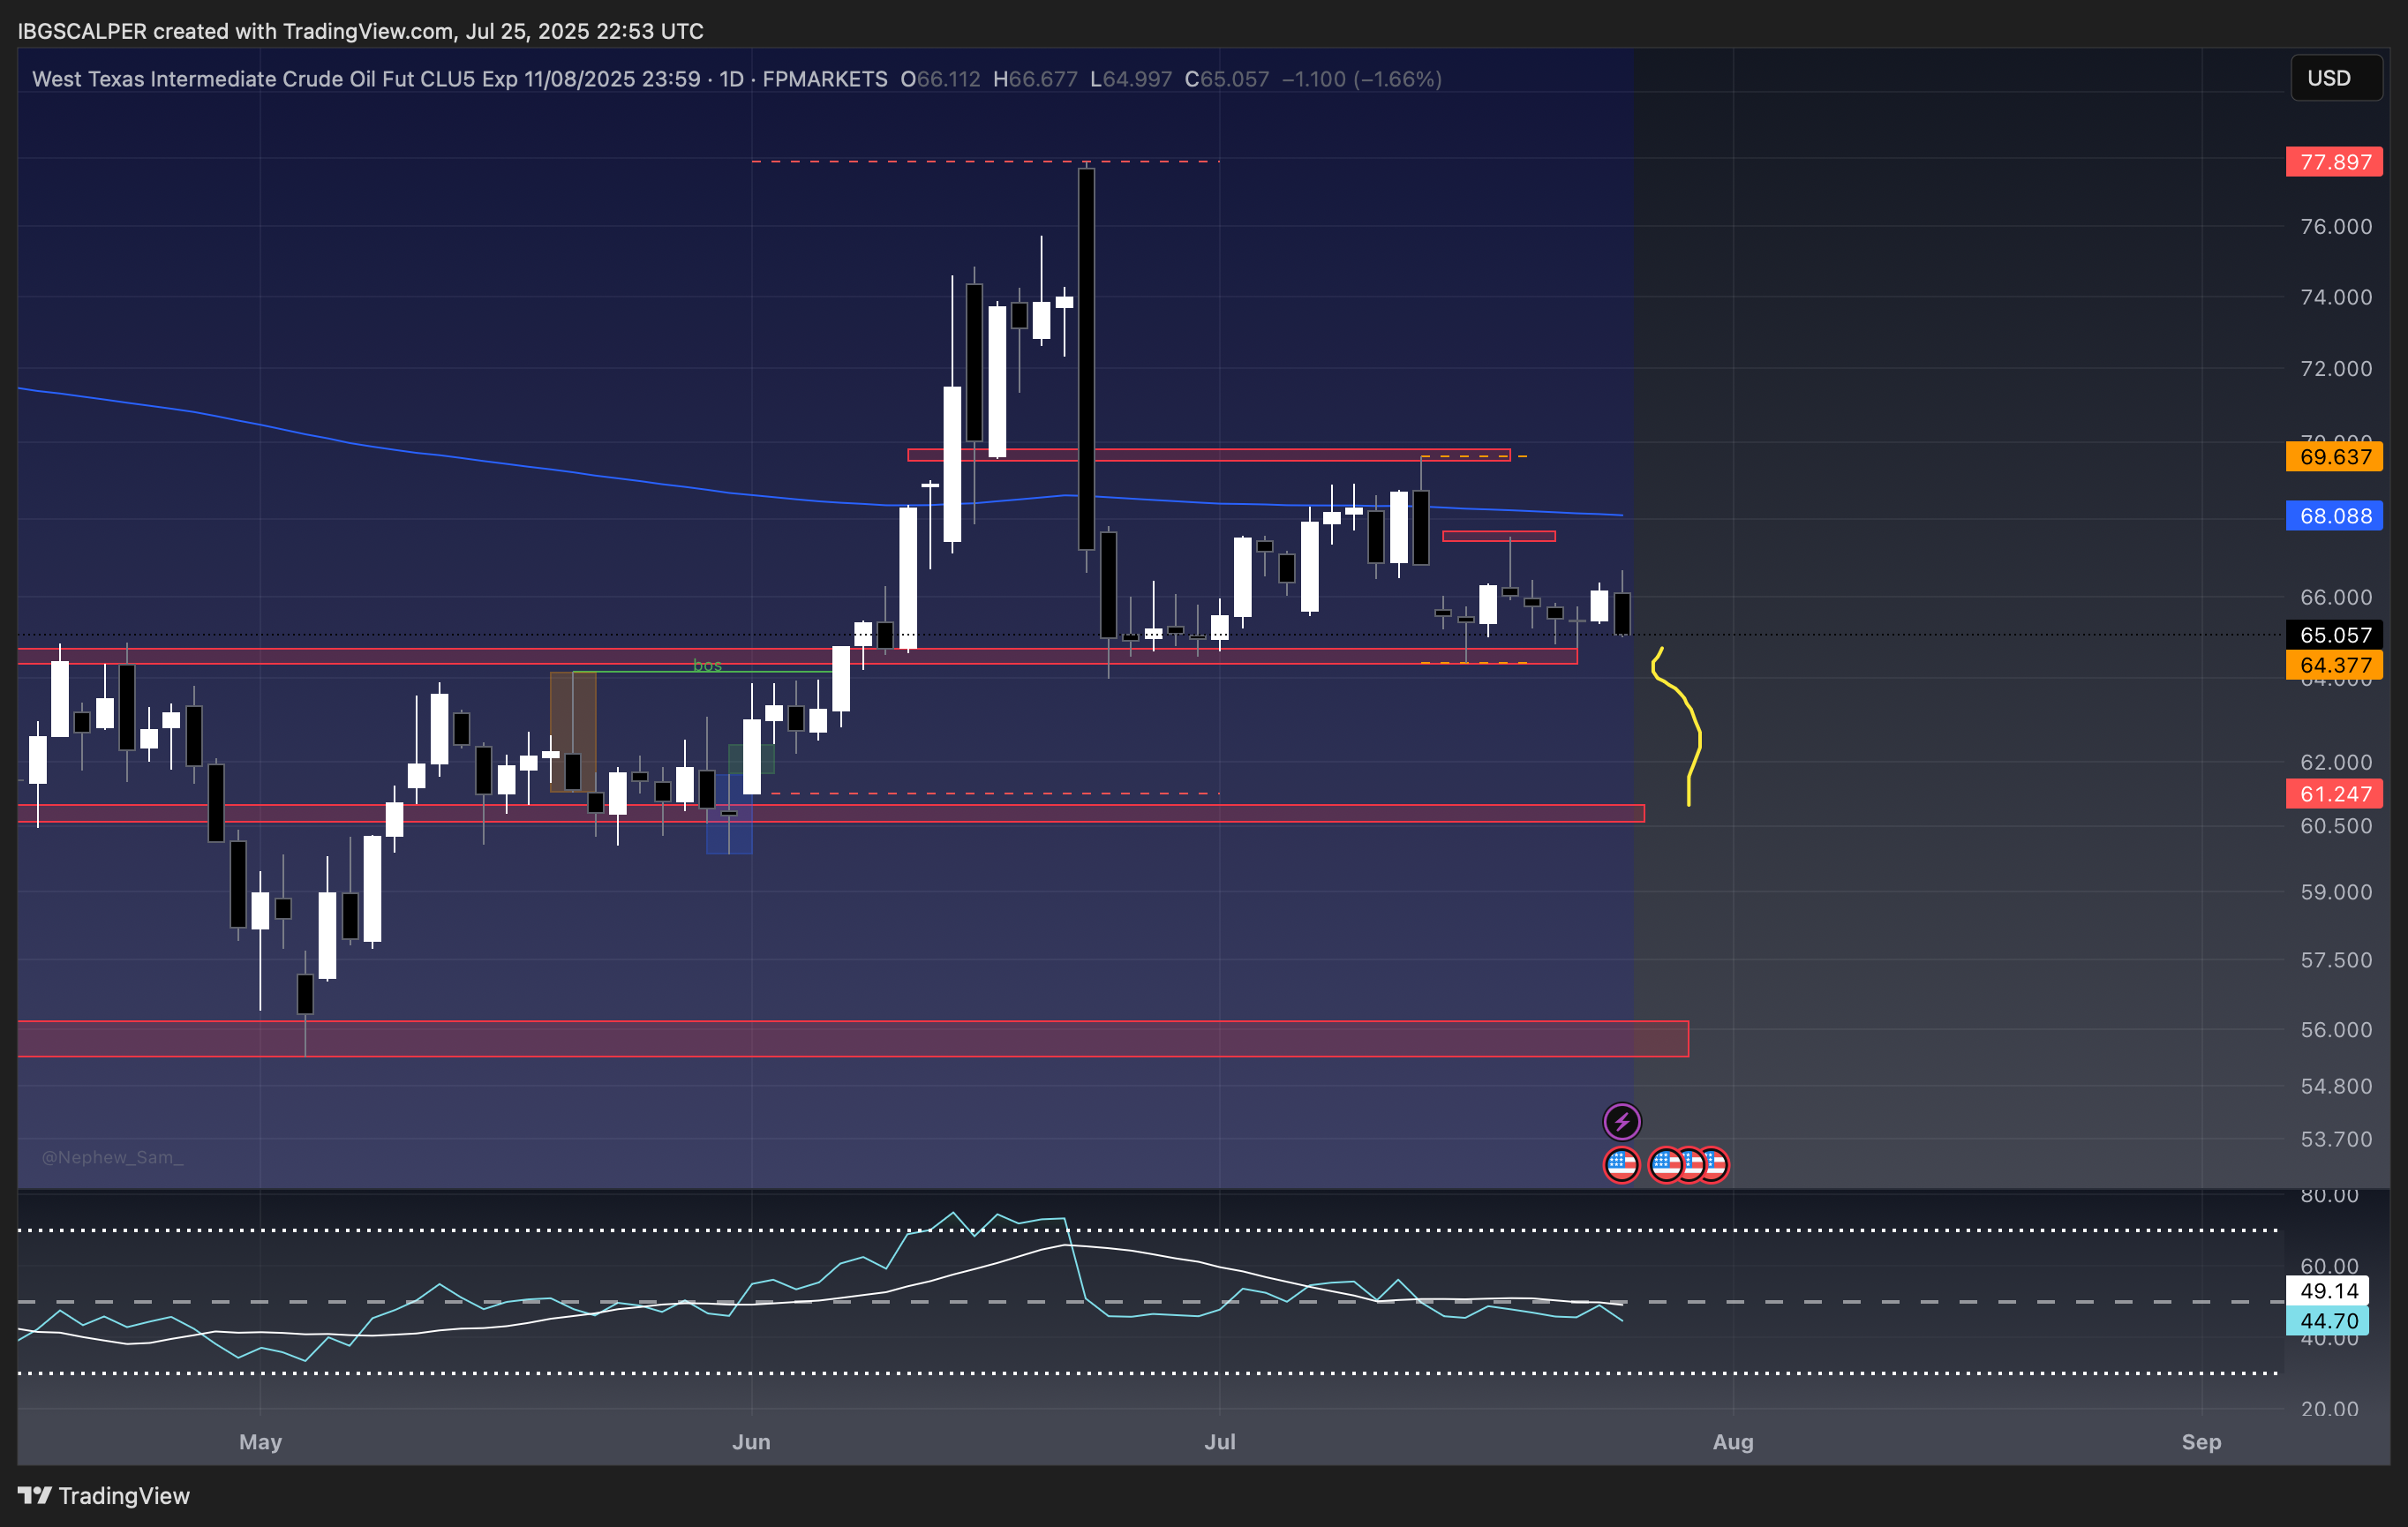
USOIL buy setup sl below the 68.853 target 1:2 atleast but can target 1:6,if youguys are agressive can buy now as well
Snapshot