W to longW have broken out of its long term trend. one can open long position.
Entry: 0.07315
Tp1 : 0.13
Tp 2: 0.18
Stoploss: 0.06330

Strong Breakout on WUSDT: Potential for Major Bullish Move WUSDT has recently completed a strong breakout from a key resistance zone, signaling a potential shift in momentum and attracting significant attention from traders. The technical setup points to a confirmed breakout with increased trading volume, which typically precedes a powerful rally. This move

Trading opportunity for WUSDTBased on technical factors there is a Buy position in :
📊 WUSDT
🔵 Buy Now or Buy Stop by 0.89
🪫Stop loss 0.0740
🔋Target 0.1240
📏 R/R 4,2
💸RISK : 1%
We hope it is profitable for you ❤️
Please support our activity with your likes👍 and comments📝

#WUSDT LONG #WUSDT
Looking good for a quick reversal from here.
Reason:
1. Holding that support area very well. Did couple successful retests of same zone.
2.Retested bullish Trend line breakout.
WUSD/T (Wormhole Token/Tether) - 4H Timeframe: Long itKey Observations:
Price at a Critical Support Zone:
The current price is at 0.08320, sitting squarely within a well-defined "Buy Zone" between 0.08320 and 0.09263 (blue shaded area). This zone has acted as a strong support in the past, as evidenced by the price bouncing off this level multiple times

WusdtWusdt
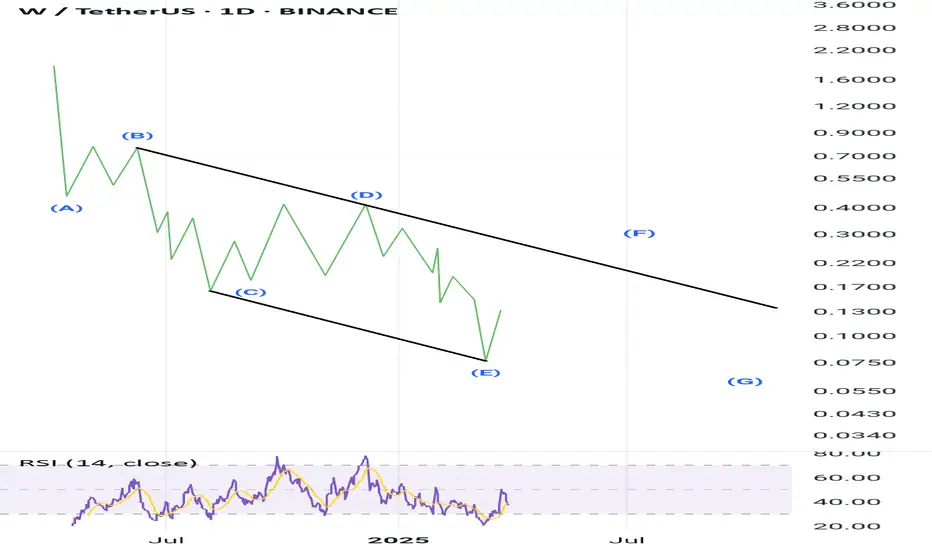
Neowave
This analysis has been drawn using monthly cache data.
It will either form a Diametric or a Symmetric pattern.
In both cases, we can see that an upward move will occur, and a high trading volume over several days could be the trigger for this movement.
W ( SPOT -INVEST)BINANCE:WUSDT
WLD / USDT
(4H + 1D) time frames
analysis tools
____________
SMC
FVG
Trend lines
Fibonacci
Support & resistance
MACD Cross
EMA Cross
______________________________________________________________
Golden Advices.
********************
* Please calculate your losses before any entry

w coin another pump loadingW coin has done CHoCH on major structure with a bullish and big candle. According fib levels, its in buy zone and will pump again. Buy some in spot.

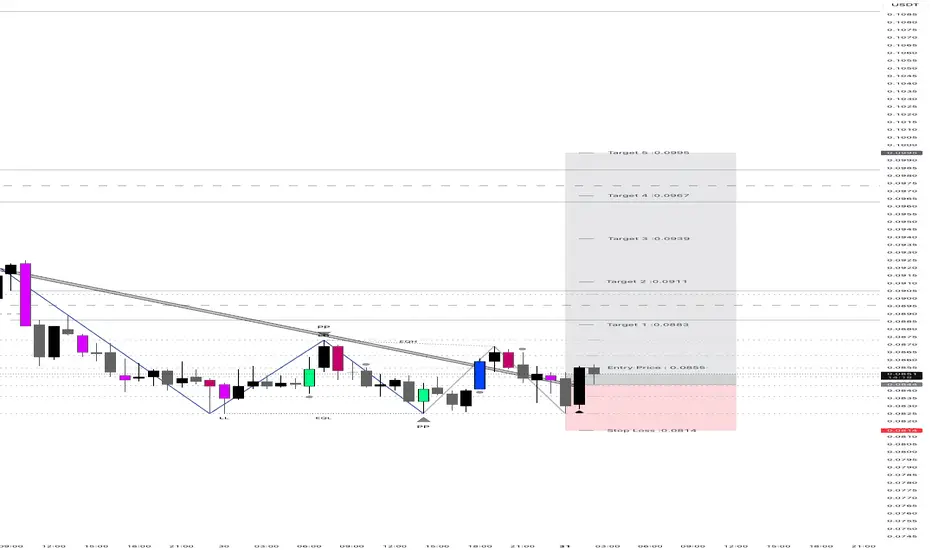
WUSDT – Major Resistance Zones Ahead! “This is where the battle happens—will resistance hold, or are we about to see an explosive breakout?”
🔥 Key Insights:
✅ Red Lines = Strong Resistance – These levels have proven themselves before, and now they are back in play.
✅ Risking 1R on Both – Calculated risk, sniper execution. No random en

Wormhole (W): Is the Correction Over? Targeting $0.1700 and $0.2Greetings, fellow traders!
Following a significant rally that reached the $0.1300 resistance zone, Wormhole (W) is currently undergoing a corrective phase. This retracement is finding support near the key 0.50 and 0.618 Fibonacci levels, a common area for price consolidation before a potential tren

See all ideas
Summarizing what the indicators are suggesting.
Oscillators
Neutral
SellBuy
Strong sellStrong buy
Strong sellSellNeutralBuyStrong buy
Oscillators
Neutral
SellBuy
Strong sellStrong buy
Strong sellSellNeutralBuyStrong buy
Summary
Neutral
SellBuy
Strong sellStrong buy
Strong sellSellNeutralBuyStrong buy
Summary
Neutral
SellBuy
Strong sellStrong buy
Strong sellSellNeutralBuyStrong buy
Summary
Neutral
SellBuy
Strong sellStrong buy
Strong sellSellNeutralBuyStrong buy
Moving Averages
Neutral
SellBuy
Strong sellStrong buy
Strong sellSellNeutralBuyStrong buy
Moving Averages
Neutral
SellBuy
Strong sellStrong buy
Strong sellSellNeutralBuyStrong buy
Displays a symbol's price movements over previous years to identify recurring trends.