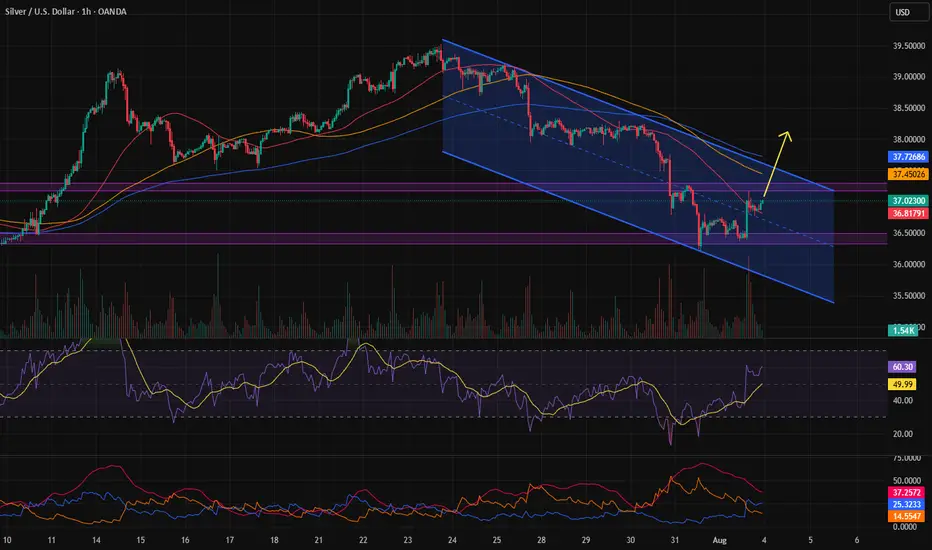
XAGUSD: Correction May Be Over – Watch $37.60 BreakoutAfter reaching a local top around the $39.50 zone on July 24, Silver entered a normal corrective phase, with price dropping over 3,000 pips from top to bottom — roughly an 8% retracement.
📉 Despite the strength of the drop, the structure was clearly corrective, not impulsive. Even more, the move formed a descending broadening wedge, a pattern that often hints at a potential reversal.
📈 Yesterday, we saw a clean breakout above the wedge’s upper boundary — which may signal the end of the correction.
At the time of writing, price is trading at $37.45, right under a key horizontal resistance zone between $37.50 and $37.60.
A breakout above this level would confirm the low and likely initiate a new move toward the $38.70 resistance.
________________________________________
🎯 Summary & Plan:
• A break above $37.60 = bullish confirmation
• Target: $38.70 (first resistance)
• Invalidation: If price drops below $37, bulls lose control
As long as price holds above the $37 zone, the technical outlook remains constructive, and traders could consider setups aligned with the upside scenario. 🚀
Disclosure: I am part of TradeNation's Influencer program and receive a monthly fee for using their TradingView charts in my analyses and educational articles.
XAGUSD trade ideas

XAGUSD H4 | Bullish bounce off 38.2% Fibonacci support?Based on the H4 chart analysis, we could see the price fall to the buy entry which is a pullback support that aligns with the 38.2% Fibonacci retracement and could bounce from this level to the upside.
Buy entry is at 37.67, which is a pullback support that lines up with the 38.2% Fibonacci retracement.
Stop loss is at 36.89, which is a pullback support.
Take profit is at 39.39, which is a swing high resistance.
High Risk Investment Warning
Trading Forex/CFDs on margin carries a high level of risk and may not be suitable for all investors. Leverage can work against you.
Stratos Markets Limited (tradu.com ):
CFDs are complex instruments and come with a high risk of losing money rapidly due to leverage. 65% of retail investor accounts lose money when trading CFDs with this provider. You should consider whether you understand how CFDs work and whether you can afford to take the high risk of losing your money.
Stratos Europe Ltd (tradu.com ):
CFDs are complex instruments and come with a high risk of losing money rapidly due to leverage. 66% of retail investor accounts lose money when trading CFDs with this provider. You should consider whether you understand how CFDs work and whether you can afford to take the high risk of losing your money.
Stratos Global LLC (tradu.com ):
Losses can exceed deposits.
Please be advised that the information presented on TradingView is provided to Tradu (‘Company’, ‘we’) by a third-party provider (‘TFA Global Pte Ltd’). Please be reminded that you are solely responsible for the trading decisions on your account. There is a very high degree of risk involved in trading. Any information and/or content is intended entirely for research, educational and informational purposes only and does not constitute investment or consultation advice or investment strategy. The information is not tailored to the investment needs of any specific person and therefore does not involve a consideration of any of the investment objectives, financial situation or needs of any viewer that may receive it. Kindly also note that past performance is not a reliable indicator of future results. Actual results may differ materially from those anticipated in forward-looking or past performance statements. We assume no liability as to the accuracy or completeness of any of the information and/or content provided herein and the Company cannot be held responsible for any omission, mistake nor for any loss or damage including without limitation to any loss of profit which may arise from reliance on any information supplied by TFA Global Pte Ltd.
The speaker(s) is neither an employee, agent nor representative of Tradu and is therefore acting independently. The opinions given are their own, constitute general market commentary, and do not constitute the opinion or advice of Tradu or any form of personal or investment advice. Tradu neither endorses nor guarantees offerings of third-party speakers, nor is Tradu responsible for the content, veracity or opinions of third-party speakers, presenters or participants.

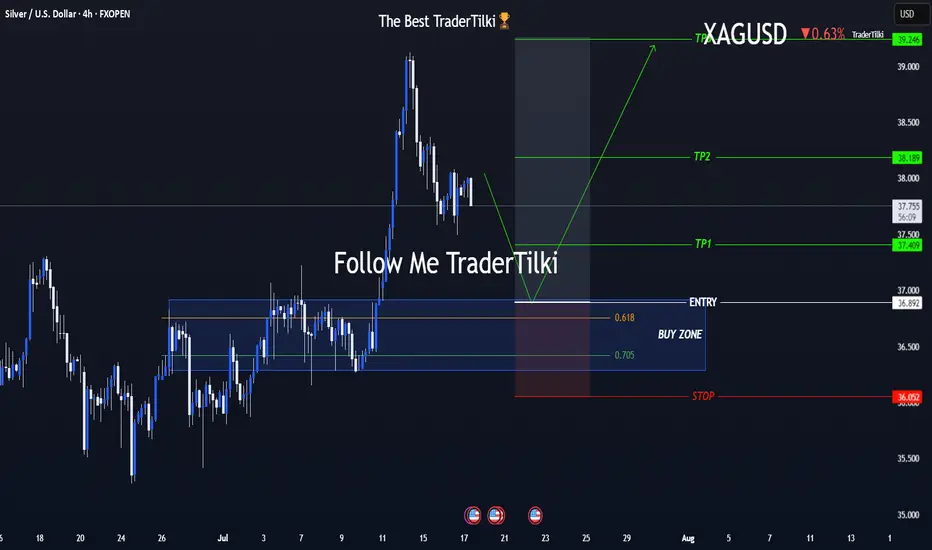
One Shot, Clear Strategy – Silver Buy Zone in SightHey everyone 👋
📌 BUY LIMIT ORDER / XAGUSD-SILVER Key Levels
🟢 Entry: 36,892
🎯 Target 1: 37,409
🎯 Target 2: 38,189
🎯 Target 3: 39,246
🔴 Stop: 36,052
📈 Risk/Reward Ratio: 2,79
I double-checked the levels and put together a clean, focused analysis just for you. Every single like seriously boosts my motivation to keep sharing 📈 Your support means the world to me! Huge thanks to everyone who likes and backs this work 💙 Our goals are crystal clear, our strategy is solid. Let’s keep moving forward with confidence and smart execution!
XAGUSD SWING: SHORT-TERM BEARISH OPPORTUNITY Hi there,
For Silver, I am long term bullish but we have a set up for some short opportunity.
As annotated, we are primed to see lower prices... between 34 - 34.5
If this happens, I'd resume looking for massive long opportunities.
You might want to keep this on your radar.
Cheers,
Jabari
SILVER (XAGUSD): Bullish Reversal from Support Silver reacted significantly to the highlighted intraday resistance level during Friday's New York session.
I noticed a small double bottom pattern and the emergence of a bullish engulfing candle. I anticipate a pullback to the 37.72 level.

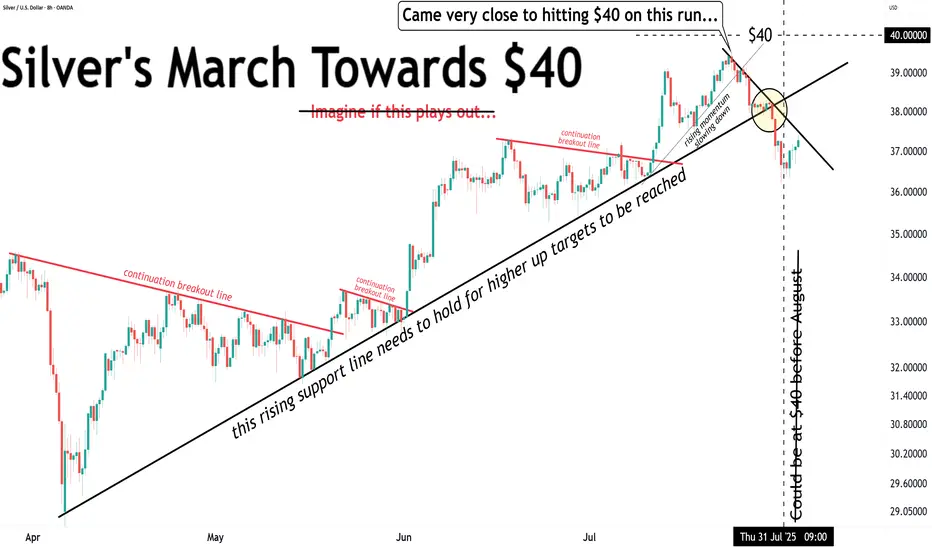
Silver came very close to the $40 target ($39.52).Silver came very close to the $40 target ($39.52).
Currently in correction mode.
Nothing to see here... for now.
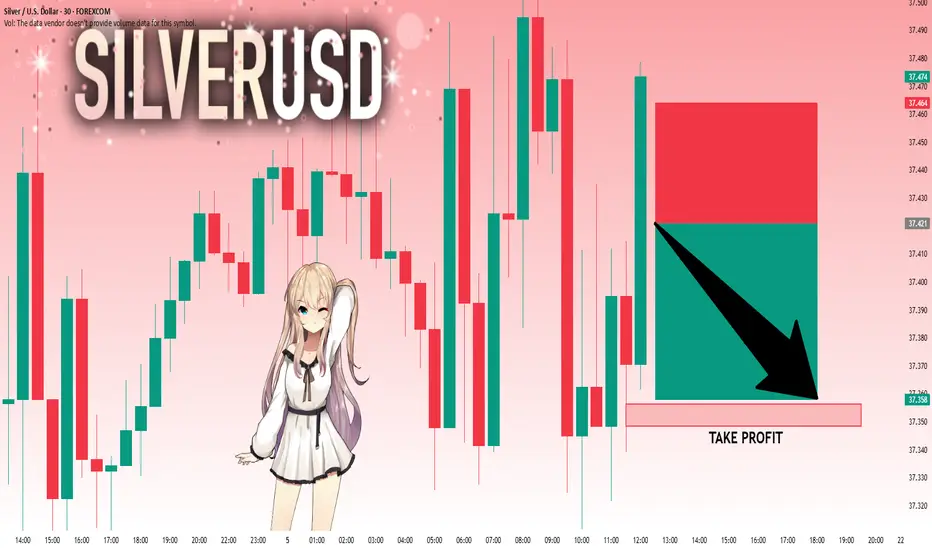
SILVER: The Market Is Looking Down! Short!
My dear friends,
Today we will analyse SILVER together☺️
The recent price action suggests a shift in mid-term momentum. A break below the current local range around 37.421 will confirm the new direction downwards with the target being the next key level of 37.356.and a reconvened placement of a stop-loss beyond the range.
❤️Sending you lots of Love and Hugs❤️
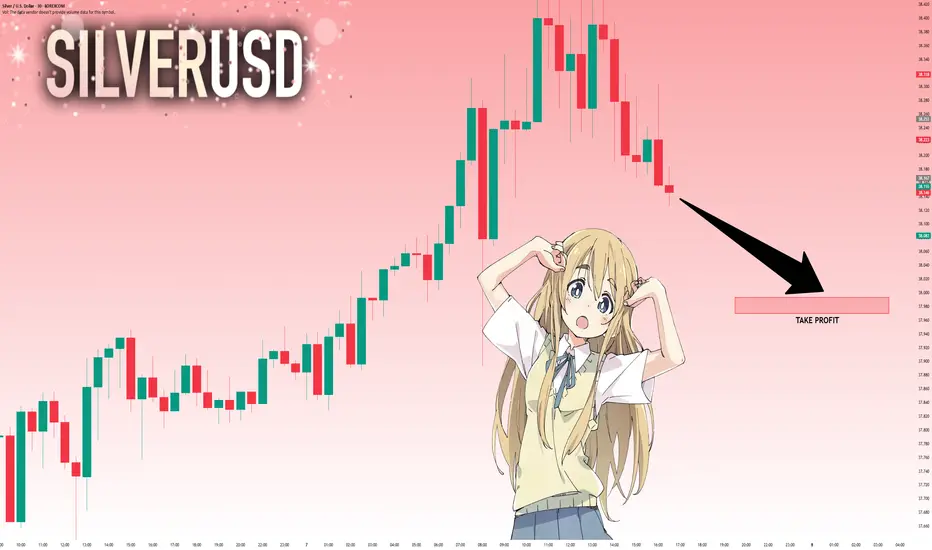
SILVER: Strong Bearish Sentiment! Short!
My dear friends,
Today we will analyse SILVER together☺️
The recent price action suggests a shift in mid-term momentum. A break below the current local range around 38.167 will confirm the new direction downwards with the target being the next key level of 37.993.and a reconvened placement of a stop-loss beyond the range.
❤️Sending you lots of Love and Hugs❤️
SILVER WILL GO UP|LONG|
✅SILVER is going up
Now and the pair made a bullish
Breakout of the key horizontal
Level of 37.73$ and the breakout
Is confirmed so we are bullish
Biased and we will be expecting
A further bullish move up
LONG🚀
✅Like and subscribe to never miss a new idea!✅

One more move up and then we should sell for now....This pb has allowed the shorts to cash in...we are at signficant support (middle of prior funnel) and the bottom of the channel...in my opinion, we resume the move up...but I think $42-$44 zone is the likely pivot pt for a significan move back down...back to mid to low $30's...This current pb is will shake off the weak hands! However, let this be a lesson...avoid leverage or you may pay dearly....
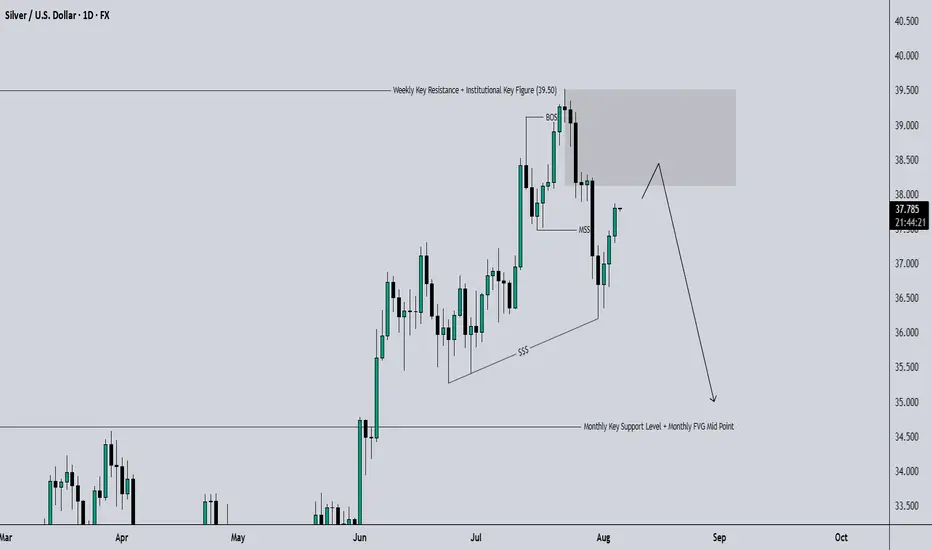
XAGUSD (SILVER): Sells For Now, Down To 35.80In this Weekly Market Forecast, we will analyze the XAGUSD (SILVER) for the week of Aug 4-8th.
Silver was strong, sweeping a 2012 high. Then sellers stepped in for the next couple of weeks, printing bearish candles. Friday say a late rally on weak job numbers, weakening the USD and allowing Silver and other asset pairs to outperform it in the short term.
Due to the bearish close of last week's candle, the indication is the rally was a market reaction, and that the slide will continue into this week.
Until there is a bullish break of market structure, buys are not a great idea. Stick with sells, down to the Monthly +FVG.
Enjoy!
May profits be upon you.
Leave any questions or comments in the comment section.
I appreciate any feedback from my viewers!
Like and/or subscribe if you want more accurate analysis.
Thank you so much!
Disclaimer:
I do not provide personal investment advice and I am not a qualified licensed investment advisor.
All information found here, including any ideas, opinions, views, predictions, forecasts, commentaries, suggestions, expressed or implied herein, are for informational, entertainment or educational purposes only and should not be construed as personal investment advice. While the information provided is believed to be accurate, it may include errors or inaccuracies.
I will not and cannot be held liable for any actions you take as a result of anything you read here.
Conduct your own due diligence, or consult a licensed financial advisor or broker before making any and all investment decisions. Any investments, trades, speculations, or decisions made on the basis of any information found on this channel, expressed or implied herein, are committed at your own risk, financial or otherwise.

SILVER (XAGUSD): More Growth Ahead
It looks like Silver is going to continue growing next week,
following a strong bullish reaction to a key daily horizontal support.
The next strong resistance is 3748.
It will be the next goal for the buyers.
❤️Please, support my work with like, thank you!❤️
I am part of Trade Nation's Influencer program and receive a monthly fee for using their TradingView charts in my analysis.

"THE SILVER JOB" // $XAG/USD ROBBERY PLAN UNLOCKED🚨SILVER HEIST LOADING... BULLS ON THE MOVE! 💥 XAG/USD THIEF PLAN 💰🐂
Asset: XAG/USD “The Silver”
📈 Plan: Bullish Thief Raid
🎯 Target Zone: 40.000 – “Police Barricade Resistance” + Overbought Hotspot
🛑 Stop Loss: 37.500 – Vault Alarm Level
💼 Entry: “Anywhere, Anytime” – The thief is layering his limit orders like a true market infiltrator!
💸💣THE THIEF'S MASTER ROBBERY PLAN👇
🧠 Mindset:
This isn’t just a trade — it’s a full-scale Silver Heist 🐱👤💰
The Thief has eyes on the big vault near 40.000, and we’re sneaking in using multiple limit orders. No fixed entry — just strategic placements near pullbacks or recent swings.
🔒 Stop Loss: Hidden beneath recent traps (37.500). If the alarm goes off — we vanish.
🚔 Target: 40.000 – Major resistance where the market police are camping! It's also an overbought zone, so get in, loot, and exit clean.
📉 SITUATION REPORT:
📊 Market Mood: Bullish
🔥 Momentum Shift: Strong breakout signs
⚠️ Danger Zone: High volatility approaching — stay alert!
💥 Macro + Technical Confluence: Bulls gathering force – volume rising, trend intact.
👇 TIPS FROM THE THIEF 👇
🧲 Scalpers & Swingers:
Stick to the Long side only!
Use a Trailing SL like a grappling hook — protect profits as you climb.
⚔️ If you’re undercapitalized, layer wisely and avoid overexposure!
📰 News Threat?
Don’t raid during sirens (major releases). Wait it out, then re-enter when it’s calm again.
🧠 Psych Game:
Avoid revenge trades. Set your plan, rob smart, rob clean 🧤🔍
🚀 Ready to Ride with the Robbery Crew?
💖 Boost this Idea to support the Thief Guild!
🎯 Stay tuned for more Heist Plans!
🤑 Join the raid. Rob the market. Run with profits. 🎒💨

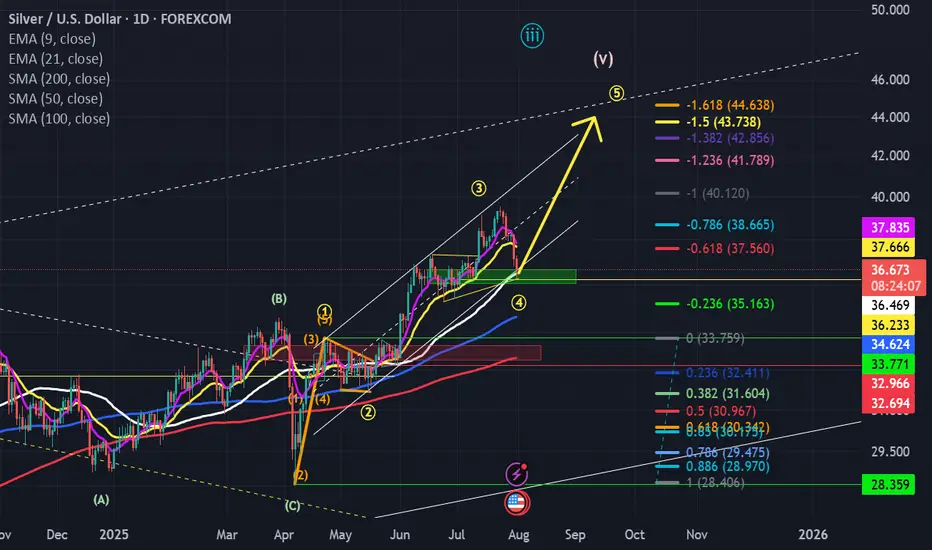
Elliott Wave Analysis: Silver (XAGUSD) Targets $40.3 in Wave 5 The ongoing cycle in Silver (XAGUSD), initiated from the April 7 low, continues to unfold as an impulsive Elliott Wave structure. Wave (3) of this impulse concluded at 39.52, as illustrated on the 1-hour chart. The subsequent pullback in wave (4) terminated at 36.17, exhibiting a zigzag internal structure. From the peak of wave (3), wave ((i)) declined to 38.67, followed by a rally in wave ((ii)) to 39.19. Wave ((iii)) then dropped to 37.93, with wave ((iv)) rebounding to 38.33. The final leg, wave ((v)), completed at 37.88, finalizing wave A in a higher degree. Wave B then rallied to 38.28.
Wave C descended in a five-wave impulse pattern. From wave B, wave ((i)) fell to 37.98, and wave ((ii)) climbed to 38.24. Wave ((iii)) dropped to 36.76, followed by wave ((iv)) rising to 37.268. The final wave ((v)) concluded at 36.17, completing wave C of (4). Silver has since begun advancing in wave (5). However, it must surpass the wave (3) high of 39.52 to eliminate the possibility of a double correction. As long as the 36.17 pivot holds, expect upward momentum. The potential target for wave (5) lies at the 123.6% inverse retracement of wave (4), projecting to 40.3. This analysis supports a bullish near-term outlook, provided the key support level remains intact.

Trend reversal?If the support in the \$37–\$38 range is confirmed, a long position can be taken targeting a new all-time high (ATH).
Silver XAGUSD is forming a bullish IB pattern The market of silver XAGUSD is in Up trend
it formed a correction wave
near the previous levels of multi bullish price action between 36 and 36,30
this market is forming an IB pattern
buy stop order must be place at the HH of the MB at the price 37.35
SL 36
TP 39

Silver (XAG/USD):Silver extended its bullish move, breaking above the $38.00 resistance zone, and is currently trading near $38.34.
🔹 Bullish Scenario (1):
If momentum continues and price holds above $38.30, the next potential targets are $38.80, followed by $39.00.
🔹 Bearish Scenario (2):
However, a rejection followed by a break below $37.95 and $37.62 may trigger a deeper pullback toward the demand zone $37.30 .
⚠️ Disclaimer:
This is not financial advice. Please monitor price action and market conditions before making any investment decisions.

HI GUYShere i have a sneak peak of how i think silver has to play out.
i expect sells now, as we form the daily double bottom.
what do u think

Silver Wave Analysis – 4 August 2025- Silver reversed from the support zone
- Likely to rise to the resistance level 39.45
Silver recently reversed from the support zone between the support level 36.20 (which also stopped wave ii at the start of July), lower daily Bollinger Band and the 38.2% Fibonacci correction of the upward impulse from May.
The upward reversal from this support zone created the daily Japanese candlesticks reversal pattern, Piercing Line – which marked the end of the earlier correction 2.
Given the clear daily uptrend, Silver can be expected to rise to the next resistance level at 39.45 (top of earlier impulse wave 1 from July).

XAGUSD--SHORT--02-08.25--looking at multime-frame (M,W), short term great short opportunity
--entry around 37.52854 and 37.32500, TP is 35.267

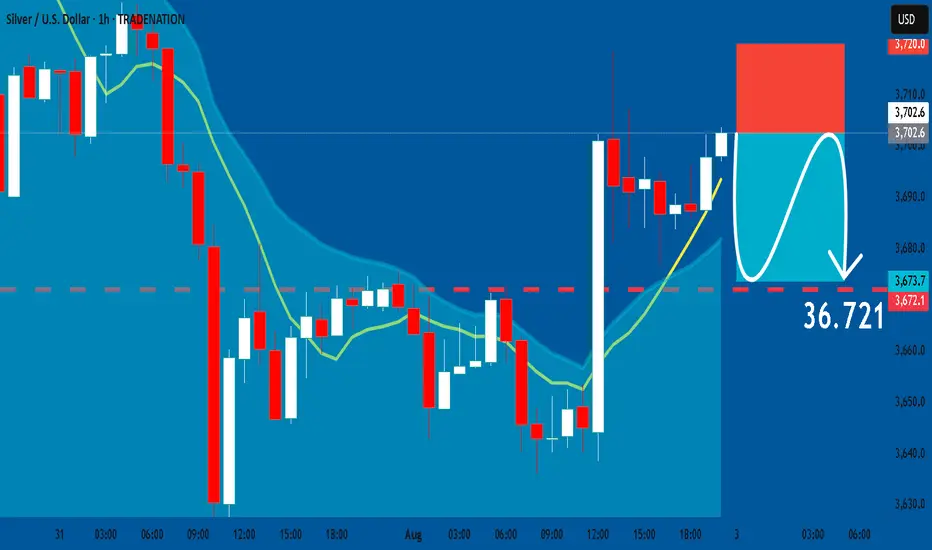
SILVER: Short Trade with Entry/SL/TP
SILVER
- Classic bearish formation
- Our team expects pullback
SUGGESTED TRADE:
Swing Trade
Short SILVER
Entry - 37.026
Sl - 37.200
Tp - 36.721
Our Risk - 1%
Start protection of your profits from lower levels
Disclosure: I am part of Trade Nation's Influencer program and receive a monthly fee for using their TradingView charts in my analysis.
❤️ Please, support our work with like & comment! ❤️
XAGUSDB wave looks cooked — rejection off the 0.618 zone. As long as 38.25 holds, C wave down to 35.80 → 34.50’s is in play. Break above = plan invalid.
#XAGUSD #Silver #WaveAnalysis

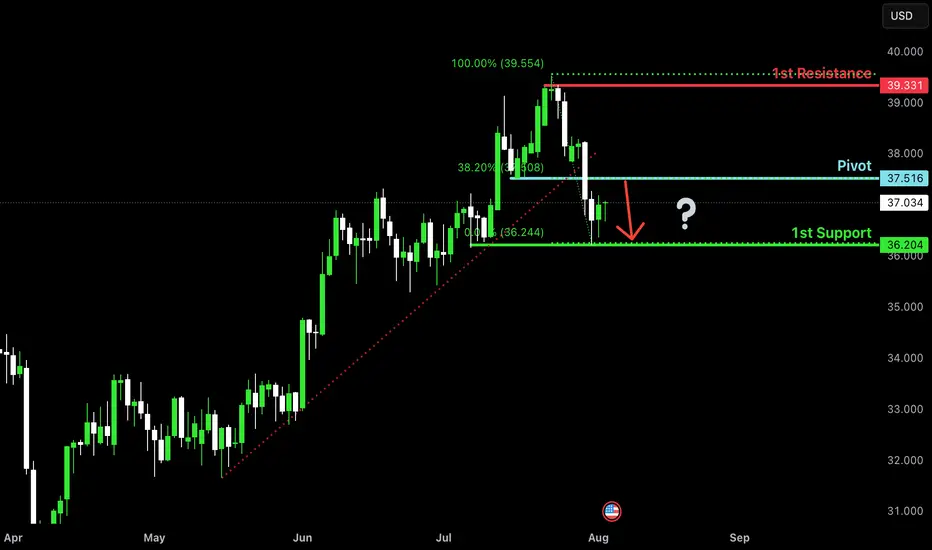
Bearish reversal for the Silver?The price is rising towards the pivot and could reverse to the pullback support.
Pivot: 37.51
1st Support: 36.20
1st Resistance: 39.33
Risk Warning:
Trading Forex and CFDs carries a high level of risk to your capital and you should only trade with money you can afford to lose. Trading Forex and CFDs may not be suitable for all investors, so please ensure that you fully understand the risks involved and seek independent advice if necessary.
Disclaimer:
The above opinions given constitute general market commentary, and do not constitute the opinion or advice of IC Markets or any form of personal or investment advice.
Any opinions, news, research, analyses, prices, other information, or links to third-party sites contained on this website are provided on an "as-is" basis, are intended only to be informative, is not an advice nor a recommendation, nor research, or a record of our trading prices, or an offer of, or solicitation for a transaction in any financial instrument and thus should not be treated as such. The information provided does not involve any specific investment objectives, financial situation and needs of any specific person who may receive it. Please be aware, that past performance is not a reliable indicator of future performance and/or results. Past Performance or Forward-looking scenarios based upon the reasonable beliefs of the third-party provider are not a guarantee of future performance. Actual results may differ materially from those anticipated in forward-looking or past performance statements. IC Markets makes no representation or warranty and assumes no liability as to the accuracy or completeness of the information provided, nor any loss arising from any investment based on a recommendation, forecast or any information supplied by any third-party.