XAG/USD..4H chart pattern..XAG/USD short (sell) trade setup:
🔻 Trade Setup (Short XAG/USD)
Sell Entry: 34.500
Resistance: 34.800 (key level – invalidation zone)
Targets:
Target 1: 32.800 (+1.70 points)
Target 2: 32.000 (+2.50 points)
📊 Risk and Reward Estimation
Let’s assume your stop loss is just above resistance, e.g., 34.900 (a 0.400 risk).
Target Reward (Points) Risk R:R Ratio
32.800 1.70 0.40 4.25
32.000 2.50 0.40 6.25
🧠 Key Considerations
✅ Resistance Confirmation: 34.800 must be holding strong as resistance; look for rejection wicks, low volume up-moves, or bearish divergence.
🔻 Trend Bias: Favorable if silver is showing signs of a local top or weakness in commodities.
🔄 Position Management:
Consider trailing stop once price breaks below 33.800.
Partial close at 32.800 to secure gains.
⚠️ Risk Note
Silver (XAGUSD) can move sharply due to news, especially related to USD, interest rates, or inflation data. Always use a stop loss.
XAGUSD trade ideas

SILVER TO 40$ HELLO TRADERS
As i can see Silver is still trading inside a upward channel and did not created any big moves like Gold and its under value i am expected a boost from this zone to 40 $ incoming days if it did notr break the channel friends its just a trade idea share ur thoughts with us we love ur comments and support Stay Tuned for more updates

Precision Pays Off: Learn, Trade, Win — Results Speak Louder🎯 Analysis On Point Again!
My recent analysis played out exactly as expected. 📉📈 Those who followed my instructions not only gained profits but also improved their trading knowledge and decision-making skills.
Success in trading isn't just about luck — it's about learning to read the market with precision and discipline. 📚💡
To those who’ve been riding along — congratulations on your gains! 🥂 And to the new followers, stay tuned. The next winning setups are just around the corner.
Let’s grow, learn, and earn — together. 🚀💸

Small Clues In A Big Breakout PatternSilver has been consolidating as of late and if there's one thing we no about contraction is that it eventually leads to expansion aka a breakout.
The issue with this particular setup is that based on location of the pattern, there's no predetermined directional bias for the breakout.
Therefor, what we're doing today is looking for small clues that the market has provided to give us any type of edge in predicting a breakout one way or another and guess what. WE FOUND SOME!
If you have any questions or comments, please leave them below!
Akil

Silver is in the Bearish trend after testing ResistanceHello Traders
In This Chart XAGUSD HOURLY Forex Forecast By FOREX PLANET
today XAGUSD analysis 👆
🟢This Chart includes_ (XAGUSD market update)
🟢What is The Next Opportunity on XAGUSD Market
🟢how to Enter to the Valid Entry With Assurance Profit
This CHART is For Trader's that Want to Improve Their Technical Analysis Skills and Their Trading By Understanding How To Analyze The Market Using Multiple Timeframes and Understanding The Bigger Picture on the Charts

Silver Price Hits Year-to-Date HighSilver Price Hits Year-to-Date High
As shown on the XAG/USD chart, silver prices rose on Monday, surpassing the previous high of the year, which was set on 28th March at around $33.50 per ounce.
Why Is Silver Rising?
A bullish driver came from statements made by the White House. According to media reports:
→ US President Donald Trump announced on Friday evening plans to double tariffs on steel and aluminium imports to 50%, starting 4th June. This intervention in the global metals market may have also impacted silver prices, given silver’s significant industrial value.
→ Trump's claims that China violated the trade agreement reached in Geneva last month further cast doubt on the prospects of a phone call between Trump and Chinese President Xi Jinping.
Technical Analysis of the XAG/USD Chart
Today’s bearish candlestick (marked with a red arrow) indicates that sellers are becoming active, willing to open short positions near the 2025 high. From a technical analysis perspective, there are signs of:
→ a bearish engulfing candlestick pattern forming;
→ a false breakout above the March high (trapping bullish traders).
However, the bulls may attempt to keep the price in the upper half of the emerging ascending channel (shown in blue), relying on support from the former resistance level at $33.67.
This article represents the opinion of the Companies operating under the FXOpen brand only. It is not to be construed as an offer, solicitation, or recommendation with respect to products and services provided by the Companies operating under the FXOpen brand, nor is it to be considered financial advice.

#336025 | XAGUSD Supply Zone 1:4XAGUSD Supply Zone Appears in H4 Time Frame Looking Price Action for Long Term Sell Risk and Reward Ratio is 1:4
After 50 pips Profit Set SL Entry Level
"DISCLAIMER" Trading & investing business is "Very Profitable" as well as risky, so any trading or investment decision should be made after Consultation with Certified & Regulated Investment Advisors, by Carefully Considering your Financial Situation.

$40 target for silver possible in next couple of months...$40 target for silver possible in next couple of months...
Imagine if this plays out...
this rising support line needs to hold for higher up targets to be reached
Could be at $40 before August

XAG/USD finds support as buyers build momentum.Silver price (XAG/USD) halts its losing streak, trading around $33.20 per troy ounce during the Asian hours on Thursday.
There is a good chance silver could retest the immediate support at the twenty-day EMA of $32.87. A push below this level could weaken the short and medium-term price momentum to the downside and put downward pressure on the grey metal around the lower boundary at $31.80.
On the upside, the XAG/USD pair could explore the region around the rectangle’s upper boundary at $33.70, aligned with the seven-week high at $33.71, reached on May 25. A break above this crucial resistance zone could cause the influx of the bullish bias and lead the silver price to approach the seven-month high of $34.60, last seen on March 28.

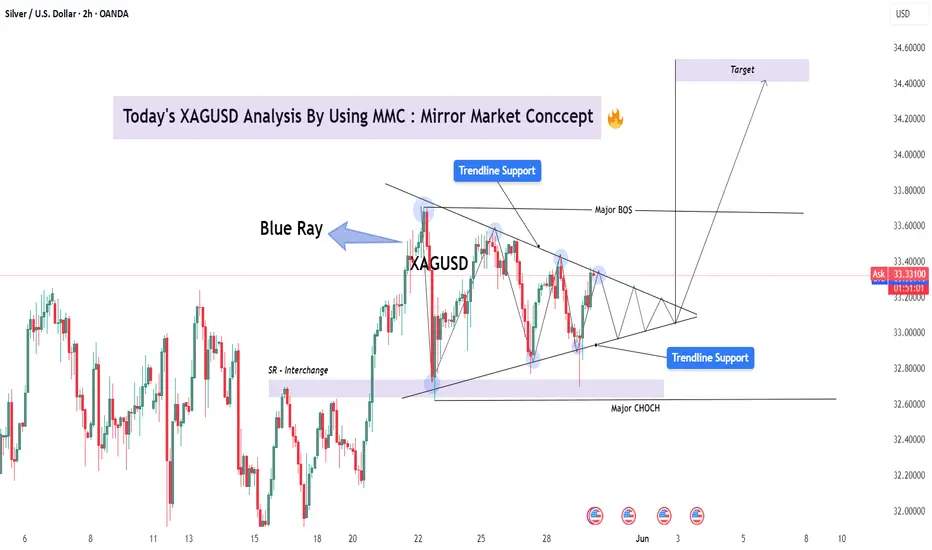
XAGUSD Analysis with MMC | Trendline + CHoCH Insight + Target🔍 Overview
This XAGUSD chart presents a classic Mirror Market Concept (MMC) pattern – a fractal, symmetrical market behavior often observed at key inflection points. The structure is currently forming a tight triangle pattern within two converging trendlines, signaling a compression phase before a significant breakout.
Mirror Market Concept relies on the idea that historical emotional market structures tend to repeat or reflect, especially in psychologically sensitive zones such as trendline tests, liquidity pools, and BOS/CHoCH areas.
📐 Technical Structure Breakdown
🔷 1. Trendline Resistance & Support (Triangle Compression)
Upper trendline connects successive lower highs, reflecting consistent seller pressure.
Lower trendline aligns with higher lows, showing bullish defense and accumulation pressure.
The result is a symmetrical triangle, often preceding explosive directional moves.
🔹 2. Blue Ray Zone
The "Blue Ray" acts as a historical liquidity pivot — a region where large wicks and rejections happened in both directions.
Price has respected this zone repeatedly, making it a likely impulse trigger area if revisited.
🔄 3. BOS (Break of Structure) and CHoCH (Change of Character)
Major BOS near the $33.60 area indicates a shift in market structure to bullish. The break above previous swing highs suggests buyers gained control temporarily.
Major CHoCH at the base of the triangle reflects where market sentiment shifted, initiating the current series of higher lows.
📍 4. SR Interchange Zone
Previous resistance around $32.80–$33.00 is now acting as support (interchange level), creating a confluence zone with the lower trendline and CHoCH point.
🎯 Forecast & Targets
✅ Bullish Scenario (Primary):
A breakout above the upper triangle trendline and confirmation above $33.60 will validate the bullish breakout setup.
Price Target: $34.40 – $34.60 (based on triangle height + measured move theory)
Expect impulsive follow-through as trapped shorts exit and fresh longs enter.
🚫 Bearish Alternative:
A breakdown below $33.00 with strong volume and bearish retest may invalidate the bullish setup.
In such case, a fall toward $32.20–32.40 is possible — completing a deeper retracement before any resumption of the upward move.
🔍 Market Psychology Behind the Pattern
This triangle represents market indecision, a "coil" where both bulls and bears are losing volatility while absorbing liquidity. The MMC concept teaches us that price often mirrors previous patterns — and the compressed energy inside triangles typically resolves in sharp momentum moves, mirroring the prior impulse.
Expect a strong breakout that "mirrors" the breakout leg from May 22 to May 23. This type of reflection-based logic is a cornerstone of MMC.
🔔 Trading Plan & Strategy
Entry: Wait for breakout and retest of the triangle boundary (ideally on 1H/2H close).
Stop Loss: Below the most recent swing low inside the triangle.
TP1: $34.10
TP2: $34.40
TP3: $34.60 (psychological level and measured move)
⚠️ Risk & News Considerations
Upcoming U.S. economic data events (highlighted on the chart) could act as catalysts. Be prepared for volatility spikes and fakeouts. Always use solid risk management.
Market next target 🔍 Original Analysis Summary:
Bullish Continuation is expected.
Price is projected to rise with a series of higher highs (yellow arrows).
Target area is marked above 34.000 USD.
---
⚠️ Disruption (Bearish/Neutral Counter-View):
1. Flat Consolidation Zone = Distribution Risk
Price has been moving sideways in a tight range (approx. 32.90–33.15), indicating indecision.
This could be a distribution phase, where smart money sells into retail bullishness.
---
2. Weak Volume Profile
Volume is relatively low and not increasing with attempted bullish moves.
A strong breakout should be backed by volume, but current price action lacks conviction.
---
3. False Breakout Trap Risk
Price is testing the upper boundary of a range.
A small push higher could be a bull trap, especially if it reverses back inside the range — a common fake-out setup.

XAGUSD Analysis – Market Mapping Concept (MMC) + Target🧭 Overview:
Today's Silver price action presents a textbook example of how MMC can guide traders through:
Identifying the smart money accumulation phase.
Anticipating breakout momentum .
Locating key reversal areas based on previous liquidity maps and structural shifts.
We are currently observing Silver in the early stages of a structural retest after a breakout from consolidation. This gives rise to two powerful scenarios: either a bullish continuation after structure confirmation or a deeper retracement if the structure fails.
🔍 Detailed Chart Explanation:
🔷 1. Volume Contraction Phase
The market spent multiple sessions forming a symmetrical wedge, visible by narrowing price movement and consistent lower highs and higher lows.
This was accompanied by declining volume, signaling accumulation/distribution by institutional players.
The wedge served as a liquidity trap, drawing in both early shorts and longs before the true direction was revealed.
✅ MMC Principle: Volume contraction often precedes major breakouts as market makers build positions quietly.
🔷 2. SR Interchange – Breakout Confirmation
Price finally broke above the upper trendline, triggering a bullish impulse and confirming SR interchange (resistance turned support).
This move was backed by a strong bullish candle, showing aggressive participation and institutional involvement.
📌 This breakout candle set the tone for a structural shift—transforming from sideways to upward momentum.
🔷 3. Rapid Expansion Toward Previous Target Zone
After the breakout, price accelerated directly into a previous high (target) zone marked in blue.
According to MMC, this zone often acts as a liquidity magnet, where late buyers enter and professional traders take profits.
A rejection wick formed right after touching this zone—classic smart money behavior, catching retail traders chasing the move.
✅ MMC Principle: Prior highs/lows are not just resistance—they're engineered targets for liquidity collection.
🔷 4. Target + Reversal Area
After the rejection, price declined back into the Target + Reversal Zone. This area aligns with MMC’s ideal structure for potential buy-side re-accumulation.
This zone is where previous volume imbalances occurred, meaning it is likely to act as support if the bullish trend is to continue.
📊 Current price is consolidating within this zone, suggesting a possible bullish continuation if structure holds.
🔷 5. Structure Mapping – The Key to MMC
The most recent price reaction highlights the importance of structure mapping: identifying areas where market logic aligns with trader behavior.
The bearish pullback into the structure zone may complete a retest, and traders are watching closely for bullish confirmation.
⚙️ Technical Summary:
Key Zone Description
Volume Contraction Signals accumulation before breakout.
SR Interchange Breakout level where resistance turned to support.
Previous Target Zone Liquidity pool, ideal for institutional exits or reversal.
Target + Reversal Zone Demand zone where the trend may resume if confirmed.
Structure Mapping Current phase; price is aligning into new bullish structure or preparing for drop.
🧭 What to Watch Next:
🔹 Scenario A – Bullish Case:
Price holds within the Target + Reversal Zone.
Confirmation via bullish engulfing candle or breakout of lower high.
Target: retest of 34.80+, then potential extension to 35.20.
🔹 Scenario B – Bearish Case:
Breakdown below structure base at 33.85–34.00.
Could lead to a deeper correction toward 33.40 or 32.80 (previous volume node).
📌 Volume + Structure = Decision Point. Next few candles are crucial for validating direction.
🛠 Strategy & Execution:
Approach: Wait for confirmation candles before entering. Avoid reacting impulsively within the structure zone.
Entry Idea:
Buy on bullish confirmation in the reversal zone.
Place stop below structure invalidation.
Target the top of the previous target zone or higher.
Risk Management: Use tight SLs below 33.85 and scale in only on confirmation.
📅 Timeframe: 1H
🔭 Sentiment: Cautiously Bullish
🎯 Technique: MMC Structure Mapping + Volume-Based Targeting
🧠 Final Thoughts:
This XAGUSD chart showcases the predictive power of MMC when applied correctly. By understanding where smart money operates, traders can improve accuracy, timing, and risk control.
📌 If you found this analysis helpful, like and follow for daily insights. Drop your thoughts in the comments—do you trade MMC-style setups?

LONG SLVER Back to take the Swing low of 4H
Start creating SMT with GOLD in 1H
And after the close 1H as a bullish respected candle, I entered
stop loss belowthe swing low of 1H
DOL is PWH and PDH

Could the Silver reverse from here?The price is reacting off the resitance level which is a pullback resitance and could drop from this level to our take profit.
Entry: 34.51
Why we like it:
There is a pullback resistance level.
Stop loss: 35.520
Why we like wit:
There is a resistance level at the 100% Fibonacci projection.
Take profit: 33.56
Why we like it:
There is a pullback support level which lines up with the 61.8% Fibonacci retracement.
Enjoying your TradingView experience? Review us!
Please be advised that the information presented on TradingView is provided to Vantage (‘Vantage Global Limited’, ‘we’) by a third-party provider (‘Everest Fortune Group’). Please be reminded that you are solely responsible for the trading decisions on your account. There is a very high degree of risk involved in trading. Any information and/or content is intended entirely for research, educational and informational purposes only and does not constitute investment or consultation advice or investment strategy. The information is not tailored to the investment needs of any specific person and therefore does not involve a consideration of any of the investment objectives, financial situation or needs of any viewer that may receive it. Kindly also note that past performance is not a reliable indicator of future results. Actual results may differ materially from those anticipated in forward-looking or past performance statements. We assume no liability as to the accuracy or completeness of any of the information and/or content provided herein and the Company cannot be held responsible for any omission, mistake nor for any loss or damage including without limitation to any loss of profit which may arise from reliance on any information supplied by Everest Fortune Group.

Silver - How long have you waited?Silver 30 year Cup & handle break out.
Is the silver squeeze finally happening?
Credit to @EdTheLorax calling it

Why Silver Must Go Down — And Why It's No Safe HavenOANDA:XAGUSD TVC:SILVER Silver is often misunderstood. Investors treat it like a hedge against uncertainty—a supposed "safe haven" asset. But in reality, silver is not a store of value. It’s an industrial metal, one that quietly fuels inflation and raises the cost of everyday life.
📈 High Silver Prices = Hidden Inflation
Silver plays a key role in the modern economy. It’s a vital component in the electronics we use, the vehicles we drive, and even the medical products we depend on.
When silver prices rise, manufacturing costs increase. That leads to higher prices for consumers. Unlike gold, which sits in vaults, silver is used up. It goes into your phone, your TV, your car, your solar panel—then it's gone. Rising silver prices ripple through the global supply chain.
⚠️ The effects:
Smartphones and laptops become more expensive.
Solar panels cost more, slowing clean energy adoption.
Medical tools and antibacterial products go up in price.
EVs become harder to produce at scale.
Inflation quietly worsens for the average person.
❌ Silver Is NOT a Safe Haven
The idea that silver is a safe-haven asset is a dangerous myth.
Unlike gold, silver is tied closely to industrial demand. When economies slow down, silver usually underperforms. It’s volatile, reactive, and far from stable. While gold often rises in a crisis, silver behaves like a commodity—not a financial refuge.
Quick facts:
Silver is more volatile than gold.
It follows manufacturing trends, not market fear.
Its price is highly speculative and sentiment-driven.
📉 Why Silver Needs to Correct
Today’s silver prices are being driven more by emotion and narrative than fundamentals. Industrial demand is steady—not surging. Yet prices are inflated as if silver is scarce or irreplaceable. A correction in silver would:
Lower production costs for key industries
Ease global inflation pressure
Help consumers avoid price hikes on essential goods
Reduce over-speculation and volatility in the metals market
📋 Real-Life Items That Contain Silver
Understanding silver’s true role means looking at the real-world items that use it every day:
🔌 Electronics:
Smartphones (iPhones, Androids)
Laptops, tablets, TVs
Game consoles, remotes
Smartwatches, fitness trackers
🏠 Home:
Refrigerators, ovens, washers, dryers
LED light bulbs
Smart home devices (Alexa, Nest)
Air conditioners, thermostats
🚗 Vehicles:
Electric vehicles and battery systems
Infotainment systems
Defoggers, sensors, GPS units
⚡ Energy:
Solar panels (photovoltaic cells)
Electrical wiring, circuit breakers, fuses
🧬 Healthcare:
Wound dressings, surgical tools
Dental fillings, medical tubing
Antibacterial creams, hospital gear
👚 Clothing:
Antimicrobial athletic wear
Silver-infused socks, uniforms
🔄 Other:
Water purifiers
Air purifiers
Jewelry and coins
Musical instruments
Photography (traditional film)
🧠 Final Thoughts
Silver is not a safe haven—it’s a cost driver. Every dollar it rises adds pressure to the real economy. If you're serious about inflation, energy access, and technological progress, you should hope silver goes down, not up.
A lower silver price doesn’t hurt progress—it fuels it.

SILVER Will Go Up! Buy!
Take a look at our analysis for SILVER.
Time Frame: 10h
Current Trend: Bullish
Sentiment: Oversold (based on 7-period RSI)
Forecast: Bullish
The market is testing a major horizontal structure 3,324.9.
Taking into consideration the structure & trend analysis, I believe that the market will reach 3,432.4 level soon.
P.S
The term oversold refers to a condition where an asset has traded lower in price and has the potential for a price bounce.
Overbought refers to market scenarios where the instrument is traded considerably higher than its fair value. Overvaluation is caused by market sentiments when there is positive news.
Disclosure: I am part of Trade Nation's Influencer program and receive a monthly fee for using their TradingView charts in my analysis.
Like and subscribe and comment my ideas if you enjoy them!

SILVER (XAGUSD): Bullish Momentum Continues Silver (XAGUSD) has been showing strong resilience and upward momentum, reinforcing a generally bullish outlook for the near to medium term. Despite recent minor fluctuations, the underlying fundamentals and technical indicators suggest continued potential for price appreciation.
Technical Observations:
Consolidation & Breakout Potential: Silver has been consolidating, forming a base that could lead to a significant breakout.
Support Levels : Monthly Key support around the $28.00 - $29.00 zone has proven robust, suggesting strong buying interest on dips.
One-Month Chart Perspective: On a one-month chart, you would typically observe the broader trend and significant long-term support/resistance zones. Given the bullish outlook, the one-month chart would likely show a series of higher lows and potentially higher highs, indicating sustained upward momentum. Look for strong monthly closing candles above key psychological levels, which would reinforce the bullish sentiment and suggest continued strength into the next month. Any pullbacks on this timeframe would ideally find support at previous resistance levels, which then act as new support.
Key Price Targets and Predictions (as of late May/early June 2025):
Based on various analyst forecasts and market models, here are some notable price targets for silver:
Short-Term (Q2 2025): Expectation around $33.79 - $34.00 per troy ounce.
Mid-Term (Next 12 months / End of 2025):
Analysts generally forecast targets ranging from $36.00 to $40.00 per ounce.
Some more optimistic predictions reach towards $48.00 - $50.00 per ounce.
Longer-Term (2026-2030): Some projections see silver potentially reaching $75.00 - $80.00 per ounce.
Driving Factors:
Industrial Demand: The increasing adoption of green technologies (solar panels, EVs) continues to drive significant industrial demand for silver.
Safe-Haven Appeal: Ongoing global economic uncertainties and geopolitical tensions enhance silver's role as a safe-haven asset.
Supply Deficits: Persistent supply shortfalls in the silver market are expected to provide upward price pressure.
Monetary Policy: Potential interest rate cuts could make non-yielding assets like silver more attractive.
Strategy:
Maintain a bullish bias while closely monitoring key support and resistance levels. A decisive break above current resistance could confirm further upside.
Disclaimer: This is not financial advice. Trading involves risk, and past performance is not indicative of future results. Always do your own research and consult with a financial professional before making any investment decisions.

XAG/USD H4 AnalysisWith 3 previous rejections of $32.80 over the back end of May, we saw a glimpse of a 4th at the close of play last Friday.
There is a potential for buys if you agree with this analysis and it meets your strategy rules.

The What vs. The Where - A 2nd Breakout Pattern After A Nice WinA few days ago we looked at a bullish breakout opportunity on Silver and it played out perfectly. After a lovely move to the upside, price has started to consolidate again providing us with a very similar setup.
HOWEVER, just as in the case of the first, we need to be aware that once again the WHAT doesn't necessarily align with the WHERE stopping this from being a Grade A trading opportunity.
Please leave any questions or comments below and remember to hit that LIKE button before you go!
Akil

xagusd sell tradeThe Relative Strength Index (RSI) is showing a downward trend, indicating weakening momentum. Additionally, the Moving Average Convergence Divergence (MACD) is showing a bearish crossover, further supporting the potential for a downward move

Silver on it's way to pass $40 Examining the technicals of the silver chart, the outlook for 2025 suggests that the silver price will likely surpass $40 within a few weeks and remain between $40 and $42 at the end of the year.

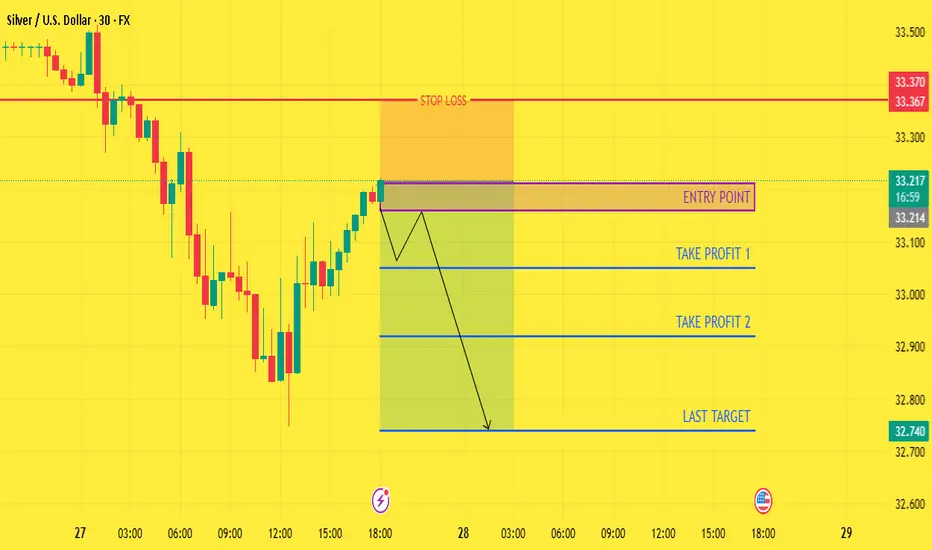
CHECK XAGUSD SIGNAL READ CAPTAIN( XAGUSD ) SELL zone
( TRADE SATUP)
entry point (33.160) to (33.210) 📊
FIRST TP (33.050)📊
2ND TARGET (33.920) 📊
LAST TARGET (33.740) 📊
STOP LOOS (33.370)❌