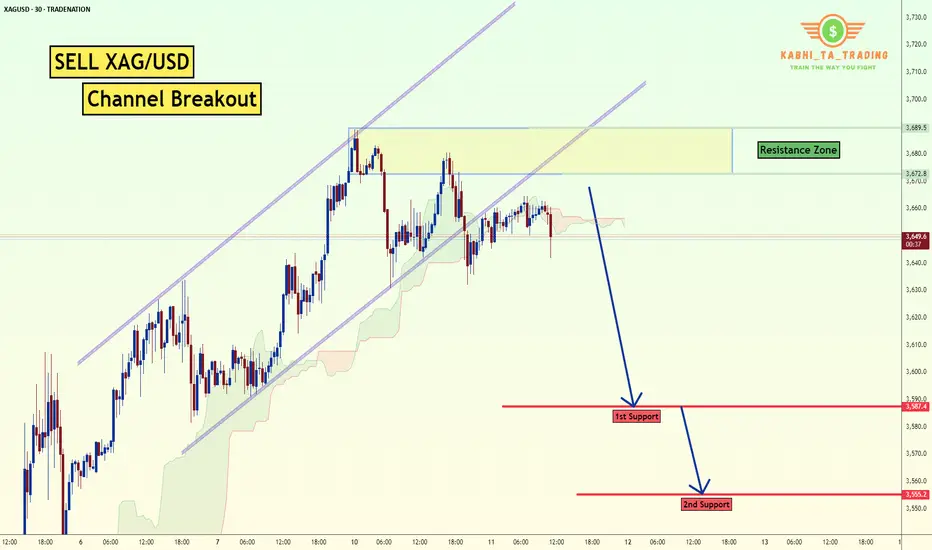
XAG/USD - Channel Breakout (11.06.2025) The XAG/USD Pair on the M30 timeframe presents a Potential Selling Opportunity due to a recent Formation of a CHannel Breakout Pattern. This suggests a shift in momentum towards the downside in the coming hours.
Possible Short Trade:
Entry: Consider Entering A Short Position around Trendline Of The Pattern.
Target Levels:
1st Support – 3587
2nd Support – 3555
🎁 Please hit the like button and
🎁 Leave a comment to support for My Post !
Your likes and comments are incredibly motivating and will encourage me to share more analysis with you.
Best Regards, KABHI_TA_TRADING
Thank you.
Disclosure: I am part of Trade Nation's Influencer program and receive a monthly fee for using their TradingView charts in my analysis.
XAGUSD trade ideas
Silver surge has more bullish upsideSilver is breaking out. Its strength is no accident. The US is running a structural deficit north of 6% of GDP in a full-employment economy. The bond market has absorbed the pain so far, but pressure is building. Investors are starting to look for insurance. Silver is one of the cleanest ways to play the dollar’s long-term debasement.
The metal is trading well above its 200-day moving average. The US$31.50-32.00 zone now acts as solid support. Any pullback into that range is likely to be short-lived.
Silver doesn’t move in straight lines. It runs, consolidates, then runs again, usually in 50–90 day cycles. The current setup fits that rhythm.
The gold-to-silver ratio is still near 100x. Historically, the average is closer to 60-70x. That gives silver more room to catch up. Traders can short gold and go long silver to play that mean reversion. Or simply buy silver outright and short the dollar. ETF inflows into silver have picked up, showing broader market interest.
The main risk? A sudden shift in Fed tone or falling inflation expectations. But that seems unlikely near term.
Silver isn’t just a trade. It’s a message. A hedge against fiscal irresponsibility and the cost of kicking the can too far.

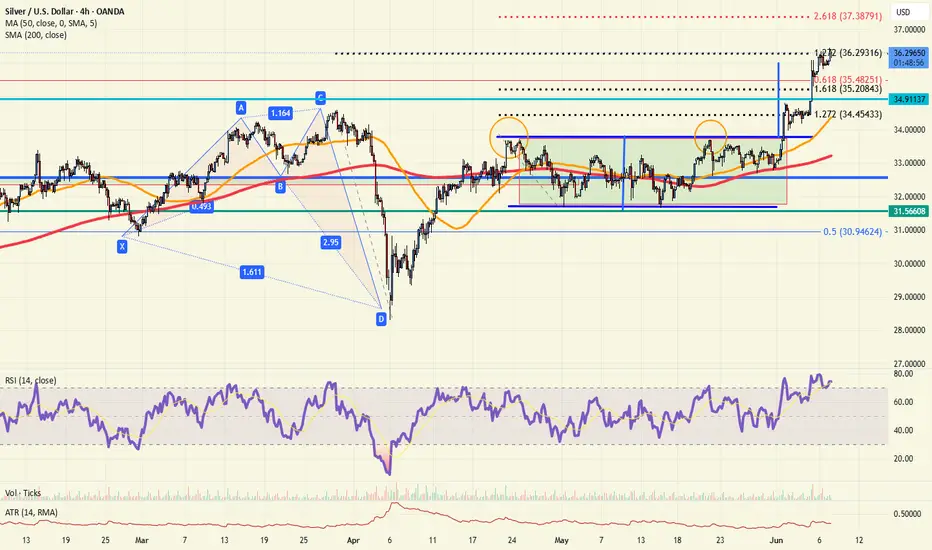
SILVER (#XAGUSD): Strong Bullish Move Ahead?!It appears we've seen a legitimate liquidity grab following a test of a crucial daily/intraday structure on 📈SILVER.
After a false breakout of the highlighted area, the price rebounded and broke through a significant downward trend line and a minor horizontal resistance on the 4H chart.
I believe the market could stay bullish and potentially reach at least the 36.88 level again.

Silver's Next Supercycle: $200+ by 2031?Silver has twice hit the $50 mark — once in 1980 and again in 2011. Today, it trades around $35, but the technical landscape is shifting fast.
At Vital Direction, our long-term Elliott Wave and Gann analysis signals a major breakout cycle already underway.
🌀 Wave structure suggests a multi-year impulsive rally
📐 Gann angles align with historic turning points
💥 Target: $200+ by 2031 (conservative)
⚙️ Backed by growing industrial demand, inflation risks, and monetary instability
This isn’t just a metal — it’s a macro opportunity.

SILVER Will Go Down! Short!
Take a look at our analysis for SILVER.
Time Frame: 9h
Current Trend: Bearish
Sentiment: Overbought (based on 7-period RSI)
Forecast: Bearish
The market is on a crucial zone of supply 3,622.4.
The oversold market condition in a combination with key structure gives us a relatively strong bullish signal with goal 3,483.8 level.
P.S
Please, note that an oversold/overbought condition can last for a long time, and therefore being oversold/overbought doesn't mean a price rally will come soon, or at all.
Disclosure: I am part of Trade Nation's Influencer program and receive a monthly fee for using their TradingView charts in my analysis.
Like and subscribe and comment my ideas if you enjoy them!

Linear Projection for Silver LONG TERM Cup and Handle Pattern.Silver is perhaps one of the most under-valued assets of our time, with bubbles ragining in almost all asset classes, poor lowly silver is sitting well below historical fair value, when priced in gold. But The Gold Silver Ratio being at such extremes does not mean Silver will rise, it is indeed possible for Gold to collapse and for Silver to merely hold steady-ish, and the gold silver ratio would be back in-sync.
What makes this particular time of such undervaluations in Silver so interesting, is that on long term time frames we see some extrenely powerful chart patterns that have been shaping up for 50 years or so. It is a Bullish Cup and Handle Pattern and we're currently drawing in what could be the last few months of the handle and if we confirm this pattern, chartists would give price targets between $90 on the low end and $700 on the high end. I've show the reasons for both extremes below. Reality, likely, will wind up being somewhere between both camps (if we do confirm the pattern) and someone will get cheeky with some Fibs and say they saw the top coming all along, or something, lol.
Historically Silver has pulled back HARSHLY after these moves, as much as 80-90%, however that was when the USD still had a very high likelihood of remaining the world resere currency still moving forward. If this happens, this time that won't look so certain, but I would still expect major volatility once a top is found and a pretty wide trading range to form.
We expect governments to continue to devalue their currencies, deficit spend, take part in QE programs and other monetary tricks to inflate away the debate. They won't actually inflate it away, of course, it'll just become a more enormous monster, but that's another administration/generation's issue to deal with!

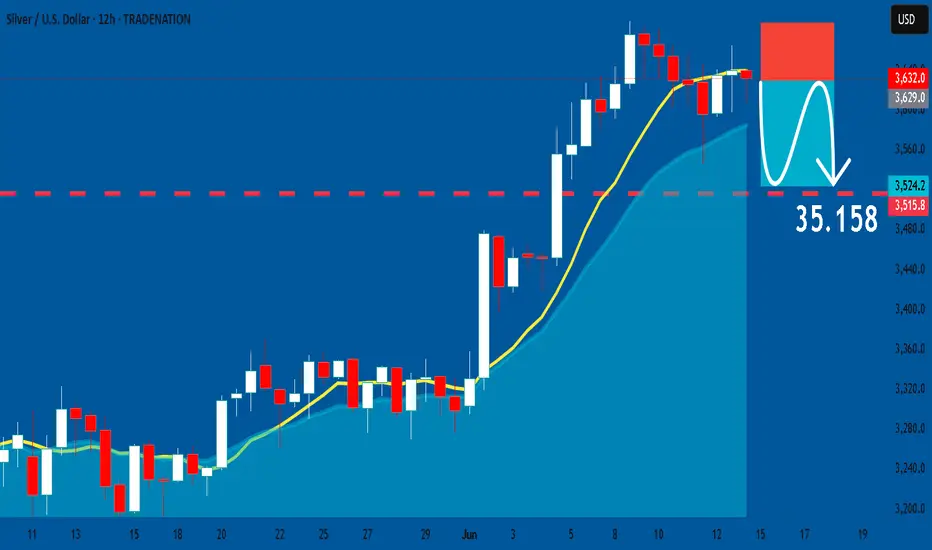
SILVER: Short Trade Explained
SILVER
- Classic bearish setup
- Our team expects bearish continuation
SUGGESTED TRADE:
Swing Trade
Short SILVER
Entry Point - 36.320
Stop Loss - 36.874
Take Profit - 35.158
Our Risk - 1%
Start protection of your profits from lower levels
Disclosure: I am part of Trade Nation's Influencer program and receive a monthly fee for using their TradingView charts in my analysis.
❤️ Please, support our work with like & comment! ❤️

SILVER: Short Signal with Entry/SL/TP
SILVER
- Classic bearish formation
- Our team expects pullback
SUGGESTED TRADE:
Swing Trade
Short SILVER
Entry - 35.980
Sl - 36.467
Tp - 34.940
Our Risk - 1%
Start protection of your profits from lower levels
Disclosure: I am part of Trade Nation's Influencer program and receive a monthly fee for using their TradingView charts in my analysis.
❤️ Please, support our work with like & comment! ❤️

Silver UP but PLATINIUM MOREHello there, good ? Me Yes.
Silver vs Platinium.
So we have a silver momentum against gold. But more than this, we have a platinium momentum against silver.
Platinium against silver is historically high.
So we need a reset.
The move is probably go at the bottom (x4 against silver). So, if Silver make a x5, plaitnium make a x20.
We have also a beautiful bearish pattern (white lines). For a safety capital rotation, go on platinium when the white line is break.
Indicator show us a reversal in 3M...
Look platinium chart (15 years of consolidation).
I recommend a big caution about Stocks. When commodities rises, it's not good.

SILVERTrading and analyzing the market is simple with demand ,supply , breakof structure ,change in character and retest rules.
silver bias is long ,so on 15min pull back crosses go long to target the next higher HIGH (bullish market is HH & HL .find HL and go HH.

Silver to 60-70, then 160? Analysts says yes.In this video, I share what analyst Michael Oliver believes will happen to silver over the next few years, now that momentum is taking silver higher and higher.

Update on Silver's march to $40.Update on Silver's march to $40.
Yes, there will eventually be a correction..
this rising support line needs to hold for higher up targets to be reached

Silver Update
All the idea about price action described on chart you can analyze over my analysis on SILVER . Silver is already on Impulsive Bullish moment from past few days.

Silver expectation 1HWell, this could be tricky, as i would like to see silver consolidate for a short time, then break through that top trend line. Or, it could come down for a second touch of support, then bounce off it and bull its way to the top. Me personally, i think it might do a bullish move, buts lets wait and see. #BuyTheBull

Possible Bearish Idea on SilverSilver seems overbought on the daily timeframe and on the 15 mins we can see a bearish breakout forming, if trendline get broken sell Silver to the target zone around 34.800

XAGUSD H1 I Bearish Reversal off the 61.8% FibBased on the H1 chart, the price is approaching our sell entry level at 36.87, a pullback resistance that aligns with the 61.8% Fib retracement.
Our take profit is set at 36.37, an overlap support.
The stop loss is set at 36.87, a swing high resistance.
High Risk Investment Warning
Trading Forex/CFDs on margin carries a high level of risk and may not be suitable for all investors. Leverage can work against you.
Stratos Markets Limited (tradu.com ):
CFDs are complex instruments and come with a high risk of losing money rapidly due to leverage. 63% of retail investor accounts lose money when trading CFDs with this provider. You should consider whether you understand how CFDs work and whether you can afford to take the high risk of losing your money.
Stratos Europe Ltd (tradu.com ):
CFDs are complex instruments and come with a high risk of losing money rapidly due to leverage. 63% of retail investor accounts lose money when trading CFDs with this provider. You should consider whether you understand how CFDs work and whether you can afford to take the high risk of losing your money.
Stratos Global LLC (tradu.com ):
Losses can exceed deposits.
Please be advised that the information presented on TradingView is provided to Tradu (‘Company’, ‘we’) by a third-party provider (‘TFA Global Pte Ltd’). Please be reminded that you are solely responsible for the trading decisions on your account. There is a very high degree of risk involved in trading. Any information and/or content is intended entirely for research, educational and informational purposes only and does not constitute investment or consultation advice or investment strategy. The information is not tailored to the investment needs of any specific person and therefore does not involve a consideration of any of the investment objectives, financial situation or needs of any viewer that may receive it. Kindly also note that past performance is not a reliable indicator of future results. Actual results may differ materially from those anticipated in forward-looking or past performance statements. We assume no liability as to the accuracy or completeness of any of the information and/or content provided herein and the Company cannot be held responsible for any omission, mistake nor for any loss or damage including without limitation to any loss of profit which may arise from reliance on any information supplied by TFA Global Pte Ltd.
The speaker(s) is neither an employee, agent nor representative of Tradu and is therefore acting independently. The opinions given are their own, constitute general market commentary, and do not constitute the opinion or advice of Tradu or any form of personal or investment advice. Tradu neither endorses nor guarantees offerings of third-party speakers, nor is Tradu responsible for the content, veracity or opinions of third-party speakers, presenters or participants.

Silver breakout: Bullish, but divergentIntraday Update: Silver is at the 127% extension of the March 28th highs to April 7th lows, RSI is divergent which may stall the rally, but dips back to the 35.50 level should find buyers now.
Keep in mind we trade well above the long term 61.8% retracement still at 35.48
SILVER SENDS CLEAR BEARISH SIGNALS|SHORT
SILVER SIGNAL
Trade Direction: short
Entry Level: 3,640.9
Target Level: 3,428.8
Stop Loss: 3,781.9
RISK PROFILE
Risk level: medium
Suggested risk: 1%
Timeframe: 12h
Disclosure: I am part of Trade Nation's Influencer program and receive a monthly fee for using their TradingView charts in my analysis.
✅LIKE AND COMMENT MY IDEAS✅

SILVER Buyers In Panic! SELL!
My dear friends,
My technical analysis for SILVER is below:
The market is trading on 36.320 pivot level.
Bias - Bearish
Technical Indicators: Both Super Trend & Pivot HL indicate a highly probable Bearish continuation.
Target - 35.168
Recommended Stop Loss - 36.830
About Used Indicators:
A pivot point is a technical analysis indicator, or calculations, used to determine the overall trend of the market over different time frames.
Disclosure: I am part of Trade Nation's Influencer program and receive a monthly fee for using their TradingView charts in my analysis.
———————————
WISH YOU ALL LUCK

Another Breakout or Correction?📆 June 11, 2025 | ⏱ 2H Chart Analysis
Silver (XAGUSD) has been respecting its bullish momentum since early June, with a clean breakout above the previous wedge consolidation pattern (visible late May). But now, the market is at a critical decision point.
🔍 Key Observations:
Price is testing the 36.50–36.60 zone, which aligns with the 15 EMA and horizontal resistance turned support.
We’ve seen exhaustion signs at recent highs (~36.88), followed by lower highs — possibly forming a micro-descending channel.
Price currently hovers between two key levels:
🔺 Upside target: If bulls defend 36.50, next resistance sits around 38.00, matching the long-term upper channel.
🔻 Downside risk: If support breaks and price falls below 35.90/35.70, we may see a sharp move toward 35.00, where the larger structure would be retested.
📈 Momentum Outlook:
EMA(15) > EMA(60) still shows medium-term bullish structure.
⚖️ Trade Idea (Not Financial Advice)
🟢 Bullish Bias if 36.50 holds with confirmation → Target: 38.00
🔴 Bearish Trigger if 35.90 breaks → Target: 35.00
🎯 Risk Management Key: Wait for price action around the decision zone.
💬 What’s your bias? Do you see a continuation or pullback?
📌 Follow for more XAGUSD, Forex & Commodity insights — 2–3 fresh charts weekly.
#XAGUSD #Silver #Forex #TechnicalAnalysis #TradingSetup #Metals #EMA #BreakoutOrFakeout #PriceAction #tradingview


Silver correction is nearing its endSilver is completing a bow-tie diametric pattern, currently in wave-f. After the diametric completes, there is a potential for an upward trend to form.
Good luck
NEoWave Chart
