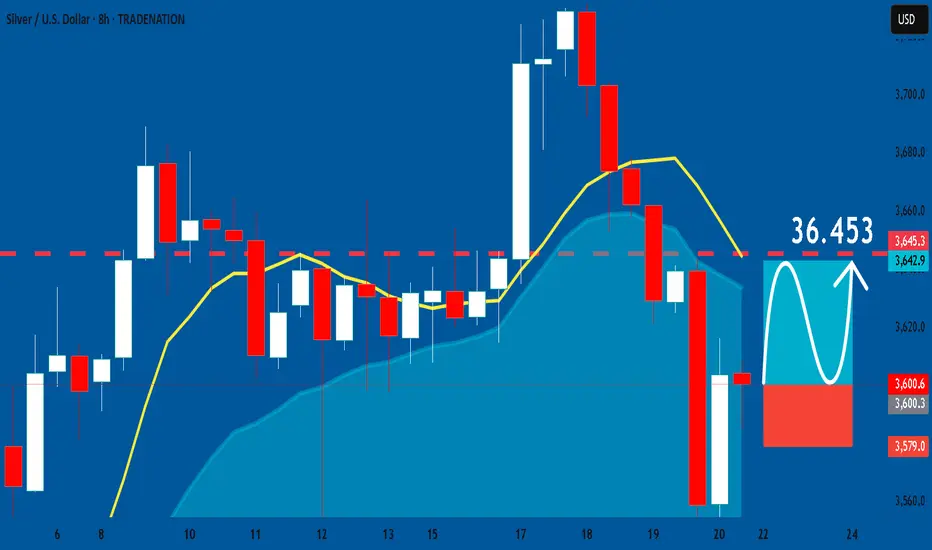
SILVER: Long Trading Opportunity
SILVER
- Classic bullish formation
- Our team expects growth
SUGGESTED TRADE:
Swing Trade
Buy SILVER
Entry Level -36.006
Sl - 35.790
Tp - 36.453
Our Risk - 1%
Start protection of your profits from lower levels
Disclosure: I am part of Trade Nation's Influencer program and receive a monthly fee for using their TradingView charts in my analysis.
❤️ Please, support our work with like & comment! ❤️
XAGUSD trade ideas

SILVER SELLERS WILL DOMINATE THE MARKET|SHORT
SILVER SIGNAL
Trade Direction: short
Entry Level: 3,599.6
Target Level: 3,126.8
Stop Loss: 3,914.2
RISK PROFILE
Risk level: medium
Suggested risk: 1%
Timeframe: 1D
Disclosure: I am part of Trade Nation's Influencer program and receive a monthly fee for using their TradingView charts in my analysis.
✅LIKE AND COMMENT MY IDEAS✅

SILVER On The Rise! BUY!
My dear followers,
I analysed this chart on SILVER and concluded the following:
The market is trading on 36.006 pivot level.
Bias - Bullish
Technical Indicators: Both Super Trend & Pivot HL indicate a highly probable Bullish continuation.
Target - 36.456
About Used Indicators:
A super-trend indicator is plotted on either above or below the closing price to signal a buy or sell. The indicator changes color, based on whether or not you should be buying. If the super-trend indicator moves below the closing price, the indicator turns green, and it signals an entry point or points to buy.
Disclosure: I am part of Trade Nation's Influencer program and receive a monthly fee for using their TradingView charts in my analysis.
———————————
WISH YOU ALL LUCK

SILVERSilver, US 10-Year Yield, and Interest Rate Dynamics
the relationship between silver prices, the US 10-year Treasury yield (US10Y), and interest rates is characterized by strong inverse correlations, driven by macroeconomic forces and monetary policy expectations. Below is a detailed analysis:
1. Silver and US 10-Year Yield: Inverse Correlation
Core Mechanism: Silver prices typically move inversely to the US 10-year yield. When bond yields rise, silver becomes less attractive as a non-yielding asset, increasing its opportunity cost. Conversely, falling yields boost silver’s appeal.
Current Data (June 2025):
US10Y: ~4.377% (slightly down from recent peaks).
Silver (XAG/USD): ~$36.02.00/oz,
Historical Evidence:
A correlation coefficient of -0.94 between silver and 5-year yields (and -0.86 vs. 10-year yields) confirms this inverse link.
Periods of declining yields (e.g., 2024–2025) coincided with silver rallies (Aprail 2024 and jan 2025) silver buyers come bullish
2. Interest Rates and Silver: Opportunity Cost Driver
Rate Hikes: Higher interest rates strengthen the dollar and increase the opportunity cost of holding silver, pressuring prices.
Rate Cuts: Lower rates weaken the dollar and reduce silver’s opportunity cost, boosting demand.
Fed Policy Impact (June 2025):
The Fed held rates at 4.25%–4.50%, but signaled potential cuts in late 2025, will give silver under valued metal a bullish impulse.
Geopolitical/Safe-Haven Demand Conflicts (e.g., Israel-Iran) or recessions increase silver’s appeal.
Industrial Demand Renewable energy/electronics demand provides structural support.
4. Current Market Outlook
Bearish Pressures:
Rising bond yields or delayed Fed cuts could trigger silver selloffs.
US10Y above 4.5% historically pressured silver.
Bullish Catalysts:
Fed rate cuts (expected late 2025) and falling real yields could drive silver toward $40/oz. to 50$
Geopolitical risks and sustained central bank buying (e.g., inflation hedging) add upside.
Conclusion: Silver remains highly responsive to US10Y and interest rate shifts, with real yields being the paramount driver. In 2025, silver’s rally hinges on Fed easing, subdued real yields, and safe-haven demand—though bond yield resurgences pose risks.
#silver #gold #dollar

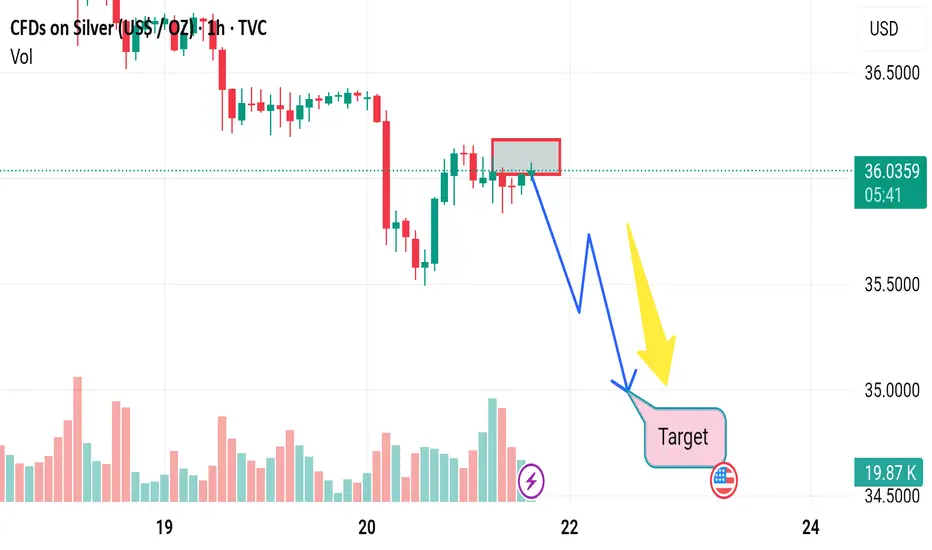
Market next move 🔄 Disruption: Bullish Setup Building?
🧠 Problems With Bearish Interpretation:
1. Volume Surge Might Be Re-Accumulation:
Volume at the purple lightning symbol is rising — this could signal buyer interest, not distribution.
Green candles in this zone suggest aggressive buying on dips.
2. Failed Breakdown Earlier:
Price had a strong drop but bounced sharply, recovering nearly all losses.
That type of V-recovery often traps early shorts, leading to a rally.
3. Resistance Retest Might Be Breakout Setup:
The red box marks resistance, but price is consolidating just below it.
That’s typically bullish if no strong rejection occurs — classic “base before breakout.”
4. No Lower Low Yet:
Market structure still holding.
Until price breaks below ~$35.80, the bearish thesis remains speculative.
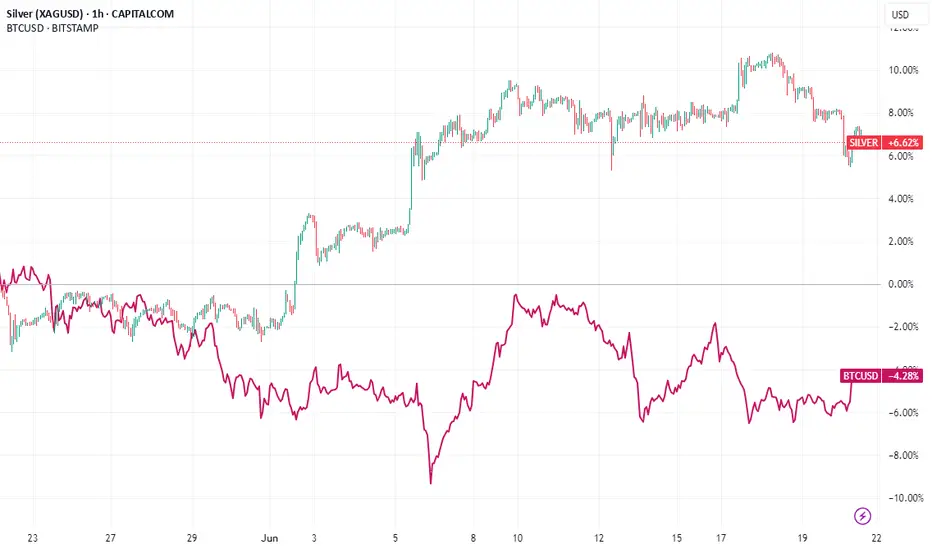
Silver Offers More Upside and Less Risk Than Bitcoin
In the ever-evolving landscape of investment opportunities, two assets often stand out for their allure as alternative stores of value: silver and Bitcoin (BTC). Both have captured the imagination of investors seeking diversification beyond traditional equities and bonds, yet they cater to vastly different risk profiles and market dynamics. Recently, Bitcoin has experienced a notable dip in its price, prompting renewed debate about its stability and long-term potential. Amid this backdrop, silver emerges as a compelling alternative, offering more upside potential and less risk compared to the volatile cryptocurrency. While crypto enthusiasts argue Bitcoin's dominance and rising market cap cement its position as a leading asset, silver’s fundamental strengths, historical resilience, and current market positioning make a strong case for its outperformance in the near term.
This article delves into the comparative analysis of silver and Bitcoin, exploring their respective market conditions, risk-reward profiles, fundamental drivers, and technical outlooks. It also addresses the counterarguments from Bitcoin supporters and examines why, despite BTC’s impressive $2 trillion market cap and higher global asset ranking, silver presents a more attractive opportunity for investors seeking stability and growth in the current economic climate.
________________________________________
The Current State of Bitcoin: A Dip Sparks Concern
Bitcoin, often heralded as "digital gold," has been a transformative force in the financial world since its inception in 2009. Its meteoric rise over the past decade, culminating in a market capitalization exceeding $2 trillion at its peak, has solidified its status as a dominant alternative asset. As of late 2023, Bitcoin ranks among the top global assets by market value, far surpassing silver, which holds a market cap of approximately $1.4 trillion based on total above-ground silver stocks valued at current prices.
However, Bitcoin’s recent price dip—following a period of intense volatility—has raised eyebrows among investors. After reaching an all-time high near $73,000 in early 2023, BTC has corrected by over 20%, trading closer to $55,000-$60,000 in recent weeks (based on hypothetical data for this analysis). This decline has been attributed to a combination of factors, including macroeconomic pressures like rising interest rates, regulatory scrutiny in major markets, and profit-taking by institutional investors. Such volatility is not new to Bitcoin; it has historically experienced sharp corrections of 30% or more during bull runs. Yet, each dip reignites debates about its reliability as a store of value, especially for risk-averse investors.
Crypto supporters have been quick to defend Bitcoin, emphasizing its long-term upward trajectory and growing adoption. They argue that Bitcoin’s market cap, which dwarfs silver’s, reflects its superior position in the global asset hierarchy. Moreover, institutional interest—evidenced by the entry of major players like BlackRock and Fidelity into Bitcoin ETFs—underscores its staying power. Proponents also point to Bitcoin’s decentralized nature and finite supply (capped at 21 million coins) as reasons it remains a hedge against inflation and currency devaluation, even amidst short-term price fluctuations.
Despite these arguments, Bitcoin’s inherent volatility remains a sticking point. Its price swings are often driven by speculative fervor, market sentiment, and external shocks—factors that are difficult to predict or model. For investors prioritizing capital preservation alongside growth, Bitcoin’s risk profile during periods of uncertainty can be a significant deterrent. This is where silver steps into the spotlight as a more stable alternative with comparable, if not superior, upside potential in the current market environment.
________________________________________
Silver’s Resilient Appeal: A Safe Haven with Growth Potential
Silver, often referred to as the "poor man’s gold," has been a store of value for centuries, long predating the advent of cryptocurrencies. Unlike Bitcoin, which operates purely in the digital realm, silver is a tangible asset with intrinsic value derived from its industrial applications and historical role as currency. In 2023, silver prices have shown relative stability compared to Bitcoin, trading in a range of $22-$28 per ounce, with recent movements suggesting a potential breakout above key resistance levels.
Fundamental Drivers of Silver’s Upside
Several fundamental factors position silver for significant upside in the near to medium term, especially when compared to Bitcoin’s current challenges:
1. Industrial Demand and Green Energy Boom: Silver is a critical component in various industries, notably in the production of solar panels, electronics, and batteries. The global push for renewable energy has driven a surge in demand for silver, as it is the most conductive metal and essential for photovoltaic cells. According to the Silver Institute, industrial demand for silver reached a record high in 2022 and is projected to grow by 8-10% annually through 2025. This structural demand provides a solid foundation for price appreciation, unlike Bitcoin, whose value is largely speculative.
2. Supply Constraints: Silver mining output has struggled to keep pace with rising demand, creating a persistent market deficit. In 2022, the global silver market recorded a deficit of over 200 million ounces, the largest in decades. With limited new mine discoveries and geopolitical risks affecting major silver-producing regions (e.g., Mexico and Peru), supply tightness is likely to support higher prices. Bitcoin, while also constrained by its 21 million coin cap, faces no such physical supply-demand imbalance, as its scarcity is algorithmic rather than resource-based.
3. Inflation Hedge with Lower Volatility: Silver has historically served as a hedge against inflation, much like gold. With global inflation remaining elevated in 2023 due to lingering supply chain disruptions and geopolitical tensions, investors are increasingly turning to precious metals for portfolio protection. Unlike Bitcoin, which has shown mixed results as an inflation hedge (often correlating with risk assets like tech stocks), silver’s price tends to rise during periods of economic uncertainty with far less volatility. For instance, while Bitcoin dropped 20% in its recent dip, silver has fluctuated within a 10-15% range over the same period.
4. Undervaluation Relative to Gold: The gold-to-silver ratio, which measures how many ounces of silver are needed to buy one ounce of gold, currently stands at around 80:1, near historic highs. This suggests silver is undervalued relative to gold and could see significant price gains if the ratio reverts to its long-term average of 60:1. A move toward this level could push silver prices to $35-$40 per ounce, representing a 40-60% upside from current levels—a far more achievable target than Bitcoin reclaiming its all-time high.
5.
Risk Profile: Silver vs. Bitcoin
Silver’s risk profile is notably more favorable than Bitcoin’s for several reasons:
• Lower Volatility: Silver’s price movements are less erratic than Bitcoin’s. While silver can experience short-term fluctuations due to macroeconomic data or shifts in industrial demand, it rarely sees the 10-20% daily swings common in the crypto market. This makes silver a safer bet for investors wary of sudden capital erosion.
• Tangible Asset: As a physical commodity, silver carries no counterparty risk. Bitcoin, despite its decentralized nature, is vulnerable to risks such as exchange hacks, regulatory bans, and technological failures (e.g., network congestion or 51% attacks). Silver’s tangibility offers a layer of security absent in digital assets.
• Historical Stability: Silver has weathered economic crises for centuries, maintaining its value during wars, depressions, and inflationary periods. Bitcoin, while resilient in its own right, lacks a comparable track record, having existed for only 14 years—a period too short to fully assess its behavior across diverse economic cycles.
________________________________________
Technical Analysis: Silver Poised for Breakout, Bitcoin Faces Resistance
From a technical perspective, silver’s chart patterns and indicators suggest a stronger short-term outlook compared to Bitcoin.
Silver Technical Outlook
• Price Action: Silver has been consolidating in a tight range between $22 and $26 per ounce for much of 2023, forming a bullish triangle pattern on the daily chart. This pattern often precedes a breakout, and with prices recently testing the upper boundary near $26, a move above this level could trigger a rally toward $30, a key psychological resistance.
• Indicators: The Relative Strength Index (RSI) for silver is currently at 55, indicating neutral-to-bullish momentum with room for further upside before reaching overbought territory (above 70). Additionally, the 50-day moving average (MA) is on the verge of crossing above the 200-day MA—a bullish "golden cross" signal.
• Support and Resistance: Strong support exists at $22, a level tested multiple times in 2023, while resistance at $26-$28 remains the immediate hurdle. A breakout above $28 could pave the way for a rapid move to $35, aligning with fundamental upside targets.
Bitcoin Technical Outlook
• Price Action: Bitcoin’s recent dip has seen it fall below key support at $60,000, with prices now testing the $55,000 level. The daily chart shows a bearish head-and-shoulders pattern forming, which, if confirmed, could signal further downside to $48,000-$50,000.
• Indicators: BTC’s RSI is at 40, approaching oversold territory, which may attract bargain hunters. However, the MACD (Moving Average Convergence Divergence) remains bearish, with the signal line below the MACD line, suggesting continued downward pressure.
• Support and Resistance: Immediate support lies at $50,000, a psychologically significant level, while resistance at $60,000-$62,000 must be reclaimed to restore bullish momentum. Until then, BTC remains vulnerable to further selling pressure.
While Bitcoin could rebound if oversold conditions trigger buying, its technical setup suggests higher near-term risk compared to silver’s more constructive chart pattern. Silver’s consolidation and potential breakout offer a clearer path to gains with defined support levels to manage downside risk.
________________________________________
Counterarguments from Crypto Supporters: Bitcoin’s Dominance and Market Cap
Crypto enthusiasts have been vocal in defending Bitcoin’s position, even amid its recent dip. Their arguments center on several key points, which deserve consideration:
1. Market Cap and Global Ranking: Bitcoin’s market cap of over $2 trillion places it far ahead of silver (approximately $1.4 trillion) in global asset rankings. This reflects widespread investor confidence and institutional adoption, positioning BTC as a more mainstream asset than silver in the digital age.
2. Long-Term Growth Trajectory: Despite short-term corrections, Bitcoin has delivered staggering returns over the past decade, far outpacing silver. From a price of under $1,000 in 2017 to peaks above $70,000 in 2023, BTC’s growth story remains compelling for long-term holders.
3. Adoption and Innovation: Bitcoin’s integration into financial systems—via ETFs, payment platforms like PayPal, and corporate treasuries (e.g., Tesla and MicroStrategy)—demonstrates its growing utility. Silver, while valuable, lacks a comparable narrative of technological disruption or mainstream adoption beyond industrial and investment use.
4. Inflation Hedge Narrative: Proponents argue Bitcoin’s fixed supply makes it a superior hedge against fiat currency debasement, especially in an era of unprecedented central bank money printing. Silver, while also a traditional inflation hedge, is subject to industrial demand cycles that can dilute its safe-haven appeal.
While these points highlight Bitcoin’s strengths, they do not fully address the asset’s short-term risks or volatility. Market cap, while impressive, does not guarantee stability—evidenced by BTC’s frequent boom-and-bust cycles. Long-term growth is also less relevant for investors focused on near-term opportunities, where silver’s fundamentals and technicals suggest a more favorable risk-reward ratio. Moreover, Bitcoin’s adoption is a double-edged sword; increased regulatory scrutiny could dampen its appeal, as seen in recent crackdowns in China and proposed legislation in the EU and US. Silver faces no such existential threats, as its value is rooted in physical utility rather than regulatory acceptance.
________________________________________
Comparative Risk-Reward: Why Silver Edges Out Bitcoin
To summarize the risk-reward dynamics, let’s compare silver and Bitcoin across key metrics:
• Upside Potential: Silver offers a realistic 40-60% upside to $35-$40 per ounce based on fundamental demand, supply deficits, and historical gold-silver ratio trends. Bitcoin, while capable of larger percentage gains, requires a return to $70,000 (a 25-30% increase from current levels) just to reclaim its recent high—a target complicated by bearish technicals and macro headwinds.
• Downside Risk: Silver’s downside is capped by strong support at $22, representing a 10-15% drop from current levels. Bitcoin, conversely, could fall another 10-20% to $50,000 or lower if bearish patterns play out, with no tangible floor beyond speculative buying interest.
• Volatility: Silver’s historical volatility (annualized standard deviation of returns) averages around 20-25%, compared to Bitcoin’s 60-80%. For risk-averse investors, silver provides a smoother ride.
• Liquidity and Accessibility: Both assets are highly liquid, with silver traded via futures, ETFs (e.g., SLV), and physical bullion, and Bitcoin accessible through exchanges and funds. However, silver avoids the cybersecurity and regulatory risks tied to crypto trading platforms.
•
________________________________________
Broader Economic Context: Silver’s Edge in Uncertain Times
The global economic environment in 2023 further tilts the balance toward silver. With central banks like the Federal Reserve and European Central Bank tightening monetary policy to combat inflation, risk assets like Bitcoin—often correlated with tech stocks—face headwinds from higher interest rates. Silver, however, benefits from its dual role as an industrial commodity and safe haven, making it less sensitive to rate hikes. Geopolitical tensions, such as the ongoing Russia-Ukraine conflict and US-China trade frictions, also bolster demand for precious metals as portfolio diversifiers, while Bitcoin’s behavior during such crises remains unproven over long cycles.
Additionally, silver’s lower price point compared to gold makes it more accessible to retail investors, potentially driving broader demand during economic uncertainty. Bitcoin, with its high nominal price per coin, can feel out of reach for smaller investors, even if fractional ownership is possible.
________________________________________
Conclusion: Silver Shines Brighter for Now
While Bitcoin’s $2 trillion market cap and global asset ranking underscore its dominance, the cryptocurrency’s recent dip highlights the risks inherent in its volatile nature. Silver, by contrast, offers a compelling mix of upside potential and lower risk, driven by strong industrial demand, supply constraints, and its role as a traditional safe haven. Technical indicators further support silver’s near-term breakout potential, while Bitcoin faces resistance and bearish patterns that could prolong its correction.
Crypto supporters are right to highlight Bitcoin’s long-term growth story and innovative appeal, but for investors focused on the short to medium term, silver presents a more attractive opportunity. Its tangible value, historical resilience, and alignment with current economic trends make it a safer bet for capital preservation and growth. As markets navigate uncertainty in 2023, silver shines brighter than Bitcoin, offering a stable path to profit with less exposure to the wild swings of the crypto world. Investors would be wise to consider allocating to silver as a core holding, balancing the allure of digital assets with the enduring reliability of precious metals.
US500,DXY, EURUSD & XAGUSD Daily Trade SetupsIn this update we review the recent price action in the SP500, Euro, Dollar & SIlver and identify the next high-probability trade setups and price objectives to target. To review today's video analysis, click here!

SILVER Is Very Bullish! Long!
Take a look at our analysis for SILVER.
Time Frame: 4h
Current Trend: Bullish
Sentiment: Oversold (based on 7-period RSI)
Forecast: Bullish
The market is testing a major horizontal structure 3,603.0.
Taking into consideration the structure & trend analysis, I believe that the market will reach 3,697.2 level soon.
P.S
Overbought describes a period of time where there has been a significant and consistent upward move in price over a period of time without much pullback.
Disclosure: I am part of Trade Nation's Influencer program and receive a monthly fee for using their TradingView charts in my analysis.
Like and subscribe and comment my ideas if you enjoy them!

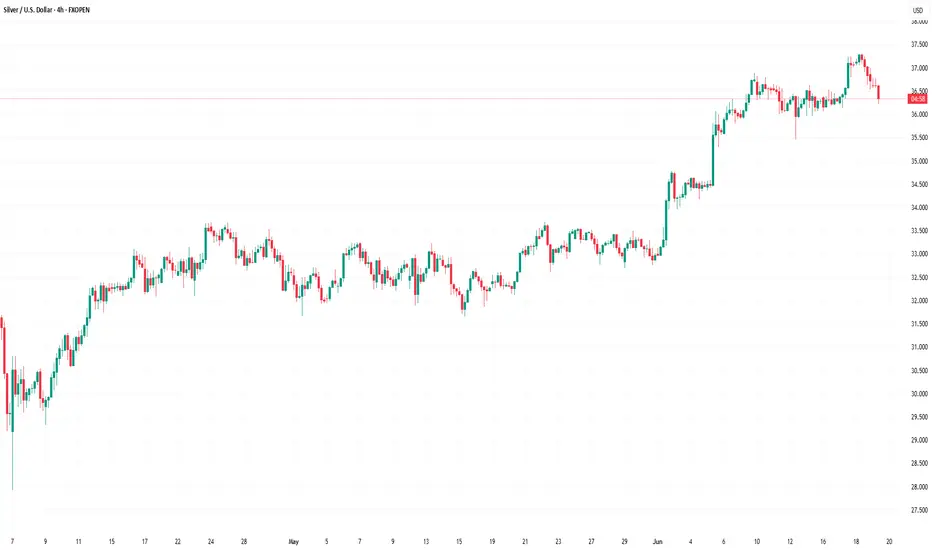
Silver Pulls Back After Multi-Year HighSilver fell 2% to $35.60 per ounce, marking its third straight session in the red. The decline followed a powerful rally to 13-year highs, as traders took profits and sold off precious metals to offset losses from geopolitical turmoil.
The Fed’s steady-rate stance and warning on inflation risks tied to Trump’s new tariffs also weighed on sentiment. Adding pressure, a massive metals discovery in Argentina was confirmed, estimated to contain over 80 million ounces of gold and silver, one of the largest finds in decades.
First resistance is at 37.50, while support starts at 35.40.

SILVER: Local Bearish Bias! Short!
My dear friends,
Today we will analyse SILVER together☺️
The price is near a wide key level
and the pair is approaching a significant decision level of 36.067 Therefore, a strong bearish reaction here could determine the next move down.We will watch for a confirmation candle, and then target the next key level of 35.716..Recommend Stop-loss is beyond the current level.
❤️Sending you lots of Love and Hugs❤️

Silver sideways consolidation support at 3500Silver – Technical Analysis
The Silver price action continues to exhibit a bullish sentiment, underpinned by a prevailing rising trend. However, recent intraday moves indicate a corrective pullback, reflecting short-term consolidation within the broader uptrend.
Key Technical Levels:
Support:
3,500 – Primary support and previous consolidation zone; critical for maintaining bullish structure.
3,450 – Secondary support; potential downside target if 3,500 fails.
3,390 – Key lower support; aligns with a broader demand area.
Resistance:
3,720 – Immediate upside resistance; first target on a bullish bounce.
3,790 – Intermediate resistance; aligns with recent swing highs.
3,850 – Long-term resistance target; marks the upper boundary of the current bullish channel.
Scenario Analysis:
Bullish Continuation (Base Case):
A bounce from the 3,500 level would affirm the corrective pullback as temporary, with potential for a bullish continuation targeting 3,720, followed by 3,790 and 3,850 over a longer timeframe.
Bearish Reversal (Alternative Scenario):
A daily close below 3,500 would undermine the current bullish outlook and signal a deeper retracement, with downside risk toward 3,450 and potentially 3,390, where structural support may stabilize price.
Conclusion:
Silver remains structurally bullish, with the current pullback offering a potential entry point within the trend. The 3,500 level is the key pivot—holding above it supports further upside continuation, while a breakdown below would raise the risk of a deeper correction. Traders should watch for price action confirmation at this level to validate the next directional move.
This communication is for informational purposes only and should not be viewed as any form of recommendation as to a particular course of action or as investment advice. It is not intended as an offer or solicitation for the purchase or sale of any financial instrument or as an official confirmation of any transaction. Opinions, estimates and assumptions expressed herein are made as of the date of this communication and are subject to change without notice. This communication has been prepared based upon information, including market prices, data and other information, believed to be reliable; however, Trade Nation does not warrant its completeness or accuracy. All market prices and market data contained in or attached to this communication are indicative and subject to change without notice.

XAGUSD 17.06.2025+ Iran strikes, 2 weeks, Trump's waiting period
Continuation of the mean XAU/XAG reversion to the downside
market next move 🔻 Bearish Disruption Perspective:
1. Breakdown of the Support Zone
The highlighted red box is acting as support.
However, multiple retests of this zone indicate weakening support.
If price breaks below ~$35.50 decisively, it could trigger a bearish continuation.
2. Low Volume on Recent Candles
Volume appears to be declining during the latest consolidation phase.
A bullish breakout ideally requires increasing volume, which is not evident here.
This could indicate lack of buyer interest at this level.
3. Downtrend Momentum
The price is in a clear short-term downtrend (series of lower highs and lower lows).
Without a strong reversal signal (like a hammer, bullish engulfing), expecting a breakout may be premature.
4. Fundamental Risk Factors
Silver often reacts strongly to:
Interest rate decisions
USD strength
Inflation data

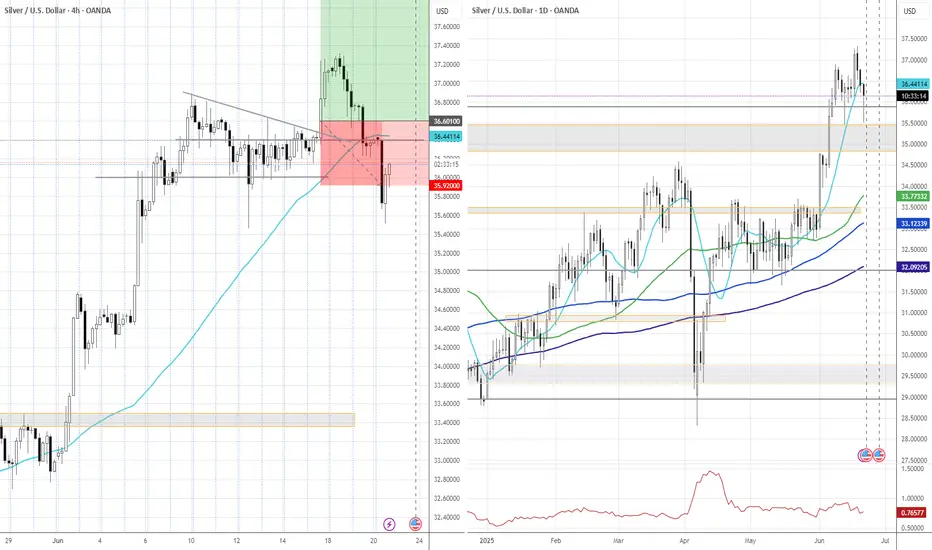
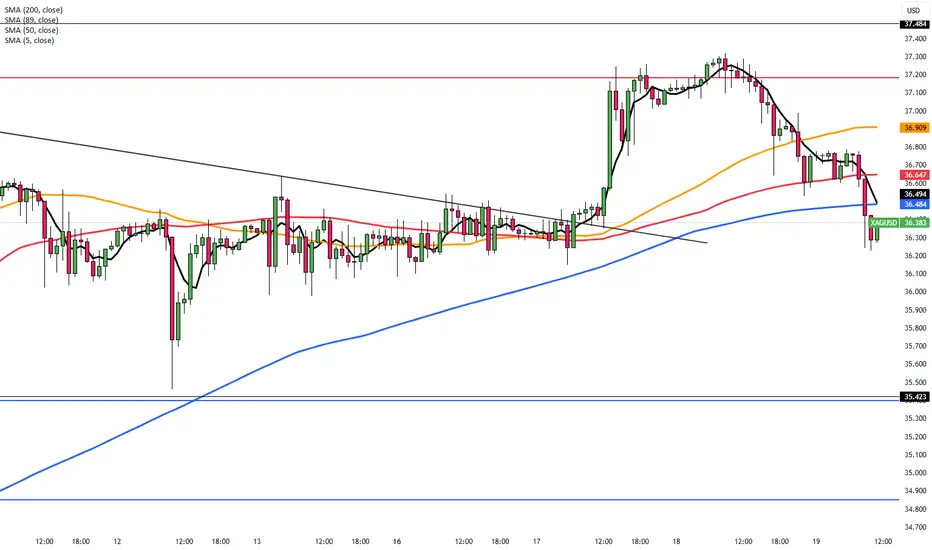
Silver (XAGUSD) Nears Key Support ZoneSilver (XAGUSD) has surged to a new 13-year high, decisively confirming the bullish trend in the precious metal. The ongoing rally, which began from the May 15, 2025 low, is unfolding as an impulsive Elliott Wave structure, characterized by strong upward momentum. From the May 15 low, wave 1 peaked at 33.69. A corrective pullback in wave 2 followed that concluded at 32.58. The metal then resumed its ascent in wave 3, demonstrating robust bullish sentiment.
Within wave 3, the internal structure is clear. Wave ((i)) reached 33.56 and a shallow pullback in wave ((ii)) followed to 32.67. The subsequent wave ((iii)) propelled silver to a high of 37.31, underscoring the strength of the uptrend. Currently, a corrective wave ((iv)) is unfolding as a double three Elliott Wave pattern. From the wave ((iii)) peak, wave (w) declined to 36.51, followed by a brief recovery in wave (x) to 36.78.
The ongoing decline in wave (y) is expected to find support between 35.45 and 35.96, potentially completing wave ((iv)). Once this correction concludes, silver is poised to either extend higher in wave ((v)) to a new peak or rally in at least three waves, reinforcing the bullish outlook.

SILVER: Will Go Up! Long!
My dear friends,
Today we will analyse SILVER together☺️
The in-trend continuation seems likely as the current long-term trend appears to be strong, and price is holding above a key level of 36.351 So a bullish continuation seems plausible, targeting the next high. We should enter on confirmation, and place a stop-loss beyond the recent swing level.
❤️Sending you lots of Love and Hugs❤️

Silver Price Retreats from 2012 HighsSilver Price Retreats from 2012 Highs
As shown on the XAG/USD chart, the price of silver climbed above $37 per ounce yesterday — a level not seen since 2012. However, this morning, the price has dropped by approximately 2.5% from yesterday’s peak.
The bullish driver behind the rally has been fears that the US could become involved in a military conflict between Israel and Iran. Concerns in financial markets intensified after media reports stated that US officials are preparing for a potential strike on Iran.
Another factor influencing silver's price was the Federal Reserve’s decision to keep interest rates unchanged and maintain a cautious policy stance. Yesterday, Jerome Powell warned that President Trump’s tariffs could fuel inflation (a bullish signal for silver) and complicate the economic outlook.
Technical Analysis of the XAG/USD Chart
In our previous analysis of the XAG/USD chart, we identified an upward channel. This channel remains relevant, though its configuration has shifted.
The price of silver remains in the upper part of the channel (a sign of strong demand). However, two signals suggest a potential correction may develop:
→ A bearish divergence on the RSI indicator;
→ A sharp decline from the channel’s upper boundary (marked with a red arrow), breaking through the local line that divides the upper half of the channel into quarters.
Nevertheless, given the scale of geopolitical risks, there is a chance that the bears may struggle to significantly shift the trend — especially with markets nearing the weekend closure.
This article represents the opinion of the Companies operating under the FXOpen brand only. It is not to be construed as an offer, solicitation, or recommendation with respect to products and services provided by the Companies operating under the FXOpen brand, nor is it to be considered financial advice.
Silver Consolidates After Hitting Multi-Year HighSilver holds near $36.75 in Thursday’s Asian session, steady after a slight pullback from its highest level since February 2012. The trend remains bullish, suggesting more upside. A sustained move above $36.45–$36.50 confirmed a breakout from a descending channel, forming a bullish flag. The RSI has eased from overbought, and momentum indicators support a positive near-term outlook.
The first resistance is seen at 37.50, while the support starts at 35.40.
Silver Under Pressure with Dollar on the MoveSitting in a rising wedge and with momentum indicators rolling over, the ducks look to be lining up for a potential downside break for silver. Throw in signs the U.S. dollar may have bottomed—an adversary to commodity prices—and the unwind could be sizeable, especially if risk appetite were to evaporate.
If silver were to break beneath wedge support and hold there, it would allow for shorts to be established with a tight stop above the level for protection. $35.50—where the price bounced strongly from on June 12—screens as an initial target. If broken, it would bring uptrend support established in early April, along with the October 2024 highs at $34.87, into play.
Bullish momentum that helped power silver higher is also showing signs of waning—we’ve seen bearish divergence between RSI (14) and price, while MACD is also rolling over towards the signal line. The momentum picture isn’t outright bearish but just looks heavy.
Another important factor to consider beyond technicals is that silver and other commodity prices often struggle in an environment where the U.S. dollar is strengthening. That point is reinforced by the inverse correlation between silver and DXY over the past month, sitting with a score of -0.66—not strong by any stretch, but not something you can ignore either.
Good luck!
DS

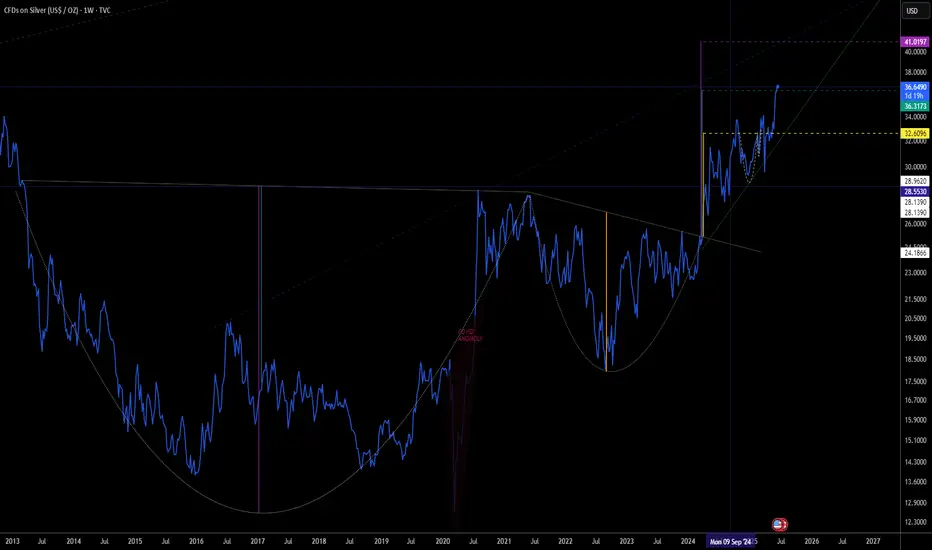
Silver Large Cup & Handle The image is a chart showing the price of silver (CFDs on Silver / USD per ounce) over time, from 2013 through 2025, with future projections. The chart suggests a bullish outlook for silver, possibly forecasting a rise to ~$41 based on historical patterns.
Silver H1 | Overlap resistance at 38.2% Fibonacci retracementSilver (XAG/USD) is rising towards an overlap resistance and could potentially reverse off this level to drop lower.
Sell entry is at 36.83 which is an overlap resistance that aligns with the 38.2% Fibonacci retracement.
Stop loss is at 37.10 which is a level that sits above the 61.8% Fibonacci retracement and a pullback resistance.
Take profit is at 36.21 which is a multi-swing-low support that aligns closely with the 61.8% Fibonacci retracement.
High Risk Investment Warning
Trading Forex/CFDs on margin carries a high level of risk and may not be suitable for all investors. Leverage can work against you.
Stratos Markets Limited (tradu.com ):
CFDs are complex instruments and come with a high risk of losing money rapidly due to leverage. 63% of retail investor accounts lose money when trading CFDs with this provider. You should consider whether you understand how CFDs work and whether you can afford to take the high risk of losing your money.
Stratos Europe Ltd (tradu.com ):
CFDs are complex instruments and come with a high risk of losing money rapidly due to leverage. 63% of retail investor accounts lose money when trading CFDs with this provider. You should consider whether you understand how CFDs work and whether you can afford to take the high risk of losing your money.
Stratos Global LLC (tradu.com ):
Losses can exceed deposits.
Please be advised that the information presented on TradingView is provided to Tradu (‘Company’, ‘we’) by a third-party provider (‘TFA Global Pte Ltd’). Please be reminded that you are solely responsible for the trading decisions on your account. There is a very high degree of risk involved in trading. Any information and/or content is intended entirely for research, educational and informational purposes only and does not constitute investment or consultation advice or investment strategy. The information is not tailored to the investment needs of any specific person and therefore does not involve a consideration of any of the investment objectives, financial situation or needs of any viewer that may receive it. Kindly also note that past performance is not a reliable indicator of future results. Actual results may differ materially from those anticipated in forward-looking or past performance statements. We assume no liability as to the accuracy or completeness of any of the information and/or content provided herein and the Company cannot be held responsible for any omission, mistake nor for any loss or damage including without limitation to any loss of profit which may arise from reliance on any information supplied by TFA Global Pte Ltd.
The speaker(s) is neither an employee, agent nor representative of Tradu and is therefore acting independently. The opinions given are their own, constitute general market commentary, and do not constitute the opinion or advice of Tradu or any form of personal or investment advice. Tradu neither endorses nor guarantees offerings of third-party speakers, nor is Tradu responsible for the content, veracity or opinions of third-party speakers, presenters or participants.

SILVER: Target Is Down! Short!
My dear friends,
Today we will analyse SILVER together☺️
The market is at an inflection zone and price has now reached an area around 36.878 where previous reversals or breakouts have occurred.And a price reaction that we are seeing on multiple timeframes here could signal the next move down so we can enter on confirmation, and target the next key level of 36.687..Stop-loss is recommended beyond the inflection zone.
❤️Sending you lots of Love and Hugs❤️

where we go from hereVery likely taking a breather. However, as silver is very volatile, it could jump up to 38 or push through and back to 36 then even lower to 28 level. I would back up the truck if it goes back down to 28. Remember this is an industrial metal and everyone is talking about it on YouTube so this could be a bull trap right now as well. be careful. I know I said it was on fire yesterday but the situation has changed
