XAGUSD Analysis : Bearish Setup 2x Supply to Next Reversal Zone🔍 Market Context & Technical Overview
Silver (XAGUSD) has recently gone through a sharp corrective phase after breaking above a key structural high and retesting previous resistance. The current price action reflects a clean MMC-patterned behavior, including volume absorption, QFL trap, and interaction with a descending trendline that has now become critical for further directional bias.
🧠 Key Observations Based on MMC Principles
🔵 1. Volume Absorption at the Triangle Breakout
After a prolonged consolidation phase inside a triangle pattern, volume absorption took place—indicating hidden accumulation.
A breakout above the structure was confirmed with momentum (also breaking a previously established “High Breaked” level).
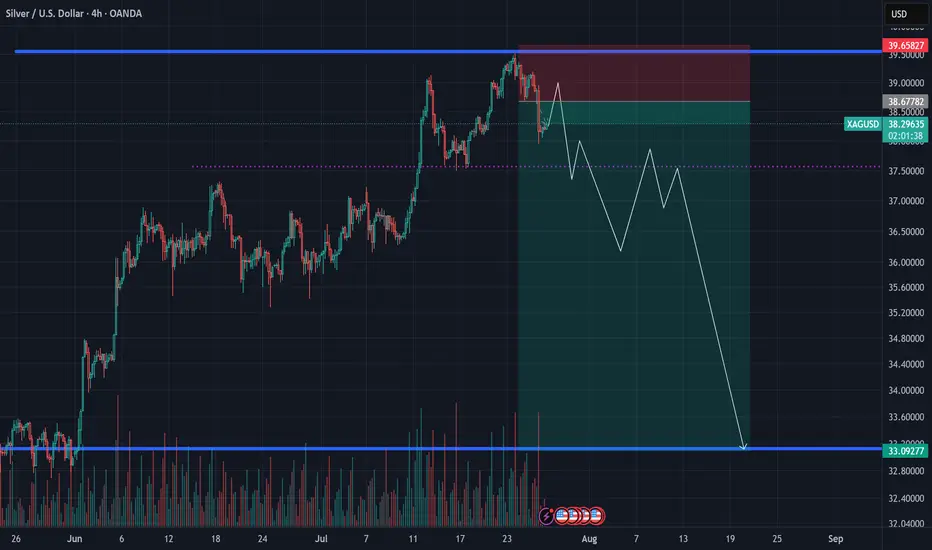
This breakout led to a vertical move towards the 2x Channel Supply Interchange Zone, where price reversed sharply.
🟥 2. Supply Interchange Zone (2x Confirmed)
Price encountered resistance at the green supply block, which acted as a 2x supply zone—a critical confluence where previous sellers re-engaged.
This area had previously served as the channel boundary, creating a supply interchange effect.
⚠️ 3. QFL Zone Trap (Fake Momentum)
The price printed a QFL structure, where it created a flat base, faked a move up, and quickly reversed.
The QFL base acted as a trap for late buyers, which aligned with the start of a bearish phase that is still ongoing.
📉 4. Downtrend & Trendline Respect
Price has respected a strong descending trendline since the reversal at supply.
Each retest has resulted in a lower high, confirming the bearish structure is intact for now.
Currently, the price is trading below this trendline, reinforcing short-term bearish sentiment.
📦 Key Levels to Watch
Zone/Level Type Role
38.70 – 39.20 2x Supply Zone Strong resistance, reversal origin
37.40 – 37.60 Minor Level Short-term support turned resistance
36.00 – 35.40 Next Reversal Zone ✅ High-probability long area, MMC expects reaction
Trendline Dynamic Structure control, needs break for bullish shift
🔁 Scenarios Based on Structure
📈 Scenario 1: Bullish Reversal from Green Demand Block
Price is approaching the next MMC reversal zone (green box below 36.00).
MMC logic suggests a 100% probability of bullish reaction based on:
Volume cycle completion
Downward exhaustion
Proximity to previous institutional accumulation zones
Expected move: bounce toward trendline retest and minor resistance at ~37.50.
📉 Scenario 2: Break Below Green Zone = Panic Sell
If the green zone fails to hold:
A panic drop toward 34.80–35.00 is possible.
However, based on MMC mapping, this is less likely without a major macro catalyst.
💡 Strategic Thoughts (MMC Traders’ Lens)
We’re observing a classic MMC Phase 3 correction following Phase 2 expansion.
The current cycle favors reaccumulation, especially if a wick or engulfing candle forms inside the green zone.
Price action traders should wait for confirmation (e.g., break of trendline, bullish structure on 1H) before entering.
📌 Educational Trade Plan (Not Financial Advice)
Setup Entry Zone Stop Loss Target 1 Target 2
Reversal Long 35.80 – 36.20 35.40 37.50 38.70
Trendline Break Long Above 37.10 36.40 38.00 39.00
Bearish Continuation Below 35.40 36.10 34.80 33.90
🧾 Conclusion & Final Note
Silver is trading at a make-or-break point as it approaches a high-probability reversal zone, identified through MMC methodology. Watch the price action near 36.00 closely—it holds the key to whether we begin a new bullish phase or extend this bearish cycle.
✅ MMC traders will stay reactive, not predictive, and align with structure.
🚨 Patience is key—let the market show its hand before commitment.
XAGUSD trade ideas

Silver ShortSI1! is now net short on the regression break.
Gold has not followed at this time.
I am not taking this trade directly.

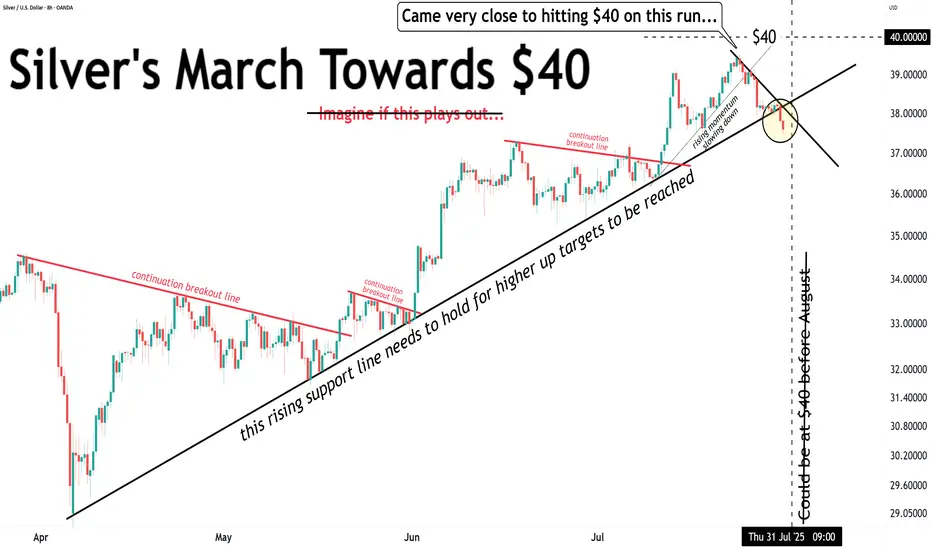
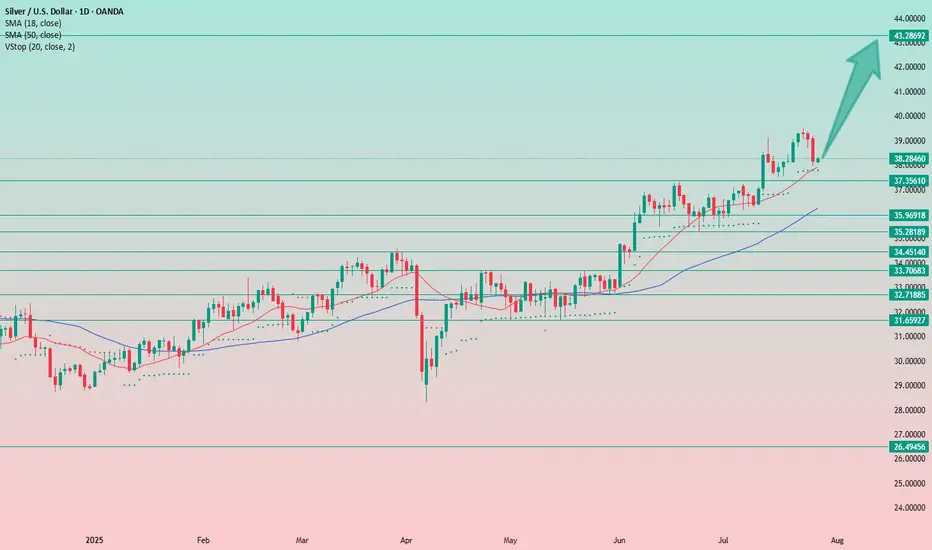
SILVER H9 IdeaWhen you look at silver market has actually been in an uptrend for about three years. It was sideways a couple of times, and it’s very possible that we go sideways or correctionn for the short term. But over the longer term, it goes from the lower left to the upper right, and there’s really no way to dispute that.

Silver came very close to $40… but lost steam.That’s it, folks.
Silver came very close to $40… but lost steam.
We’ve now closed below the rising support line.
Momentum has broken.
The correction deepens.
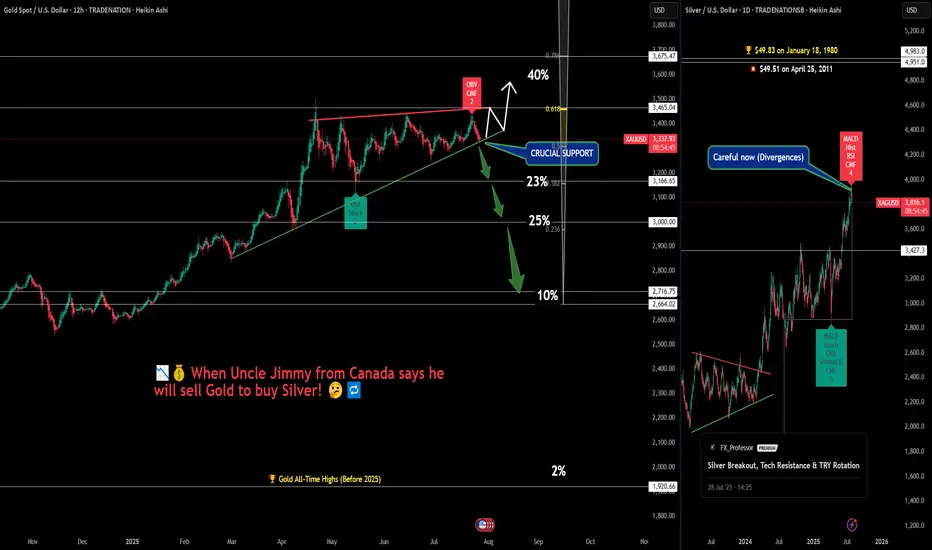
When Gold Believers Flip – Uncle Jimmy, Silver & New Safe Havens💰📉 When Gold Believers Flip – Uncle Jimmy, Silver, and the New Safe Havens 🧠🔄
Let me tell you a story that says more than any chart ever could.
📜 Meet Uncle Jimmy (from Canada) . He’s not really my uncle, but out of respect, that’s what I call him.
A true OG — early stockbroker, big mustache , 20+ apartments, a life built on commissions, charts, and one sacred truth: '' Gold never lies. ''
He's bought gold at every dip, every crisis, every whisper of war or inflation.
But now?
“I’m thinking of selling gold to buy silver.” ( WHAT?! 😳👀💥)
That’s it. That’s the moment.
📉 A gold maxi flipping into silver. A generational pivot.
And that’s the real divergence the chart doesn’t always show.
⚖️ Macro Sentiment Rotation:
📊 Gold
Sitting on crucial support. Breakout potential to $3,465+ remains — but divergences (OBV, CMF) are stacking. A breakdown? Targets stretch down to $3,000 or even $2,716.
🪙 Silver
Just hit $38.14 — now eyeing the legendary $49.83 ATH from 1980. Legacy capital rotating in. Silver’s moment? (My chart says 'wait a bit'...divergences!)
💻 NASDAQ/Tech
Some now call it the “new safe haven” — not because of bonds, but because of trust in corporate resilience vs. geopolitical chaos. When Nasdaq rises, silver often outperforms gold — risk appetite returns, and so does industrial metal demand.
₿ Bitcoin
And then there’s Bitcoin…
The safe haven that legacy minds still don’t trust.
I told Uncle Jimmy to buy it at:
→ $4,000
→ $18,000
→ $45,000
→ Even $70,000.... I stopped doing that at some point, he just wouldn't get it, or wouldn't make a move into the 'crypto unknown'. Respect!
So...He never did. Maybe Bitcoin just became what gold once was — but for the next generation. Not for Big Jimmy.
🧠 What to Watch:
Sentiment is shifting
Safe havens are evolving
Charts show structure — but stories show psychology
Whether you're long metals, crypto, or tech — the key is knowing when beliefs break and rotations begin.
Watch price. Listen to sentiment. And never underestimate Uncle Jimmy.
What would you tell Jimmy today if he was your uncle? Let me know below!
One Love,
The FX PROFESSOR 💙
Disclosure: I am happy to be part of the Trade Nation's Influencer program and receive a monthly fee for using their TradingView charts in my analysis. Awesome broker, where the trader really comes first! 🌟🤝📈
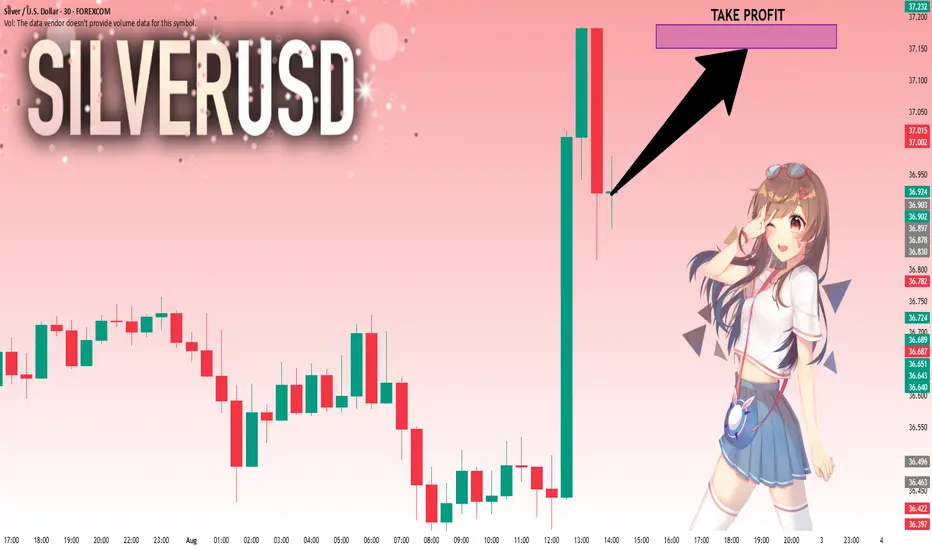
SILVER: Local Bullish Bias! Long!
My dear friends,
Today we will analyse SILVER together☺️
The recent price action suggests a shift in mid-term momentum. A break above the current local range around 36.920 will confirm the new direction upwards with the target being the next key level of 37.150 and a reconvened placement of a stop-loss beyond the range.
❤️Sending you lots of Love and Hugs❤️
SILVER SENDS CLEAR BEARISH SIGNALS|SHORT
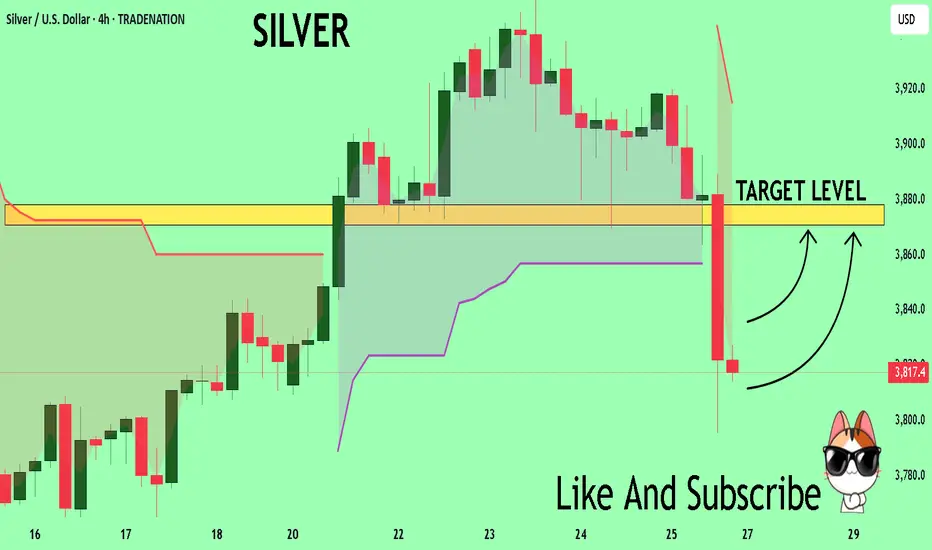
SILVER SIGNAL
Trade Direction: short
Entry Level: 3,820.7
Target Level: 3,794.3
Stop Loss: 3,837.9
RISK PROFILE
Risk level: medium
Suggested risk: 1%
Timeframe: 1h
Disclosure: I am part of Trade Nation's Influencer program and receive a monthly fee for using their TradingView charts in my analysis.
✅LIKE AND COMMENT MY IDEAS✅

Silver seems Bearish here...Lookinf at the fact that the asending flag has been broken... I think is BEarish...

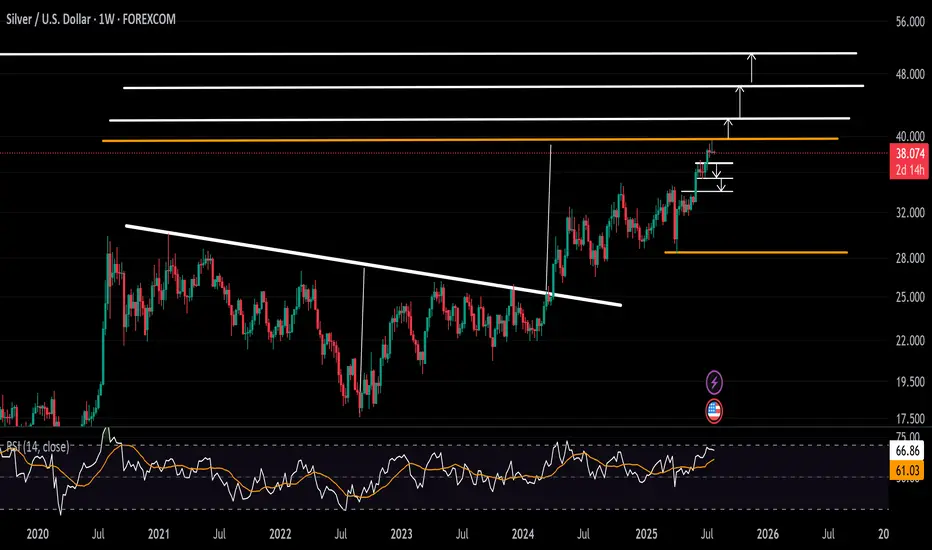
Silver Signals Pullback Risks From $40 BarrierFrom a fundamental standpoint, the strength seen in both tech and silver markets in 2025 may be supported by the structural integration of AI and innovation into global economic agendas. As AI and technology increasingly become the backbone of global infrastructure and development, demand is likely to remain strong.
Silver is currently retreating from the $40 psychological zone, the 39.50 high, which aligns with the target of an inverted head and shoulders pattern formed between August 2020 and March 2024.
• Pullback Scenario: In line with weekly overbought momentum as per the RSI indicator, a retracement may target support levels at $37, $36.20, and $35.20 before resuming its broader bullish trend.
• Breakout Scenario: A confirmed close above $40 may open the door to $42, $46, and potentially a move beyond $50.
Written by Razan Hilal, CMT
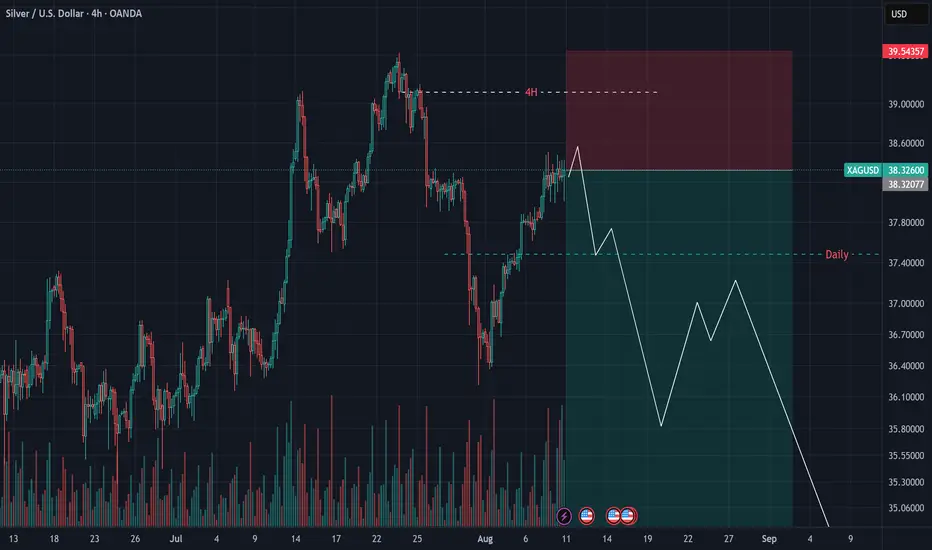
XAGUSD Technical Outlook – July 27, 2025
Silver appears to be losing momentum at the top, and for the first time in a while, we’ve seen a strong bearish daily candle, suggesting that sellers may be stepping in more seriously.
🌀 Previous pullbacks mostly looked like profit-taking, but this drop seems to be accompanied by actual selling pressure.
Despite breaking the previous high over the past two weeks, silver has failed to extend gains meaningfully — a potential sign of exhaustion.
🎯 A low-risk short opportunity may be forming around the $38–$39 range.
⚠️ For more patient and risk-tolerant traders, a daily close below $37 could open the door for a broader correction toward the $33–$35 zone — levels that have remained untested.
Stay sharp — momentum shifts often start quietly.
Uptrend Intact: Price Pullback Offers New Long Entry OpportunityThe upward structure of the chart remains intact, and I believe the growth will likely continue in the near future.
At the moment, we’re seeing a price pullback, which provides new opportunities to enter a long position.
I will place a wide stop at the 37.35 level.
Trading balanceTrading balance The price of the asset has rebounded from the balance zone. With the prospect of growth into the resistance zone.
Silver bullish flag developingThe Silver remains in a bullish trend, with recent price action showing signs of a continuation breakout within the broader uptrend.
Support Zone: 3686 – a key level from previous consolidation. Price is currently testing or approaching this level.
A bullish rebound from 3686 would confirm ongoing upside momentum, with potential targets at:
3814 – initial resistance
3865 – psychological and structural level
3920 – extended resistance on the longer-term chart
Bearish Scenario:
A confirmed break and daily close below 3686 would weaken the bullish outlook and suggest deeper downside risk toward:
3645 – minor support
3590 – stronger support and potential demand zone
Outlook:
Bullish bias remains intact while the Silver holds above 3686. A sustained break below this level could shift momentum to the downside in the short term.
This communication is for informational purposes only and should not be viewed as any form of recommendation as to a particular course of action or as investment advice. It is not intended as an offer or solicitation for the purchase or sale of any financial instrument or as an official confirmation of any transaction. Opinions, estimates and assumptions expressed herein are made as of the date of this communication and are subject to change without notice. This communication has been prepared based upon information, including market prices, data and other information, believed to be reliable; however, Trade Nation does not warrant its completeness or accuracy. All market prices and market data contained in or attached to this communication are indicative and subject to change without notice.

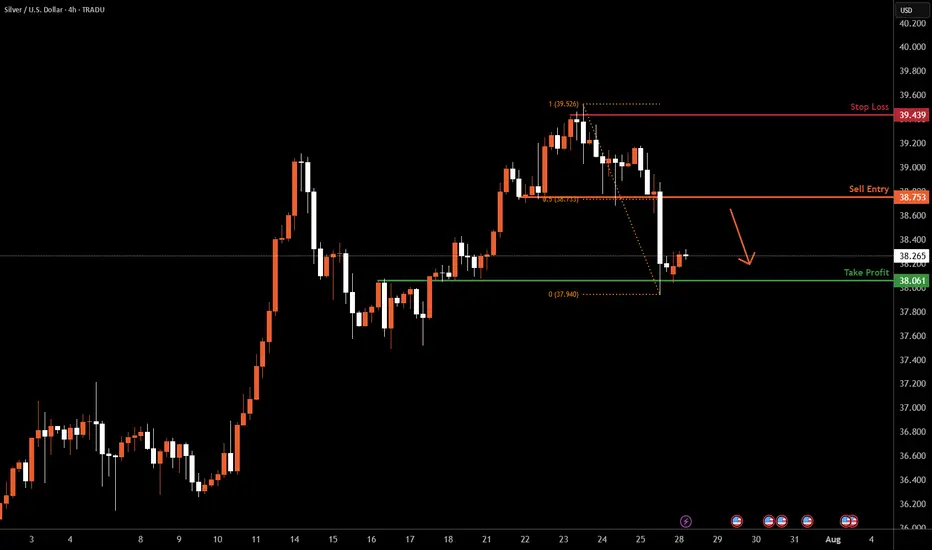
XAGUSD H4 I Bearish Reversal Based on the H4 chart analysis, we can see that the price is rising toward our sell entry at 38.75, which is a pullback resistance aligning with a 50% Fibo retracement.
Our take profit will be at 38.06, an overlap support level.
The stop loss will be placed at 39.43, a swing-high resistance level.
High Risk Investment Warning
Trading Forex/CFDs on margin carries a high level of risk and may not be suitable for all investors. Leverage can work against you.
Stratos Markets Limited (tradu.com ):
CFDs are complex instruments and come with a high risk of losing money rapidly due to leverage. 66% of retail investor accounts lose money when trading CFDs with this provider. You should consider whether you understand how CFDs work and whether you can afford to take the high risk of losing your money.
Stratos Europe Ltd (tradu.com ):
CFDs are complex instruments and come with a high risk of losing money rapidly due to leverage. 66% of retail investor accounts lose money when trading CFDs with this provider. You should consider whether you understand how CFDs work and whether you can afford to take the high risk of losing your money.
Stratos Global LLC (tradu.com ):
Losses can exceed deposits.
Please be advised that the information presented on TradingView is provided to Tradu (‘Company’, ‘we’) by a third-party provider (‘TFA Global Pte Ltd’). Please be reminded that you are solely responsible for the trading decisions on your account. There is a very high degree of risk involved in trading. Any information and/or content is intended entirely for research, educational and informational purposes only and does not constitute investment or consultation advice or investment strategy. The information is not tailored to the investment needs of any specific person and therefore does not involve a consideration of any of the investment objectives, financial situation or needs of any viewer that may receive it. Kindly also note that past performance is not a reliable indicator of future results. Actual results may differ materially from those anticipated in forward-looking or past performance statements. We assume no liability as to the accuracy or completeness of any of the information and/or content provided herein and the Company cannot be held responsible for any omission, mistake nor for any loss or damage including without limitation to any loss of profit which may arise from reliance on any information supplied by TFA Global Pte Ltd.
The speaker(s) is neither an employee, agent nor representative of Tradu and is therefore acting independently. The opinions given are their own, constitute general market commentary, and do not constitute the opinion or advice of Tradu or any form of personal or investment advice. Tradu neither endorses nor guarantees offerings of third-party speakers, nor is Tradu responsible for the content, veracity or opinions of third-party speakers, presenters or participants.
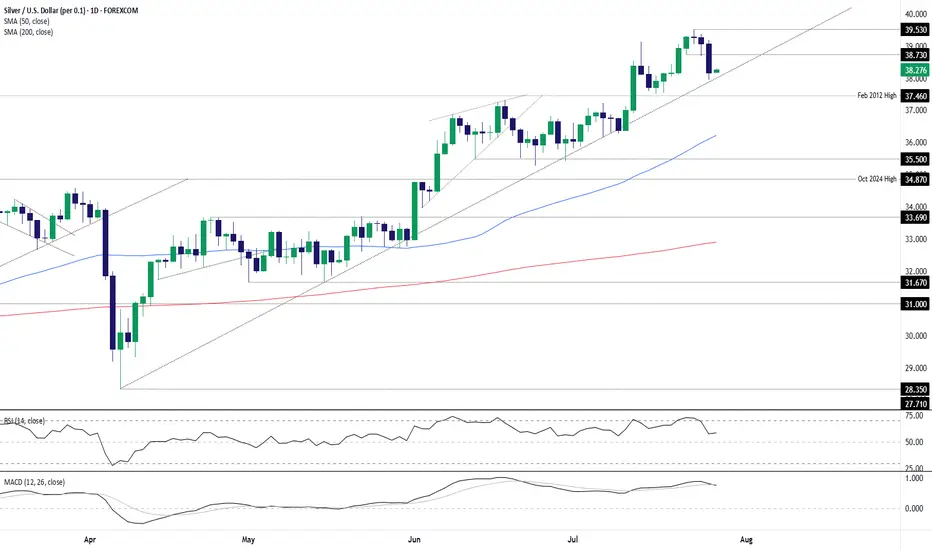
Silver dips to trendline, bulls eye bounceSilver’s latest pullback has seen it move back towards long-running uptrend support, creating a decent entry level for longs with price momentum favouring buying dips over selling rips.
Longs could be established above the trendline with a stop beneath for protection, targeting minor resistance at $38.73 initially and, if broken, the July 23 swing high of $39.53. If the latter were to be achieved, price and momentum signals at the time should dictate whether to hold for a potential test of the psychologically important $40 level.
The price has already bounced off the uptrend on numerous occasions since being established, enhancing the appeal of the setup. While RSI (14) and MACD are not screaming buy when it comes to market momentum, they’re tilted bullish rather than bearish, favouring upside.
If silver were to break and close beneath the uptrend, the bullish bias would be invalidated.
Good luck!
DS
Silver is in the Bearish trend after testing ResistanceHello Traders
In This Chart XAGUSD HOURLY Forex Forecast By FOREX PLANET
today XAGUSD analysis 👆
🟢This Chart includes_ (XAGUSD market update)
🟢What is The Next Opportunity on XAGUSD Market
🟢how to Enter to the Valid Entry With Assurance Profit
This CHART is For Trader's that Want to Improve Their Technical Analysis Skills and Their Trading By Understanding How To Analyze The Market Using Multiple Timeframes and Understanding The Bigger Picture on the Charts

SILVER Trading Opportunity! BUY!
My dear friends,
Please, find my technical outlook for SILVER below:
The price is coiling around a solid key level - 38.174
Bias - Bearish
Technical Indicators: Pivot Points High anticipates a potential price reversal.
Super trend shows a clear sell, giving a perfect indicators' convergence.
Goal - 38.708
About Used Indicators:
The pivot point itself is simply the average of the high, low and closing prices from the previous trading day.
Disclosure: I am part of Trade Nation's Influencer program and receive a monthly fee for using their TradingView charts in my analysis.
———————————
WISH YOU ALL LUCK
SILVER A Fall Expected! SELL!
My dear friends,
SILVER looks like it will make a good move, and here are the details:
The market is trading on 38.352 pivot level.
Bias - Bearish
Technical Indicators: Supper Trend generates a clear short signal while Pivot Point HL is currently determining the overall Bearish trend of the market.
Goal - 37.909
About Used Indicators:
Pivot points are a great way to identify areas of support and resistance, but they work best when combined with other kinds of technical analysis
Disclosure: I am part of Trade Nation's Influencer program and receive a monthly fee for using their TradingView charts in my analysis.
———————————
WISH YOU ALL LUCK

Silver Analysis – August 10, 2025Long-term outlook for Silver remains bullish,
but over the past few weeks, early signs of a correction have started to appear.
The break below $36 and inability to reclaim the previous high
suggest sellers are slowly stepping in.
My key liquidity zone sits between $33 – $34,
and I believe a revisit of this area is needed before Silver can make a meaningful push higher.
Summary:
If we don’t see a daily close above $38.5 this week,
I expect the correction to start from current levels and gradually target my main entry zone.
SILVER WILL GO UP|LONG|
✅SILVER is already making
A bullish rebound from the
Horizontal support of 38.10$
While trading in an uptrend
So we are bullish biased and
We will be expecting a
Further bullish move up
LONG🚀
✅Like and subscribe to never miss a new idea!✅

SILVER: Weak Market & Bearish Forecast
The charts are full of distraction, disturbance and are a graveyard of fear and greed which shall not cloud our judgement on the current state of affairs in the SILVER pair price action which suggests a high likelihood of a coming move down.
Disclosure: I am part of Trade Nation's Influencer program and receive a monthly fee for using their TradingView charts in my analysis.
❤️ Please, support our work with like & comment! ❤️

SILVER: Target Is Up! Long!
My dear friends,
Today we will analyse SILVER together☺️
The market is at an inflection zone and price has now reached an area around 38.330 where previous reversals or breakouts have occurred.And a price reaction that we are seeing on multiple timeframes here could signal the next move up so we can enter on confirmation, and target the next key level of 38.432.Stop-loss is recommended beyond the inflection zone.
❤️Sending you lots of Love and Hugs❤️

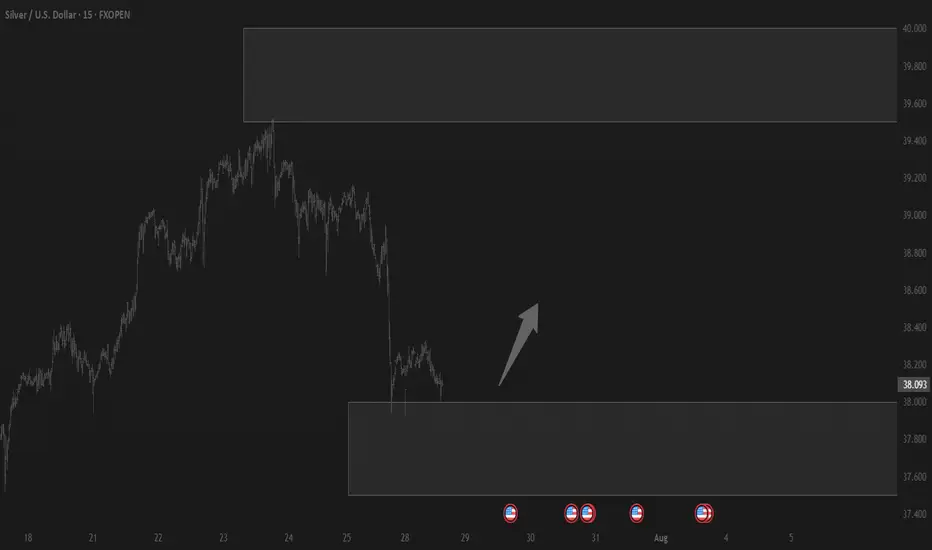
XAGUSD – Short-Term Bullish Push, Possible Medium-Term Reversal 📊 Technical Overview:
Silver is currently trading at 38.40, pressing against minor resistance at 38.57 – 38.60. Short-term price action shows a bullish breakout structure with a target toward the 38.78 – 38.80 supply zone. If this area is tapped, watch for signs of exhaustion — potential reversal zone aligning with previous liquidity sweep highs.
Key support sits at 38.00, with a break below increasing probability of a move toward 37.50 – 37.40 in the medium term.
🌍 Fundamental Outlook:
Dovish USD bias: The recent softening in U.S. economic data has kept the dollar under mild pressure, supporting metals.
Rate cut expectations: Markets are pricing in higher chances of Fed rate cuts later this year, which typically boosts non-yielding assets like silver.
Geopolitical undercurrent: Safe-haven demand remains a backstop amid ongoing geopolitical tensions, adding short-term bullish momentum.
However, stronger-than-expected U.S. inflation data or hawkish Fed commentary could cap gains and trigger a pullback.
