SILVER: Strong Growth Ahead! Long!
My dear friends,
Today we will analyse SILVER together☺️
The in-trend continuation seems likely as the current long-term trend appears to be strong, and price is holding above a key level of 38.099 So a bullish continuation seems plausible, targeting the next high. We should enter on confirmation, and place a stop-loss beyond the recent swing level.
❤️Sending you lots of Love and Hugs❤️
XAGUSD trade ideas

Trading balanceTrading balance The price of the asset has rebounded from the balance zone. With the prospect of growth into the resistance zone.
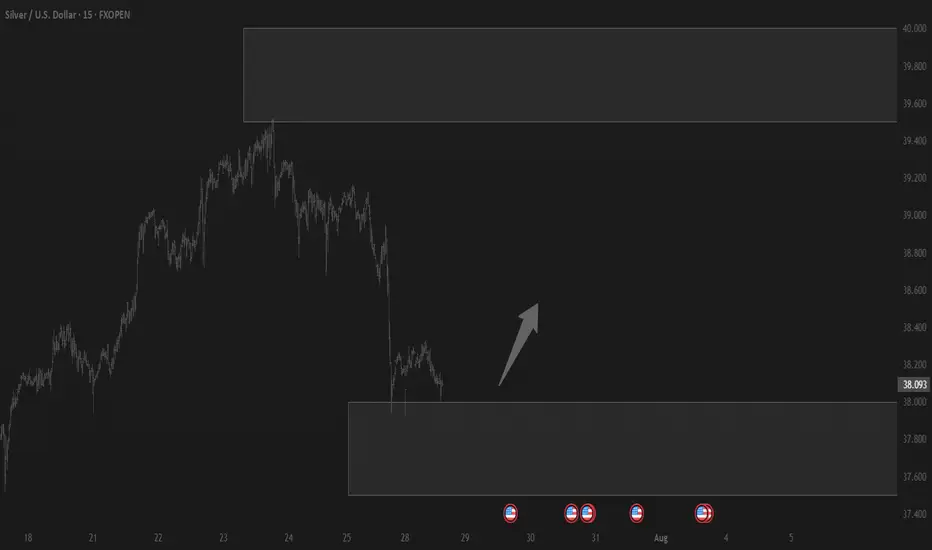
XAG USD LONG RESULT Silver price broke down the Ascending Channel it was trading in and gormed a weak falling wedge pattern with low selling pressure, so I expected buyers to change the momentum and go for the upside, which did just not reaching to the oder block I set.
But a good trade overall, still closed at BE.
Better Setups Ahead 💪
_THE_KLASSIC_TRADER_.

XAG/USD on high time frame
"Hello, for investors in XAG/USD, the $37 zone appears to be a low-risk area for buying. Both technical and fundamental analyses suggest that the price is likely to move higher towards $48."
If you require further insights or have additional information to discuss, feel free to share!
SILVER SUPPORT AHEAD|LONG|
✅SILVER has been falling recently
And Silver seems locally oversold
So as the pair is approaching
A horizontal support of 37.80$
Price growth is to be expected
LONG🚀
✅Like and subscribe to never miss a new idea!✅
Disclosure: I am part of Trade Nation's Influencer program and receive a monthly fee for using their TradingView charts in my analysis.

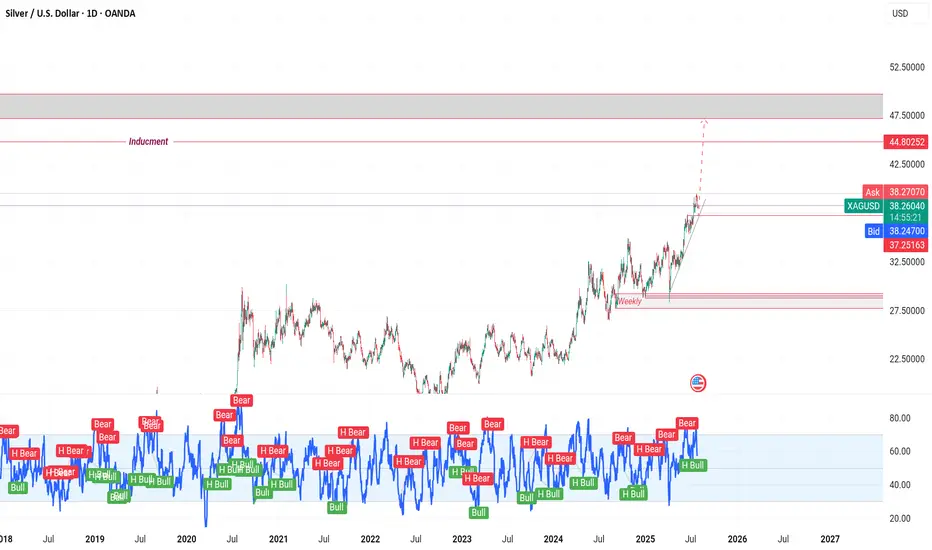
XAGUSD - Silver - Important levels for the next few years!!These are important levels for the next few years.
I expect a new ATH for Silver. Better know where you buy and where you should sell.
Several CUP & Handle show how much silver is bullish.
After Gold, it's Silver's turn..

The biggest cup&handle of all times: silver targets $50The data suggests a cup&handle:
Cup was between 1980-2011
Handle is still in progress and probably may finish by 2025 or earlier.
For the short run: a re-test of low re-accumulation range of $23 can be seen.
The next mid-term target will be $25.
Final target will be $50.

XAGUSD SILVER ON 3OTH we are expecting a strong fundamental data .
ADP Non-Farm Employment Change forecast 82K previous -33K
Advance GDP q/q forecast 2.4% previous -0.5% Advance GDP Price Index q/q forecast 2.3% previous 3.8%
Pending Home Sales m/m0.3% 1.8%
7:00pm
USD
Federal Funds Rate
4.50% 4.50%
USD
FOMC Statement
7:30pm
USD
FOMC Press Conference.
we will be watching the data outlook for clear directional bias.

SILVER XAGUSD ON 3OTH we are expecting a strong fundamental data .
ADP Non-Farm Employment Change forecast 82K previous -33K
Advance GDP q/q forecast 2.4% previous -0.5% Advance GDP Price Index q/q forecast 2.3% previous 3.8%
Pending Home Sales m/m0.3% 1.8%
7:00pm
USD
Federal Funds Rate
4.50% 4.50%
USD
FOMC Statement
7:30pm
USD
FOMC Press Conference.
we will be watching the data outlook for clear directional bias.

SILVER: Expecting Bullish Continuation! Here is Why:
The charts are full of distraction, disturbance and are a graveyard of fear and greed which shall not cloud our judgement on the current state of affairs in the SILVER pair price action which suggests a high likelihood of a coming move up.
Disclosure: I am part of Trade Nation's Influencer program and receive a monthly fee for using their TradingView charts in my analysis.
❤️ Please, support our work with like & comment! ❤️

LONG SILVERDirection: Bullish
Moving Average: Red above Blue
Pattern Impulse: Impulse correction
Fib Retracement: 38.2
MACD > 0
1st Target = 39.11
2nd Target = 39.87
RISK: Silver already making new highs

XAGUSD--SHORT--strong rejection from upper side of green channel
--for second wave of downward movement, expecting first pullback upward to 38.42 level
--entry point is cross-section of,orange channel, black channel!s upper side.
--movement will be down to lower side of green channel.

XAG longXAG prices may rise from $37.9, located at the FVG Zone and Leg of BAT Pattern , towards the targets .

Head & Shoulders Pattern Confirmed bearish sign A clear Head and Shoulders pattern has formed on the 4H timeframe, and confirmation is in place after a decisive break below the neckline around $39.00.
🔍 Technical Breakdown:
Left Shoulder: Formed around July 11–15
Head: July 19–23 peak
Right Shoulder: Developing through July 24–25
Neckline: ~$39.00 zone (now broken)
Current Price: ~$38.30
Target: ~$38.00 – $37.80 (based on pattern projection)
The break below the 50 EMA adds bearish confirmation. Caution is advised unless price reclaims the neckline level.

Chart Analysis on the SilverYou can follow us for more Analysis(Images and Videos) with Precise definition of the Financial Market.ENJOY!!!

SILVER: The Market Is Looking Down! Short!
My dear friends,
Today we will analyse SILVER together☺️
The recent price action suggests a shift in mid-term momentum. A break below the current local range around 38.780 will confirm the new direction downwards with the target being the next key level of 38.635.and a reconvened placement of a stop-loss beyond the range.
❤️Sending you lots of Love and Hugs❤️

Silver’s short-term momentum is slowing down...Silver’s short-term momentum is slowing down...
Will it have enough juice to crack $40 before August?
🍿🍿🍿
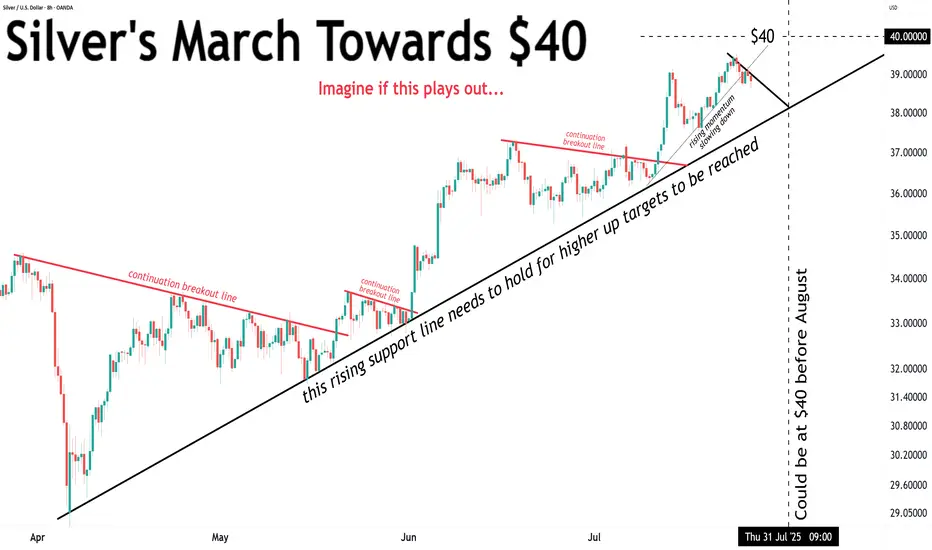
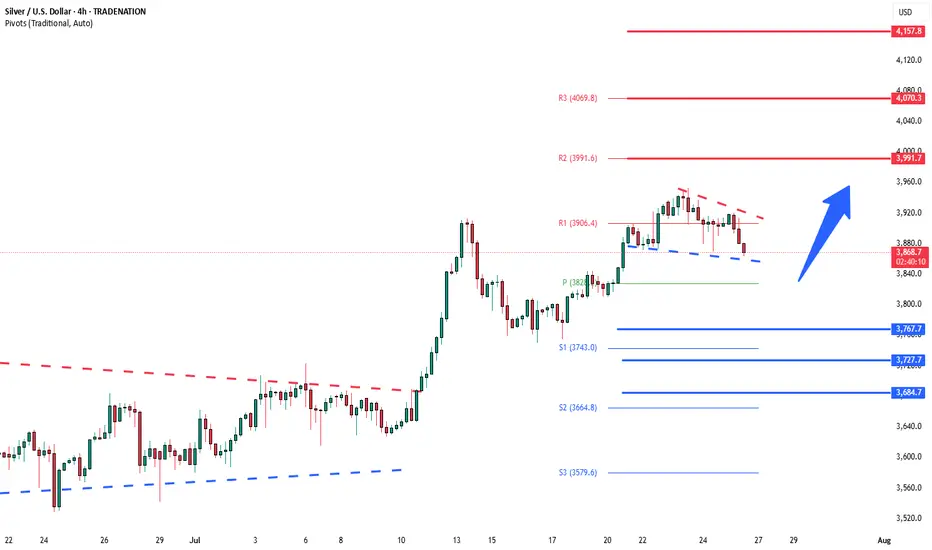
Silver bullish sideways consolidation The Silver remains in a bullish trend, with recent price action showing signs of a continuation breakout within the broader uptrend.
Support Zone: 3686 – a key level from previous consolidation. Price is currently testing or approaching this level.
A bullish rebound from 3686 would confirm ongoing upside momentum, with potential targets at:
3814 – initial resistance
3865 – psychological and structural level
3920 – extended resistance on the longer-term chart
Bearish Scenario:
A confirmed break and daily close below 3686 would weaken the bullish outlook and suggest deeper downside risk toward:
3645 – minor support
3590 – stronger support and potential demand zone
Outlook:
Bullish bias remains intact while the Silver holds above 3686. A sustained break below this level could shift momentum to the downside in the short term.
This communication is for informational purposes only and should not be viewed as any form of recommendation as to a particular course of action or as investment advice. It is not intended as an offer or solicitation for the purchase or sale of any financial instrument or as an official confirmation of any transaction. Opinions, estimates and assumptions expressed herein are made as of the date of this communication and are subject to change without notice. This communication has been prepared based upon information, including market prices, data and other information, believed to be reliable; however, Trade Nation does not warrant its completeness or accuracy. All market prices and market data contained in or attached to this communication are indicative and subject to change without notice.
SILVER Analysis - Can buyers push toward 4,100$?TRADENATION:XAGUSD is trading within a clear ascending channel, with price action consistently respecting both the upper and lower boundaries. The recent bullish momentum indicates that buyers are in control, suggesting there's chances for potential continuation on the upside.
The price has recently broken above a key resistance zone and now came back for a retest. If this level holds as support, it would reinforce the bullish structure and increase the likelihood of a move toward the 4,100 target, which aligns with the channel’s upper boundary.
As long as the price remains above this support zone, the bullish outlook stays intact. However, a failure to hold above this level could invalidate the bullish scenario and increase the likelihood of a deeper pullback.
Remember, always confirm your setups and use proper risk management.
Disclosure: I am part of Trade Nation's Influencer program and receive a monthly fee for using their TradingView charts in my analysis.

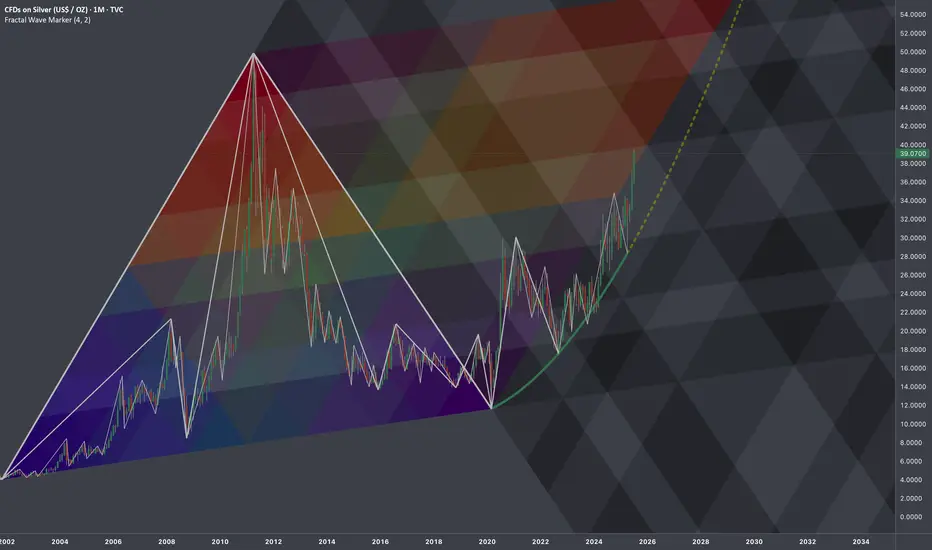
$SILVER: Fractal Geometry (Cycle 2001-2020)Research Notes
Working out probabilistic texture using multiple fibonacci channels on just 3 coordinates of fractal cycle (late 2001 - 2020) on linear scale (on log chart it would still be relevant, so you can switch to view with right click on price scale for selection).
To describe behavior of price and key levels on smaller scale starting from covid we'll use
L-H-L:
Using coordinates to express surface area of broken cycle with fibs mimicking rise, fall and side mapping cycle:
I'd look for patterns of bullish exhaustion only after price crosses the curve.
SILVER Retest of Cup and Handle Neckline📈 XAGUSD Trade Idea – July 25, 2025
Timeframe: 4H
Instrument: Silver / USD (XAGUSD)
Direction: Bullish continuation
Entry Zone: $39.00 - $39.10
Current Price: $39.103
🔍 Technical Analysis:
Cup & Handle Pattern: A clean cup formation is visible from July 15–21, followed by a bullish breakout and minor handle-like retracement.
Retest in Progress: Price is retesting the breakout zone around $39.00, showing consolidation above a strong support structure.
Dynamic Support Confluence: Multiple EMAs (green/orange/red cloud) are acting as support, with recent bullish candles bouncing off the mid-band area.
TD Sequential: A new "7" count signals potential continuation of the trend if support holds.
Volume Gap Below: Clean inefficiency (thin volume) below $38.40–$38.00 which may act as a magnet in case of invalidation, but is also untested demand.
📌 Trade Setup:
Entry: Around $39.00–$39.10 on confirmed support hold
Stop Loss: Below $38.50 (beneath EMA and recent higher low)
Take Profit Zones:
TP1: $39.80 (recent swing high)
TP2: $40.60 (measured move from cup breakout)
TP3: $41.00 psychological round number

XAGUSD--SHORT--rejecting from upper side of channel
--potential downward movement towards horiantal line labeled as TP on the chart

SILVER: Bulls Are Winning! Long!
My dear friends,
Today we will analyse SILVER together☺️
The market is at an inflection zone and price has now reached an area around 39.025 where previous reversals or breakouts have occurred.And a price reaction that we are seeing on multiple timeframes here could signal the next move up so we can enter on confirmation, and target the next key level of 39.148.Stop-loss is recommended beyond the inflection zone.
❤️Sending you lots of Love and Hugs❤️
