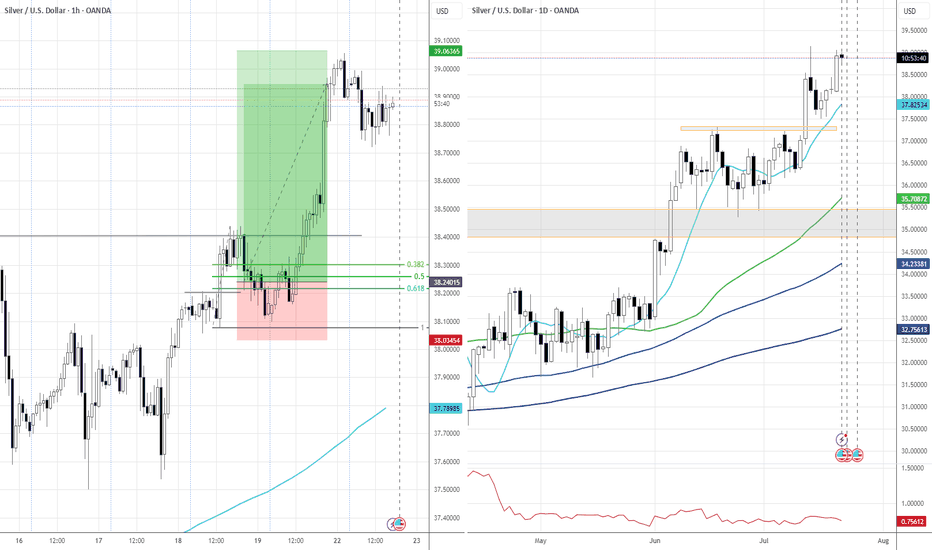
Market next move Original Analysis Recap:
Support Zone marked just below the current price.
Bearish Move Expected (red arrow) from current resistance.
Bullish Bounce Expected after initial drop (blue and yellow arrows).
Target is placed lower than current price, implying expected downward movement.
---
Disruption / Contrarian Thesis:
1. Fakeout to the Downside (Bear Trap)
The analysis assumes a rejection at resistance and a drop, but:
After the large red candle previously, the market may have absorbed all selling pressure.
Current consolidation shows higher lows—suggesting hidden buying.
Disruption Call: A quick dip below support (triggering stops), followed by a strong bullish reversal breaking through the resistance zone.
---
2. Volume Insight Ignored
Note that recent volume spiked on green candles during recovery.
Current retracement has lower volume, suggesting it may be a pause in uptrend (not a reversal).
Disruption Call: This is accumulation, not distribution. A breakout above 33.20 could happen, aiming for 33.40 or higher.
---
3. Structural Misinterpretation
The “support” identified may not be valid—it’s part of the consolidation range.
True demand zone could be deeper, around 32.90–33.00.
XAGUSD trade ideas
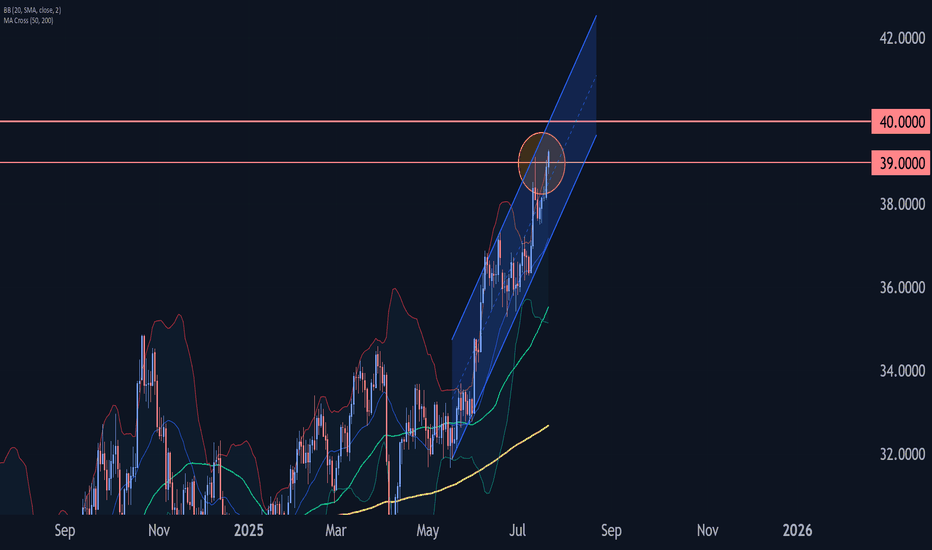
XAG/USD PIVOT AREA WITH BULLISH BIASSilver has been consolidating with bullish preference around the pivot area between 32.90 and 33.69.
A break above the the pivot area will bring prices of 36.01 and3 38.31 in focus, with far bigger targets north targeting ATH on the longterm .
However , failure to break above could send prices to 30.58
SILVERSilver Price, Bond Yield, and DXY Correlation in the Economy
Key Correlations
Silver and DXY (US Dollar Index): Inverse Relationship
Silver is priced in USD, so a stronger dollar (DXY↑) makes silver more expensive for foreign buyers, reducing demand and pressuring prices lower. Conversely, a weaker dollar (DXY↓) boosts silver’s affordability, increasing demand and prices.
Example: In early 2025, silver surged toward $32.60 as the DXY dropped to 99.50, highlighting this dynamic.
Silver and Bond Yields: Typically Inverse, But Context-Dependent
Higher bond yields (e.g., US 10-year Treasury) raise the opportunity cost of holding non-yielding silver, often pressuring prices downward.
Exception: During stagflation (high inflation + low growth) or geopolitical crises, silver and yields may rise together as investors seek inflation hedges.
Bond Yields and DXY: Positive Correlation
Rising US bond yields attract foreign capital, strengthening the dollar (DXY↑). This synergy often pressures silver prices via both channels.
Economic Applications
1. Monetary Policy and Inflation Dynamics
Fed Rate Hikes: Increase bond yields and often strengthen the dollar, creating dual headwinds for silver. However, if hikes fail to curb inflation, silver may rally as a hedge.
Quantitative Easing (QE): Expands money supply, weakening the dollar and supporting silver. For example, post-2008 QE drove silver to $50/oz by 2011.
2. Stagflation Scenarios
When inflation outpaces growth (e.g., 2024–2025), silver often outperforms despite rising yields. Investors prioritize its role as an inflation hedge over yield-driven opportunity costs.
3. Industrial Demand and Currency Volatility
Silver’s industrial use (e.g., solar panels, electronics) ties its price to economic growth. A weak dollar (DXY↓) can amplify demand from tech and green energy sectors, offsetting yield-driven declines.
4. Safe-Haven Flows
During geopolitical tensions (e.g., U.S.-China trade wars), silver and the dollar may both strengthen temporarily, disrupting their usual inverse correlation.
Strategic Implications
Factor Silver Price Impact Economic Signal
DXY ↑ + Yields ↑ Bearish Strong dollar, tight monetary policy
DXY ↓ + Yields ↓ Bullish Weak dollar, accommodative policy
DXY ↓ + Yields ↑ Mixed Stagflation or growth-inflation mix
Yield Peaks: Negatively divergent 10-year yields (~4.54% in May 2025) suggest impending declines, potentially boosting silver.
Debt-Driven Inflation: With U.S. debt-to-GDP exceeding 200%, monetary debasement fears support long-term silver demand despite short-term yield pressures.
Conclusion
The interplay between silver, bond yields, and the DXY provides critical insights into economic health and investor sentiment. While their correlations are often inverse, stagflation or systemic risks can override these trends, positioning silver as both a cyclical and structural hedge. Policymakers and traders monitor these relationships to navigate inflation, growth, and currency volatility.
#SILVER #DOLLAR #GOLD #FX #FOREX
Market falls downward
1. Resistance Zone May Be Weak
Observation: A red rectangle marks a resistance area.
Disruption: This "resistance" level is based on a short-term bounce and may not have strong historical confluence. It lacks multiple rejections to establish it as a true resistance zone.
---
2. Overemphasis on Bearish Bias
Observation: Two bearish paths (blue and yellow) dominate the projection, indicating an expected drop.
Disruption: This may be prematurely bearish. There's no confirmation of rejection yet—no strong bearish candlestick pattern (like a shooting star, engulfing, or evening star) is visible in that zone.
---
3. Lack of Bullish Consideration
Observation: A small green arrow is shown but not given much weight.
Disruption: The recent candles show higher lows, indicating potential bullish pressure. If price breaks above the marked zone, it may trigger a short squeeze rally.
---
4. Volume Misalignment
Observation: Volume spikes during the bounce, especially on the green candles.
Disruption: Rising volume on a recovery typically supports continuation upward. This analysis ignores the bullish volume context and instead forecasts reversal.
---
5. No Higher Timeframe Confluence
Observation: 1-hour chart used in isolation.
Disruption: A strong bearish or bullish direction on the 4H or Daily chart would validate or invalidate this local setup. Without it, the trade thesis lacks broader context.
SILVER: The Market Is Looking Up! Long!
My dear friends,
Today we will analyse SILVER together☺️
The market is at an inflection zone and price has now reached an area around 32.882 where previous reversals or breakouts have occurred.And a price reaction that we are seeing on multiple timeframes here could signal the next move up so we can enter on confirmation, and target the next key level of 33.317.Stop-loss is recommended beyond the inflection zone.
❤️Sending you lots of Love and Hugs❤️
Rising Wedge Breakdown – Bearish Setup on Silver (XAGUSD)Silver (XAG/USD) is currently trading within a bearish rising wedge formation on the 8-hour timeframe, and the market structure is hinting at a potential reversal to the downside. The confluence of resistance zones, pattern anatomy, and historical price action all point to a high-probability short setup, especially if key support levels are breached.
📈 Pattern Analysis: Rising Wedge
A rising wedge is typically a bearish chart pattern that forms when price consolidates between two upward sloping trendlines. However, the upper trendline rises at a slower pace than the lower one—indicating decelerating bullish strength. It often precedes a bearish breakout, especially if volume decreases near the apex.
In this case, the wedge is forming just below a major resistance zone around the $34.00 area, adding weight to the bearish scenario.
🔹 Key Technical Levels :
🟥 Resistance Zone ($33.80–$34.80): Price has tested and rejected this area multiple times in recent weeks. It marks a clear liquidity zone where sellers are in control.
🟩 Support Zone ($29.50–$30.30): This zone has provided strong support in previous retracements. If broken, it may flip into resistance upon retest.
🟦 Retest Zone (~$31.00–$31.50): If the wedge breaks downward, price may retest this area—creating an opportunity for traders to enter short with better risk-reward.
🎯 Final Bearish Target : $26.85: This level is derived from the height of the wedge and prior demand zones, making it a strong target area in a fully played-out bearish move.
🧠 Market Structure & Sentiment:
Volume Analysis – Volume has been tapering off as the price squeezes within the wedge, which is a typical trait of rising wedges. A volume spike on breakdown would serve as confirmation.
Trend Analysis – While the overall trend in the medium term has been bullish, the weakening upward momentum suggests that buyers are losing strength, and sellers may regain control soon.
Rejection Candle s – Several recent candle wicks above the $33.50 zone show clear rejection and failure to close above, reinforcing the resistance level.
📊 Trade Plan (Educational Purposes Only):
Criteria Details
Bias Bearish (Rising Wedge Breakdown)
Entry Option 1 On breakdown of wedge + retest
Entry Option 2 Aggressive entry on breakdown candle close below $31.50
Stop Loss Above $33.80 (last resistance)
Take Profit 1 $30.00 (support zone)
Take Profit 2 $28.00 (partial exit)
Take Profit 3 $26.85 (final target)
📌 Trading Psychology Note:
Traders should remain patient and avoid entering prematurely. Let the pattern confirm itself with a clean break and retest. Risk management is critical—wedge patterns can also fake out before reversing hard.
🧾 Summary:
Silver is nearing the end of a rising wedge pattern, right under a heavy resistance zone. Historical behavior, weakening momentum, and classic wedge structure suggest a potential bearish reversal. A break below the wedge support and a retest around $31.00 could present a high-probability short trade setup targeting the $26.85 area.
Keep this chart on watch. A decisive move is likely coming soon.
Silver Rises to $32.60 on Safe-Haven DemandSilver (XAG/USD) climbed to around $32.60 per ounce on Thursday during Asian trading, recording its third consecutive gain as safe-haven demand increased amid rising U.S. fiscal concerns and global tensions.
Moody’s recent downgrade of the U.S. credit rating to Aa1, citing growing debt and deficits, added pressure on the Dollar. Ongoing unrest in the Middle East and Israel’s military actions in Gaza also supported precious metal prices. Meanwhile, Ukraine is preparing to urge the EU next week to seize Russian assets and target oil buyers, as U.S. sanctions appear to be losing momentum.
The first critical support for Silver is seen at 33.80, and the first resistance is located at 32.30.
Silver H4 | Potential bearish reversalSilver (XAG/USD) is trading close to an overlap resistance and could potentially reverse off this level to drop lower.
Sell entry is at 33.62 which is an overlap resistance.
Stop loss is at 34.70 which is a level that sits above a swing-high resistance.
Take profit is at 31.76 which is a multi-swing-low support.
Disclaimer
High Risk Investment Warning
Trading Forex/CFDs on margin carries a high level of risk and may not be suitable for all investors. Leverage can work against you.
Stratos Markets Limited (tradu.com ):
CFDs are complex instruments and come with a high risk of losing money rapidly due to leverage. 63% of retail investor accounts lose money when trading CFDs with this provider. You should consider whether you understand how CFDs work and whether you can afford to take the high risk of losing your money.
Stratos Europe Ltd (tradu.com ):
CFDs are complex instruments and come with a high risk of losing money rapidly due to leverage. 63% of retail investor accounts lose money when trading CFDs with this provider. You should consider whether you understand how CFDs work and whether you can afford to take the high risk of losing your money.
Stratos Global LLC (tradu.com ):
Losses can exceed deposits.
Please be advised that the information presented on TradingView is provided to Tradu (‘Company’, ‘we’) by a third-party provider (‘TFA Global Pte Ltd’). Please be reminded that you are solely responsible for the trading decisions on your account. There is a very high degree of risk involved in trading. Any information and/or content is intended entirely for research, educational and informational purposes only and does not constitute investment or consultation advice or investment strategy. The information is not tailored to the investment needs of any specific person and therefore does not involve a consideration of any of the investment objectives, financial situation or needs of any viewer that may receive it. Kindly also note that past performance is not a reliable indicator of future results. Actual results may differ materially from those anticipated in forward-looking or past performance statements. We assume no liability as to the accuracy or completeness of any of the information and/or content provided herein and the Company cannot be held responsible for any omission, mistake nor for any loss or damage including without limitation to any loss of profit which may arise from reliance on any information supplied by TFA Global Pte Ltd.
The speaker(s) is neither an employee, agent nor representative of Tradu and is therefore acting independently. The opinions given are their own, constitute general market commentary, and do not constitute the opinion or advice of Tradu or any form of personal or investment advice. Tradu neither endorses nor guarantees offerings of third-party speakers, nor is Tradu responsible for the content, veracity or opinions of third-party speakers, presenters or participants.
Market next target Disruption: Bullish Counter-Analysis
1. Trend Structure:
Despite the local rejection, the overall price trend has been bullish (higher highs and higher lows).
The pullback may just be a healthy retracement, not a reversal.
2. Volume Perspective:
Volume has increased on bullish candles before the resistance test — showing buyer interest.
No significant bearish volume spike to confirm a strong reversal.
3. False Breakdown Trap:
The setup might be a bear trap — a false break below minor support to trap shorts before a bounce higher.
4. Support Holds Strong:
The identified "Support" zone could act as a launch point for a bullish continuation.
If price forms a bullish engulfing or a pin bar in that area, it could invalidate the bearish thesis.
5. Macro Impact (FOMC/U.S. data nearby):
U.S. event (flag at bottom) might bring volatility.
If news is USD-negative, Silver may spike upwards regardless of technical patterns.
Bullish momentum to extend?The Silver (XAG/USD) has reacted off the pivot and could rise to the 1st resistance which is a pullback resistance.
Pivot: 33.07
1st Support: 32.64
1st Resistance: 34.48
Risk Warning:
Trading Forex and CFDs carries a high level of risk to your capital and you should only trade with money you can afford to lose. Trading Forex and CFDs may not be suitable for all investors, so please ensure that you fully understand the risks involved and seek independent advice if necessary.
Disclaimer:
The above opinions given constitute general market commentary, and do not constitute the opinion or advice of IC Markets or any form of personal or investment advice.
Any opinions, news, research, analyses, prices, other information, or links to third-party sites contained on this website are provided on an "as-is" basis, are intended only to be informative, is not an advice nor a recommendation, nor research, or a record of our trading prices, or an offer of, or solicitation for a transaction in any financial instrument and thus should not be treated as such. The information provided does not involve any specific investment objectives, financial situation and needs of any specific person who may receive it. Please be aware, that past performance is not a reliable indicator of future performance and/or results. Past Performance or Forward-looking scenarios based upon the reasonable beliefs of the third-party provider are not a guarantee of future performance. Actual results may differ materially from those anticipated in forward-looking or past performance statements. IC Markets makes no representation or warranty and assumes no liability as to the accuracy or completeness of the information provided, nor any loss arising from any investment based on a recommendation, forecast or any information supplied by any third-party.
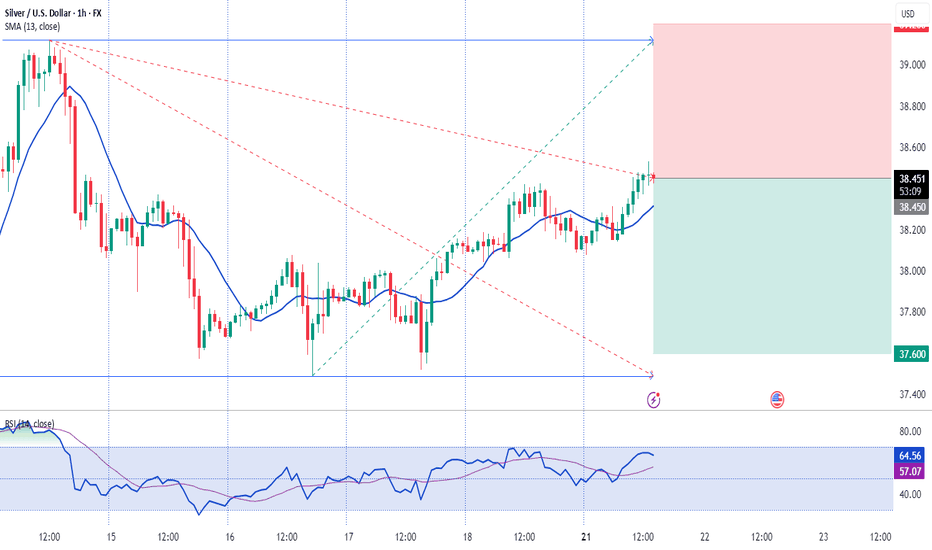
Market next move . Breakout Exhaustion (Fakeout Risk)
The price has just broken out of the consolidation box.
However, volume is not significantly surging—a true breakout is often confirmed with strong volume.
A fake breakout could lead to a sharp reversal back into the box.
---
2. Overbought Conditions
Given the sharp rally leading into the consolidation, indicators like RSI are likely in overbought territory.
Price may need to cool off before any sustainable move higher.
This could trigger a pullback to retest the support around 33.10–33.20.
---
3. Rising Wedge Formation Potential
If the uptrend continues with narrowing price action, it could form a rising wedge—a bearish reversal pattern.
This might lead to a drop toward $33.00 or lower.
---
4. Strong Resistance Around $34.00
Psychological and historical resistance at the $34.00 level could halt or reverse upward movement.
It might trigger profit-taking or short-selling pressure.
---
5. Macro Catalyst Risk
With the U.S. news symbol shown (likely an upcoming economic release), the bullish structure could quickly be invalidated.
A hawkish Fed or strong U.S. data may pressure silver lower due to USD strength or rising yields.
SILVER Short From Resistance! Sell!
Hello,Traders!
SILVER keeps growing but
Its much slower than Gold
And the price is about to hit
A horizontal resistance level
Of 33.67$ from where we
Will be expecting a local
Pullback and a bearish correction
Sell!
Comment and subscribe to help us grow!
Check out other forecasts below too!
Disclosure: I am part of Trade Nation's Influencer program and receive a monthly fee for using their TradingView charts in my analysis.
SILVERSilver and US Dollar Correlation
Inverse Relationship
Silver and the US dollar (measured by the DXY index) have a strong inverse correlation. When the US dollar weakens, silver prices typically rise, and when the dollar strengthens, silver prices tend to fall. This relationship is rooted in silver being priced in dollars globally:
A stronger dollar makes silver more expensive for buyers using other currencies, reducing demand and putting downward pressure on prices.
A weaker dollar makes silver cheaper for foreign investors, boosting demand and driving prices higher.
Key Technical Levels: A breakdown below critical DXY levels (like 99.50) is often seen as a trigger for rapid dollar devaluation, which can spark explosive upward moves in silver prices.
Safe-Haven Demand: Geopolitical tensions or economic uncertainty can also drive demand for silver as a safe-haven asset, sometimes amplifying the inverse correlation with the dollar.
Other Influences: While the inverse correlation is strong, silver prices are also affected by factors such as interest rates, inflation, industrial demand, and mining supply. At times, these factors can override the dollar’s influence, especially in the short term.
Historical and Statistical Context
Quarterly and annual data consistently show a negative correlation coefficient between silver and the DXY, though the strength of this correlation can vary depending on broader market conditions.
For example, in 2020, as the DXY fell, silver prices rose sharply; the opposite occurred in 2022 when the dollar strengthened.
Summary Table
Dollar Trend Silver Price Impact
Dollar strengthens Silver usually falls
Dollar weakens Silver usually rises
In summary:
Silver prices generally move opposite to the US dollar. This inverse correlation is fundamental to the silver market and is closely watched by traders and investors. However, other macroeconomic and market-specific factors can sometimes temporarily weaken or override this relationship.
SILVERSilver and US Dollar Correlation
Inverse Relationship
Silver and the US dollar (measured by the DXY index) have a strong inverse correlation. When the US dollar weakens, silver prices typically rise, and when the dollar strengthens, silver prices tend to fall. This relationship is rooted in silver being priced in dollars globally:
A stronger dollar makes silver more expensive for buyers using other currencies, reducing demand and putting downward pressure on prices.
A weaker dollar makes silver cheaper for foreign investors, boosting demand and driving prices higher.
Technical and Fundamental Factors
Key Technical Levels: A breakdown below critical DXY levels (like 99.50) is often seen as a trigger for rapid dollar devaluation, which can spark explosive upward moves in silver prices.
Safe-Haven Demand: Geopolitical tensions or economic uncertainty can also drive demand for silver as a safe-haven asset, sometimes amplifying the inverse correlation with the dollar.
Other Influences: While the inverse correlation is strong, silver prices are also affected by factors such as interest rates, inflation, industrial demand, and mining supply. At times, these factors can override the dollar’s influence, especially in the short term.
Historical and Statistical Context
Quarterly and annual data consistently show a negative correlation coefficient between silver and the DXY, though the strength of this correlation can vary depending on broader market conditions.
Summary Table
Dollar Trend Silver Price Impact
Dollar strengthens Silver usually falls
Dollar weakens Silver usually rises
In summary:
Silver prices generally move opposite to the US dollar. This inverse correlation is fundamental to the silver market and is closely watched by traders and investors. However, other macroeconomic and market-specific factors can sometimes temporarily weaken or override this relationship.
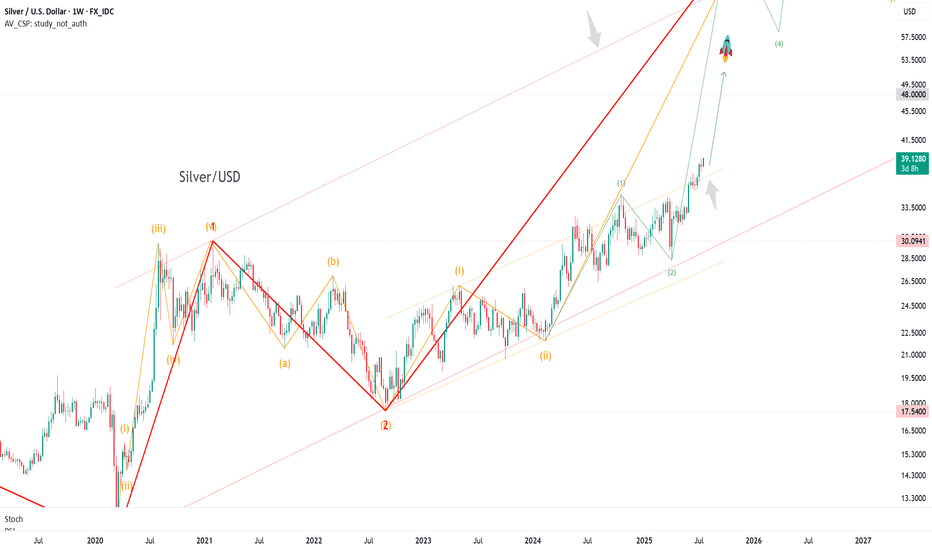
Riding the Industrial RallySilver is making another attempt to break through the local high at 33.25.
If it breaks out, I’ll be adding to my long position.
For those not yet in the trade, this breakout could present a good opportunity to enter a long with limited risk. In that case, it's best to place a stop just below today’s low.
SILVER: The Market Is Looking Down! Short!
My dear friends,
Today we will analyse SILVER together☺️
The in-trend continuation seems likely as the current long-term trend appears to be strong, and price is holding below a key level of 33.222 So a bearish continuation seems plausible, targeting the next low. We should enter on confirmation, and place a stop-loss beyond the recent swing level.
❤️Sending you lots of Love and Hugs❤️
SILVER Will Go Higher! Long!
Take a look at our analysis for SILVER.
Time Frame: 4h
Current Trend: Bullish
Sentiment: Oversold (based on 7-period RSI)
Forecast: Bullish
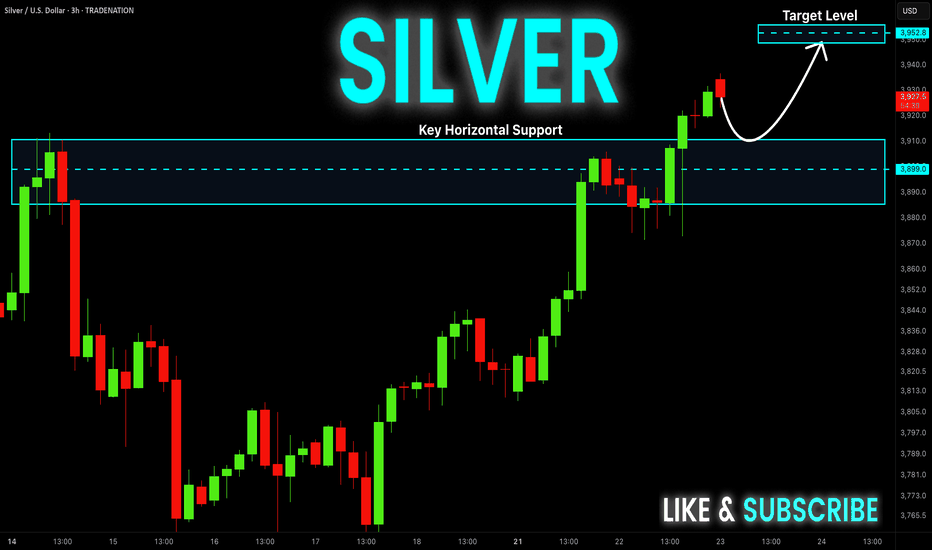
The market is on a crucial zone of demand 3,314.0.
The oversold market condition in a combination with key structure gives us a relatively strong bullish signal with goal 3,380.1 level.
P.S
Overbought describes a period of time where there has been a significant and consistent upward move in price over a period of time without much pullback.
Disclosure: I am part of Trade Nation's Influencer program and receive a monthly fee for using their TradingView charts in my analysis.
Like and subscribe and comment my ideas if you enjoy them!