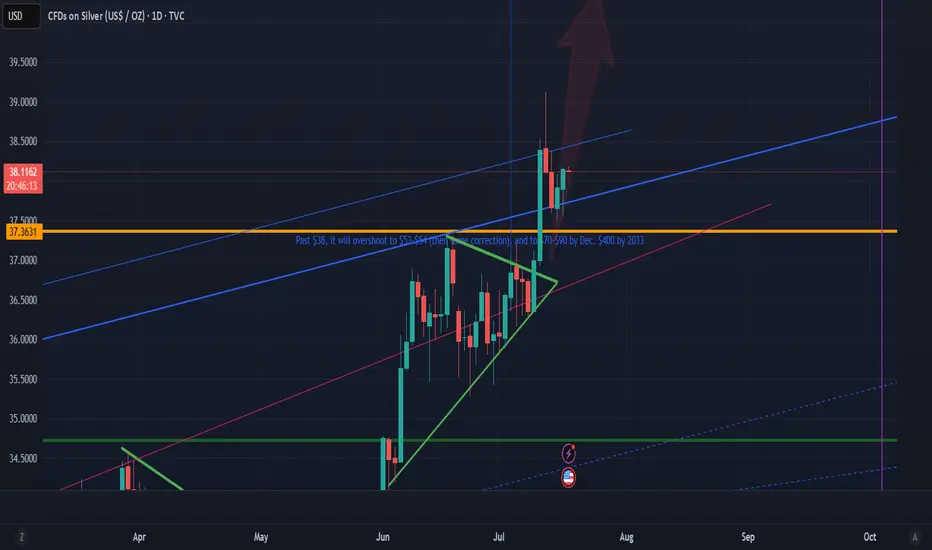
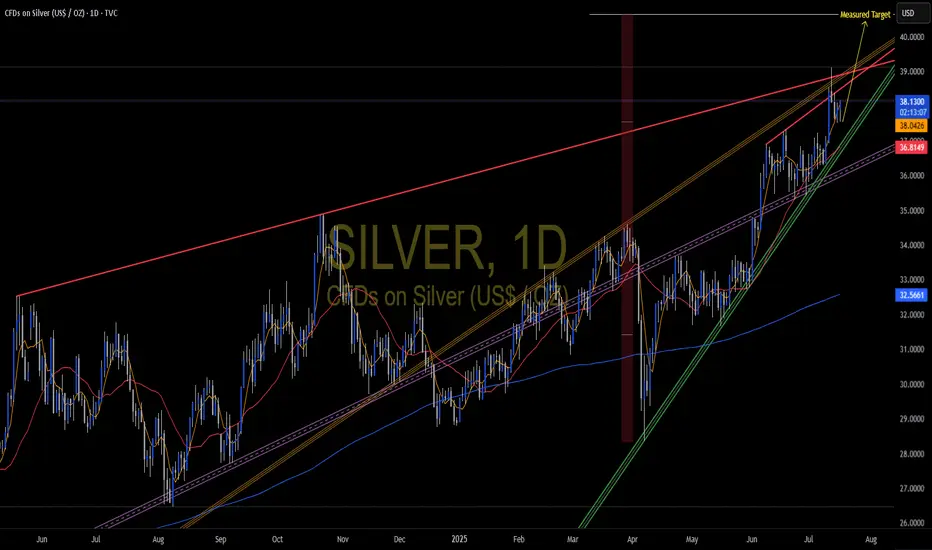
Vertical spike to blow past 50 is imminent Vertical spike to blow past 50 is imminent. It may not stop maybe until $70. Banks is running out of SLV stocks to short silver. Get ready.... This moment will never happen again. Position position NOW.
XAGUSD trade ideas
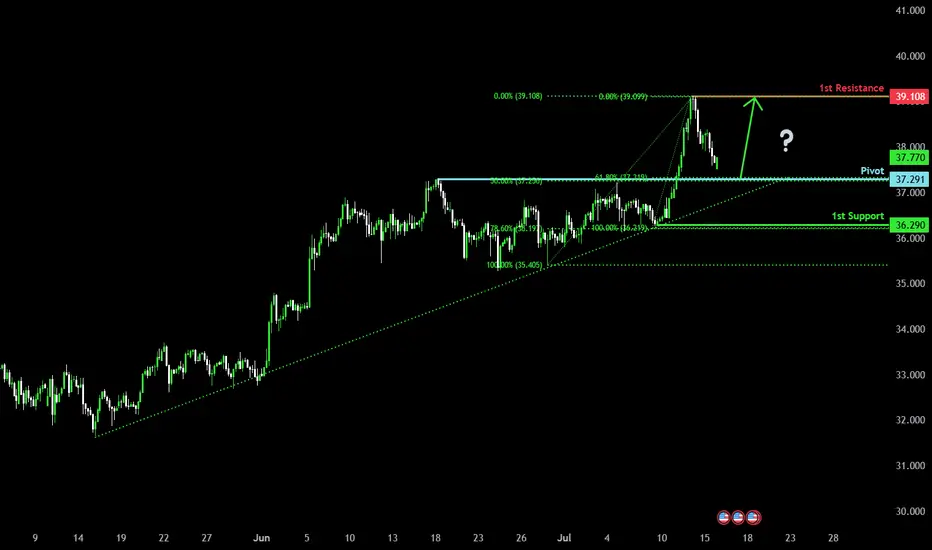
Bullish continuation?The Silver (XAG/USD) is falling towards the pivot and could bounce to the 1st resistance which has been identified as a pullback resistance.
pivot: 37.29
1st Support: 36.29
1st Resistance: 39.10
Risk Warning:
Trading Forex and CFDs carries a high level of risk to your capital and you should only trade with money you can afford to lose. Trading Forex and CFDs may not be suitable for all investors, so please ensure that you fully understand the risks involved and seek independent advice if necessary.
Disclaimer:
The above opinions given constitute general market commentary, and do not constitute the opinion or advice of IC Markets or any form of personal or investment advice.
Any opinions, news, research, analyses, prices, other information, or links to third-party sites contained on this website are provided on an "as-is" basis, are intended only to be informative, is not an advice nor a recommendation, nor research, or a record of our trading prices, or an offer of, or solicitation for a transaction in any financial instrument and thus should not be treated as such. The information provided does not involve any specific investment objectives, financial situation and needs of any specific person who may receive it. Please be aware, that past performance is not a reliable indicator of future performance and/or results. Past Performance or Forward-looking scenarios based upon the reasonable beliefs of the third-party provider are not a guarantee of future performance. Actual results may differ materially from those anticipated in forward-looking or past performance statements. IC Markets makes no representation or warranty and assumes no liability as to the accuracy or completeness of the information provided, nor any loss arising from any investment based on a recommendation, forecast or any information supplied by any third-party.
Silver (XAGUSD) – Watch for Bullish Reaction at Key Liquidity ZoDescription:
Silver is now approaching a key liquidity and structural support zone between 37.2805 and 36.8841 (marked by the bottom two blue lines on the chart). This area is likely to attract significant attention, with the potential for stop-losses of buyers below the prior structure to be triggered—a classic liquidity grab scenario.
Trading Idea:
Do NOT enter blindly at these levels.
Wait for price to dip into the 37.28–36.88 range, ideally triggering a liquidity sweep and a spike in volume.
Only consider a long entry after a clear bullish reaction in this zone—such as a strong reversal candle, a bullish engulfing, or a pronounced uptick in net volume.
For extra confirmation, look for a retest of the zone after the first reaction, to confirm that the level is holding as support.
Risk Management:
Stop-loss below the lower end of the entry zone (under 36.88) or the liquidity sweep low.
Target the next resistance levels: 37.88, 38.40, and 38.99–39.00.
Key Points:
The 37.28–36.88 area is a liquidity zone—expect increased volatility and potential for fake-outs.
Wait for confirmation and ideally a retest before considering entry.
Ignore the entry zone if price simply breaks through without a bullish reaction.
Summary:
Let price sweep liquidity and show its hand in the 37.28–36.88 zone. Only enter on clear bullish confirmation and a solid retest. Trade what you see, not what you hope for!

The AI Boom's Unsung HeroThe rise of artificial intelligence isn’t just shaking up tech companies it’s quietly transforming the global silver market in a big way. As major players like NVIDIA, Google and others ramp up their AI infrastructure silver is becoming more critical than ever. Why? Because silver, thanks to its unmatched electrical conductivity, plays a key role in powering the hardware behind AI.
Silver is the most conductive metal on Earth. That makes it perfect for high-performance computing something AI needs a lot of. It’s especially important in data centers and advanced semiconductors, where both electrical and thermal performance are mission-critical.
What’s really interesting is that AI servers tend to use two to three times more silver than traditional data center servers. That’s because AI workloads are more power-hungry, generate more heat and require more complex cooling and electrical systems. Simply put, more AI means more silver.
If there’s one company at the heart of this trend it’s NVIDIA. Analysts at Morgan Stanley expect NVIDIA to consume a staggering 77% of all silicon wafers used for AI accelerators in 2025 up from 51% in 2024. That adds up to around 535,000 300-mm wafers a year each of which contains silver in key components.
All of this AI growth is showing up in the numbers. Industrial silver demand hit an all-time high of 680.5 million ounces in 2024. The electronics industry alone uses around 250 million ounces per year and AI is now the fastest-growing part of that.
Despite all this demand, silver supply just isn’t keeping up. The market’s been in deficit for four straight years, with a total shortfall of 678 million ounces between 2021 and 2024. That’s roughly ten months of global mine output gone missing from the balance sheet.
It’s no surprise, then, that silver prices have been climbing fast. As of July 2025 silver’s up nearly 30% for the year. Looking further ahead I see room for silver to keep climbing:
In the short term (2025): $36–$42 per ounce seems realistic
By 2026: Potential for $50+ as more AI growth stays strong
AI isn’t just changing how we work, communicate, or compute—it’s literally reshaping the commodities that make this technology possible. Silver, once thought of mainly in the context of jewelry or coins, is now a backbone material for the AI revolution.

Silver Holds Ground on Fed Inflation WarningsSilver is hovering near $38 during Thursday’s Asian session as markets digest U.S.-EU trade developments and Fed inflation commentary.
President Trump said deals with the EU and India are within reach, softening immediate trade fears. Still, the potential August 1 tariffs and inflationary risks continue to support silver’s appeal as a safe-haven asset.
Fed officials Williams and Bostic noted that although tariff impacts are modest now, they expect rising inflationary pressure in the coming months.
Resistance is at 38.50, while support holds at 37.20.
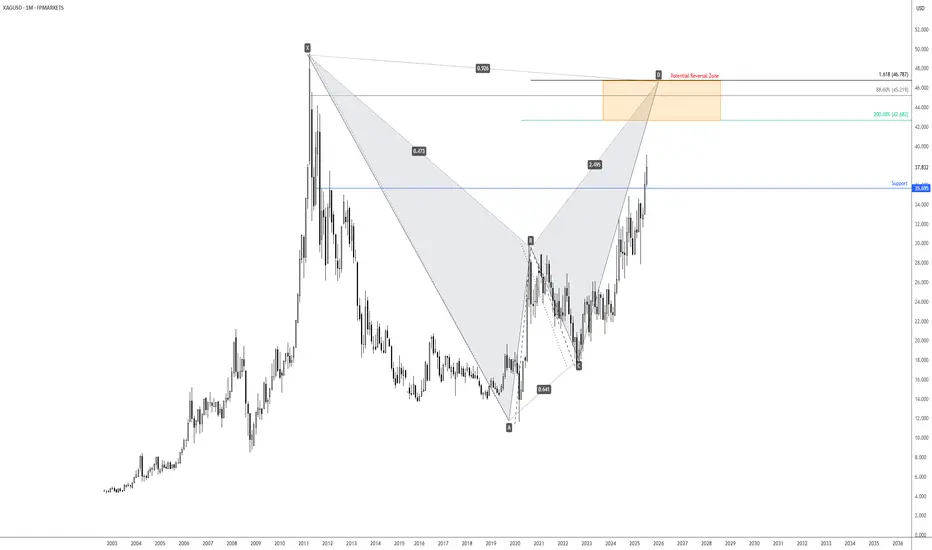
Long-term bearish bat pattern on SilverLonger-term price action on the price of Spot Silver (XAG/USD) is on track to shake hands with a Potential Reversal Zone (PRZ) of a monthly bat pattern between US$46.79 and US$42.68. What this also tells Silver traders is that according to this pattern’s structure, there is scope for additional outperformance. As a result, I am closely monitoring monthly support from US$35.70 in the event of a pullback unfolding.
Written by FP Markets Chief Market Analyst Aaron Hill
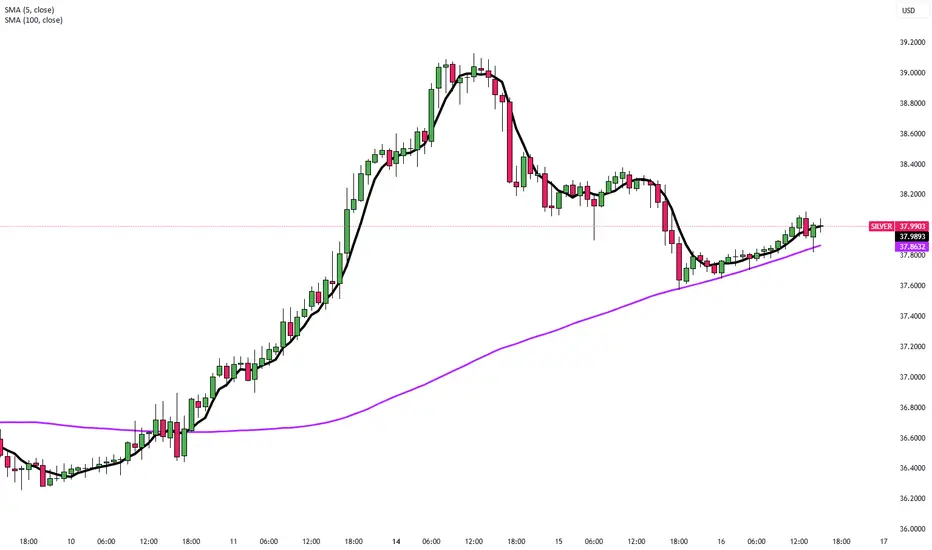
SILVER: Local Bearish Bias! Short!
My dear friends,
Today we will analyse SILVER together☺️
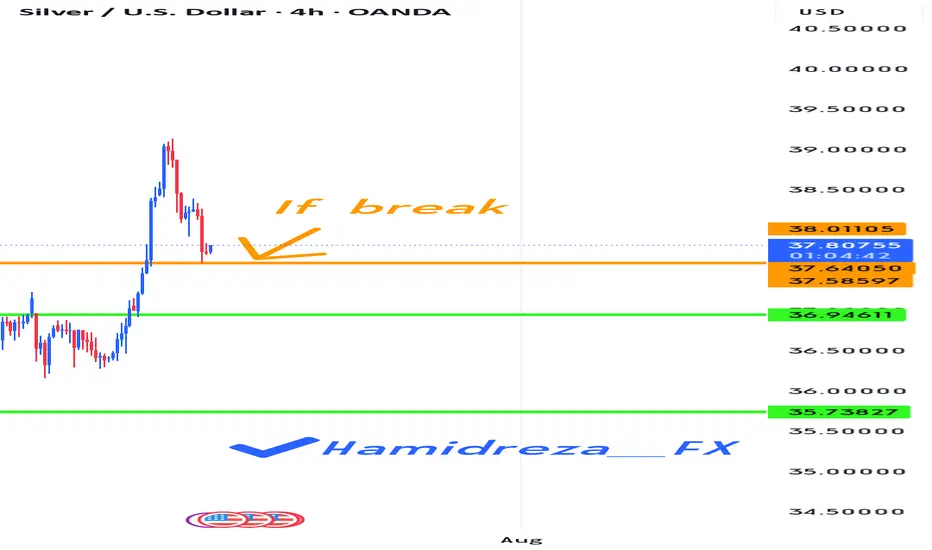
The market is at an inflection zone and price has now reached an area around 37.832 where previous reversals or breakouts have occurred.And a price reaction that we are seeing on multiple timeframes here could signal the next move down so we can enter on confirmation, and target the next key level of 37.762..Stop-loss is recommended beyond the inflection zone.
❤️Sending you lots of Love and Hugs❤️
Silver H4 | Falling toward a pullback supportSilver (XAG/USD) is falling towards a pullback support and could potentially bounce off this level to climb higher.
Buy entry is at 37.27 which is a pullback support that aligns with the 50% Fibonacci retracement.
Stop loss is at 36.60 which is a level that lies underneath a pullback support and the 61.8% Fibonacci retracement.
Take profit is at 38.31 which is a swing-high resistance.
High Risk Investment Warning
Trading Forex/CFDs on margin carries a high level of risk and may not be suitable for all investors. Leverage can work against you.
Stratos Markets Limited (tradu.com ):
CFDs are complex instruments and come with a high risk of losing money rapidly due to leverage. 66% of retail investor accounts lose money when trading CFDs with this provider. You should consider whether you understand how CFDs work and whether you can afford to take the high risk of losing your money.
Stratos Europe Ltd (tradu.com ):
CFDs are complex instruments and come with a high risk of losing money rapidly due to leverage. 66% of retail investor accounts lose money when trading CFDs with this provider. You should consider whether you understand how CFDs work and whether you can afford to take the high risk of losing your money.
Stratos Global LLC (tradu.com ):
Losses can exceed deposits.
Please be advised that the information presented on TradingView is provided to Tradu (‘Company’, ‘we’) by a third-party provider (‘TFA Global Pte Ltd’). Please be reminded that you are solely responsible for the trading decisions on your account. There is a very high degree of risk involved in trading. Any information and/or content is intended entirely for research, educational and informational purposes only and does not constitute investment or consultation advice or investment strategy. The information is not tailored to the investment needs of any specific person and therefore does not involve a consideration of any of the investment objectives, financial situation or needs of any viewer that may receive it. Kindly also note that past performance is not a reliable indicator of future results. Actual results may differ materially from those anticipated in forward-looking or past performance statements. We assume no liability as to the accuracy or completeness of any of the information and/or content provided herein and the Company cannot be held responsible for any omission, mistake nor for any loss or damage including without limitation to any loss of profit which may arise from reliance on any information supplied by TFA Global Pte Ltd.
The speaker(s) is neither an employee, agent nor representative of Tradu and is therefore acting independently. The opinions given are their own, constitute general market commentary, and do not constitute the opinion or advice of Tradu or any form of personal or investment advice. Tradu neither endorses nor guarantees offerings of third-party speakers, nor is Tradu responsible for the content, veracity or opinions of third-party speakers, presenters or participants.

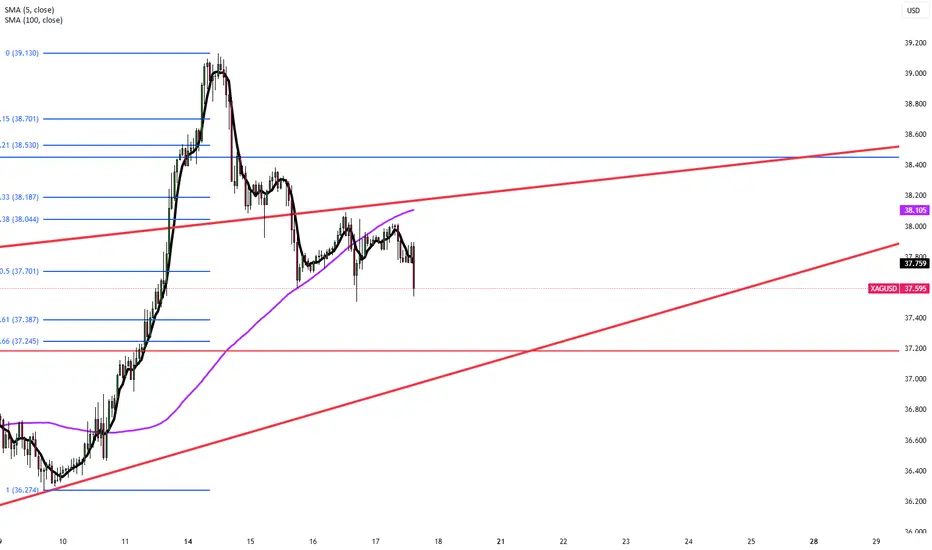
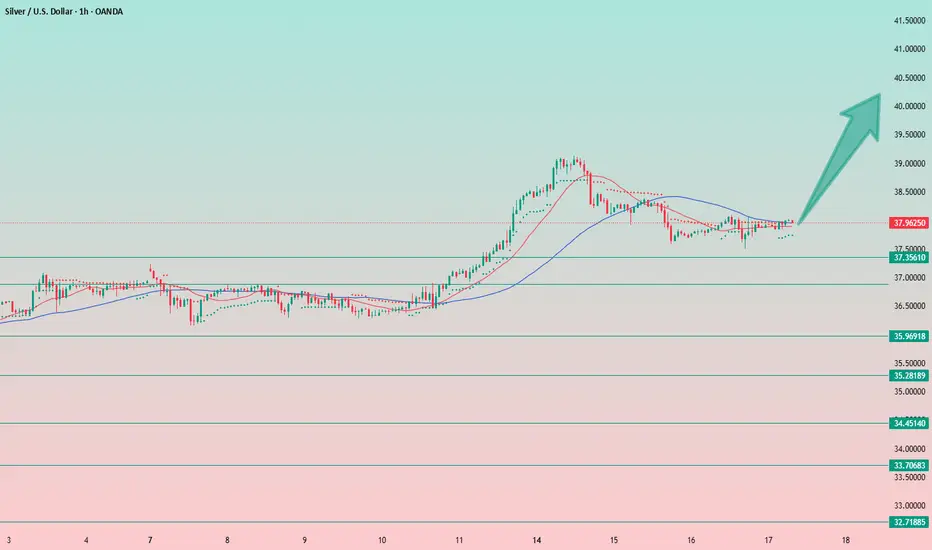
Silver: Bullish Setup from Accumulation ZoneSilver touched its support level at $37.50 and quickly bounced back into the accumulation zone.
From the current levels, I expect an upward breakout. The setup looks very bullish.
I'm going long from the current price of $38. Stop-loss is placed just below the local low at $37.50. A break below $37.50 would signal further downside toward the next strong support around $36.75–$37, where I’d reassess the long opportunity. But honestly, I see this scenario as unlikely.
Targets are all the round numbers: $40, $41, and so on (classic—markets are psychological, and people tend to focus on clean, round numbers). Additional targets include $43.50 and $48.25, which align with levels from 2011–2012.
And look at how harmonious the chart looks.
Volatility is decreasing, the entire structure is stretching out on the hourly timeframe.
We're seeing accumulation followed by an expected breakout, and based on all external factors, an upward move seems likely.
📝Trading Plan
Entry: Entry at current prices and in the 37.75–38.25 range — the long position remains valid.
In fact, the long setup remains valid even at slightly higher levels (but not below), although the stop-loss starts to widen and exceeds 2%. If you're okay with that, then it's still a viable long opportunity.
Stop Loss: Below yesterday's low at $37.50
Target: The first target is $40, and the global target is $ 48.25.
However, it's unlikely we'll reach that level in one move — there will likely be re-entries along the way.
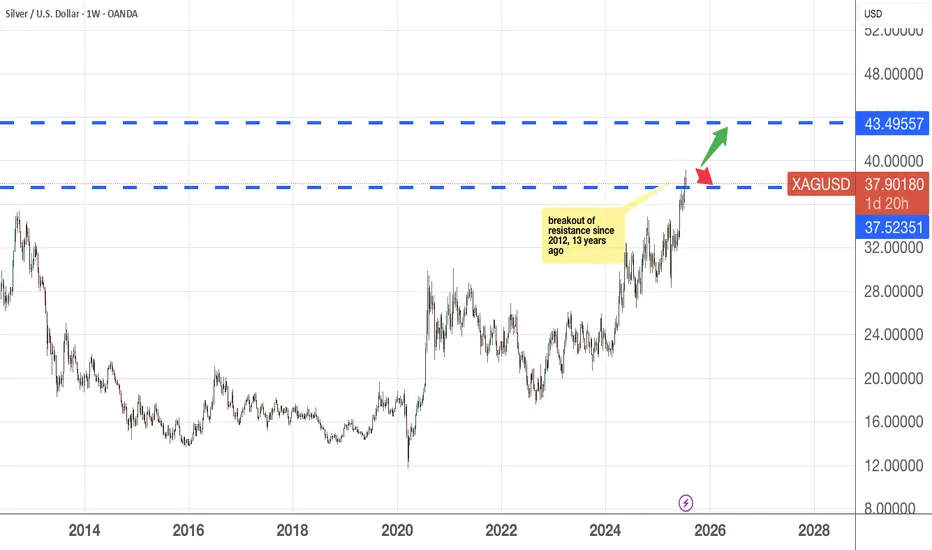
Silver lining in Silver If you bought silver 13 years ago, you would probably break even minus the inflation costs that you have to bear. Now, if this trend continues, that is it stays above the 37.52 mark and remains bullish, then the next resistance it will revisit will be 43.49.
Do set aside 5-10% of your capital into Gold and/or Silver , this would be a good hedge in the coming months/years.
As usual, please DYODD
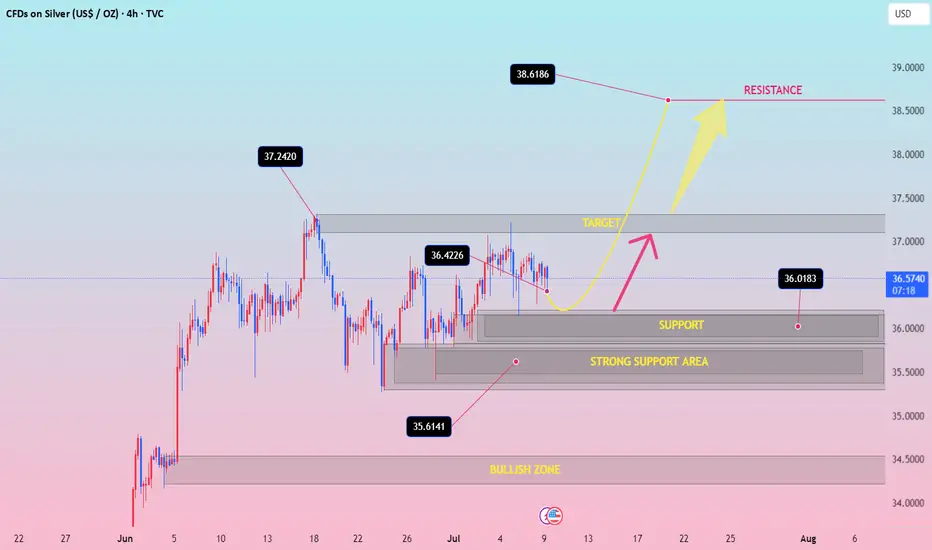
XAGUSD(SILVER):To $60 the silver is new gold, most undervaluedSilver has shown remarkable bullish behaviour and momentum, in contrast to gold’s recent decline. Despite recent news, silver remains bullish and unaffected by these developments. We anticipate that silver will reach a record high by the end of the year, potentially reaching $60.
There are compelling reasons why we believe silver will be more valuable in the coming years, if not months. Firstly, the current price of silver at 36.04 makes it the most cost-effective investment option compared to gold. This presents an attractive opportunity for retail traders, as gold may not be suitable for everyone due to its nature and price.
Silver’s price has increased from 28.47 to 36.25, indicating its potential to reach $60 in the near future. We strongly recommend conducting your own analysis before making any trading or investment decisions. Please note that this analysis is solely our opinion and does not guarantee the price or future prospects of silver.
We appreciate your positive feedback and comments, which encourage us to provide further analysis. Your continuous support over the years means a lot to us.
We wish you a pleasant weekend.
Best regards,
Team Setupsfx
XAGUSDXAG/USD is currently exhibiting an increasingly bearish net position from major institutional players. Given this positioning, a continued bearish outlook is anticipated for the upcoming week.
SILVER: Strong Bullish Sentiment! Long!
My dear friends,
Today we will analyse SILVER together☺️
The market is at an inflection zone and price has now reached an area around 37.873 where previous reversals or breakouts have occurred.And a price reaction that we are seeing on multiple timeframes here could signal the next move down so we can enter on confirmation, and target the next key level of 37.962..Stop-loss is recommended beyond the inflection zone.
❤️Sending you lots of Love and Hugs❤️

Silver Holds Gains After 14-Year HighSilver traded around $38.10 during Tuesday’s Asian session after hitting a 14-year high of $39.13 on Monday. Safe-haven demand remained firm following Trump’s threat of severe tariffs on Russia unless a peace deal is reached within 50 days. Further fueling uncertainty, NATO confirmed a new weapons package for Ukraine.
Meanwhile, Powell’s comments on inflation risks tied to tariffs raised doubts over near-term Fed rate cuts, weighing slightly on silver. Trump’s renewed criticism of the Fed Chair also reignited concerns over central bank independence. Tariff negotiations with the EU continue, though tensions persist, especially after the U.S. slapped a 17% duty on fresh tomato imports from Mexico.
Resistance is at 38.50, while support holds at 38.00.
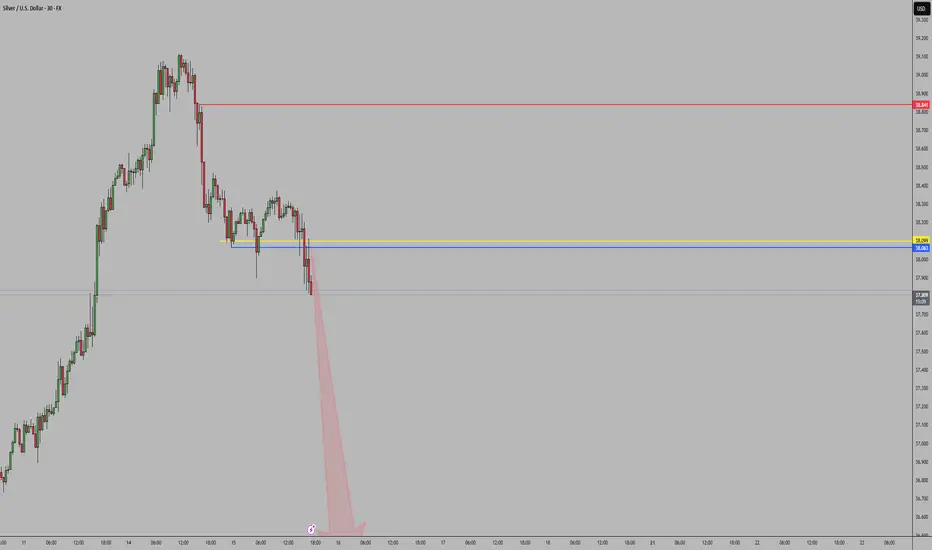
SILVER h4 bullish pattansilver bullish mode Bearish Disruption Scenario:
Fake bounce to ~$37.00
Rejection → Break $36.00 support
Bear momentum pushes to $35.00–34.50
Neutral/Range Disruption:
Price oscillates between 36.00 and 36.80 for longer than expected — builds up coiled energy before either sharp breakout or breakdown
Only Bullish IF:
Clean reclaim of 37.25 with strong close above

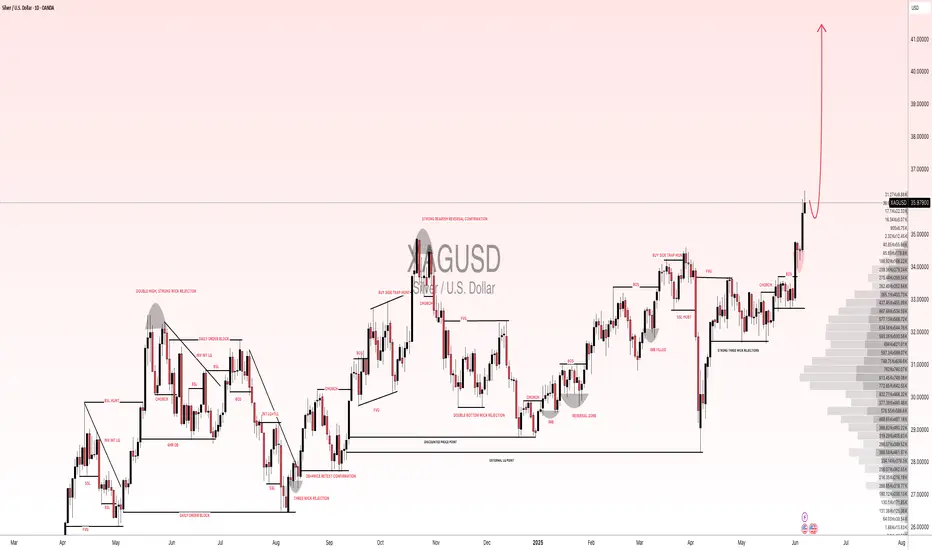
Skeptic | XAG/USD Analysis: Precision Triggers for Spot & FutureHey everyone, it’s Skeptic! 😎 Ready to ride XAG/USD’s next wave? Let’s dive into XAG/USD (Silver) to uncover long and short triggers that can deliver solid profits. Currently trading around $ 36.31 , we’re analyzing Daily and 4-hour timeframes to pinpoint high-probability setups. Here’s the no-nonsense breakdown to keep you sharp. 📊
📈 Daily Timeframe
On the Daily timeframe, we saw a strong primary uptrend sparked by a V-pattern breakout at $ 33.68317 , which drove a 10% rally, as flagged in my previous analyses—hope you caught it! We’re now in a consolidation box, potentially acting as accumulation or distribution. Today’s candle faced a strong rejection from the box ceiling. If it closes this way in 9 hours, the odds of breaking the box floor increase significantly.
Key Supports: If the floor breaks, watch $ 34.78648 and $ 34.41291 as strong reaction zones for potential bounces.
4-Hour Timeframe (Futures Triggers)
On the 4-hour timeframe, let’s lock in long and short triggers:
Long Trigger: Break above resistance at $ 37.29163 , confirmed by RSI entering overbought. Check my RSI guide for how I optimize setups with RSI.
Short Trigger: Break below support at $ 35.59660 , with volume confirmation. Additional confirmation: RSI entering oversold.
Confirmation Timing: Choose your confirmation timeframe based on your style—4-hour, 1-hour, or even 15-minute. I typically confirm triggers on 15-minute closes for precision, but if 1-hour momentum kicks in, I use 1-hour candle closes. Focus on candle body closes, not just shadows, to avoid fakeouts.
Pro Tip: Stick to 1%–2% risk per trade for capital protection.
Final Vibe Check
This XAG/USD breakdown arms you with precise triggers: long at $37.29163, short at $35.59660, with volume and RSI as your allies. The Daily consolidation signals a big move is brewing—stay patient for the ceiling or floor break. Want more cycle-based setups or another pair? Drop it in the comments! If this analysis sharpened your edge, hit that boost—it fuels my mission! 😊 Stay disciplined, fam! ✌️
💬 Let’s Talk!
Which Silver trigger are you eyeing? Share your thoughts in the comments, and let’s crush it together!

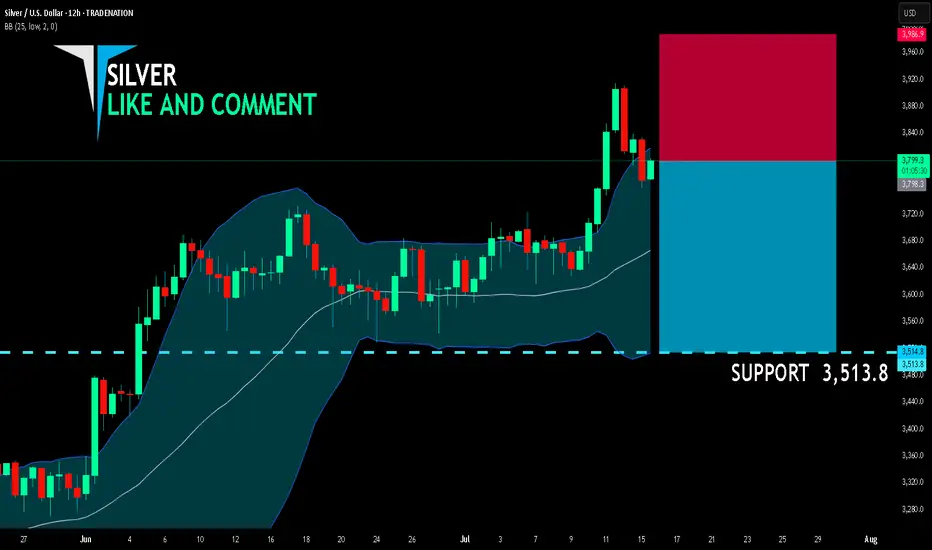
SILVER SELLERS WILL DOMINATE THE MARKET|SHORT
SILVER SIGNAL
Trade Direction: short
Entry Level: 3,798.3
Target Level: 3,513.8
Stop Loss: 3,986.9
RISK PROFILE
Risk level: medium
Suggested risk: 1%
Timeframe: 12h
Disclosure: I am part of Trade Nation's Influencer program and receive a monthly fee for using their TradingView charts in my analysis.
✅LIKE AND COMMENT MY IDEAS✅
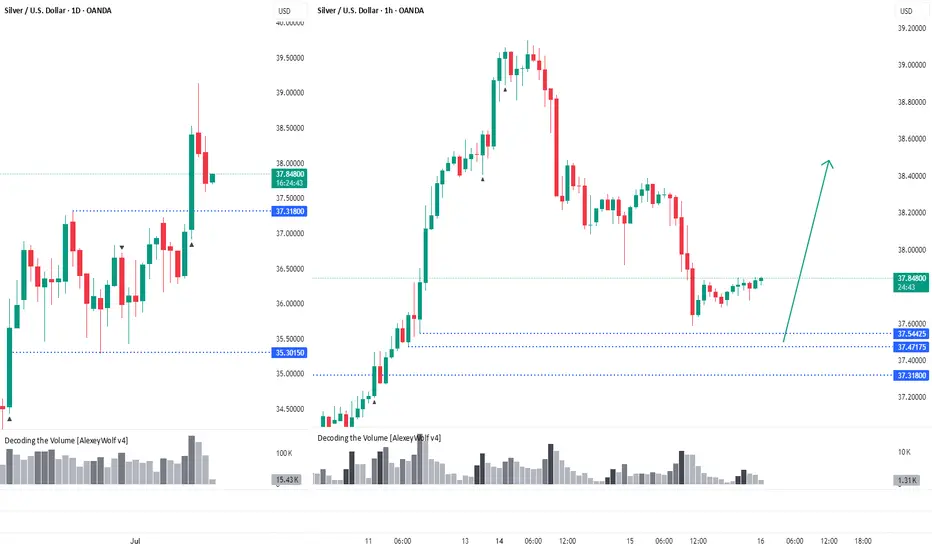
Silver. The price has pulled backHi traders and investors!
On the daily timeframe, the price has broken out of the sideways range through the upper boundary at 37.31.
The price has pulled back close to levels where potential buy patterns could form — 37.54, 37.47, and 37.31.
This analysis is based on the Initiative Analysis concept (IA).
Wishing you profitable trades!
Is it time for a correction for silver?
Hi my dears
It seems that silver, like gold, should spend a few months in a resting phase. Of course, this is a guess. There is a condition on the chart that, if it happens, we should probably see the conditions shown on the chart happen.
I would be happy to hear your opinion.
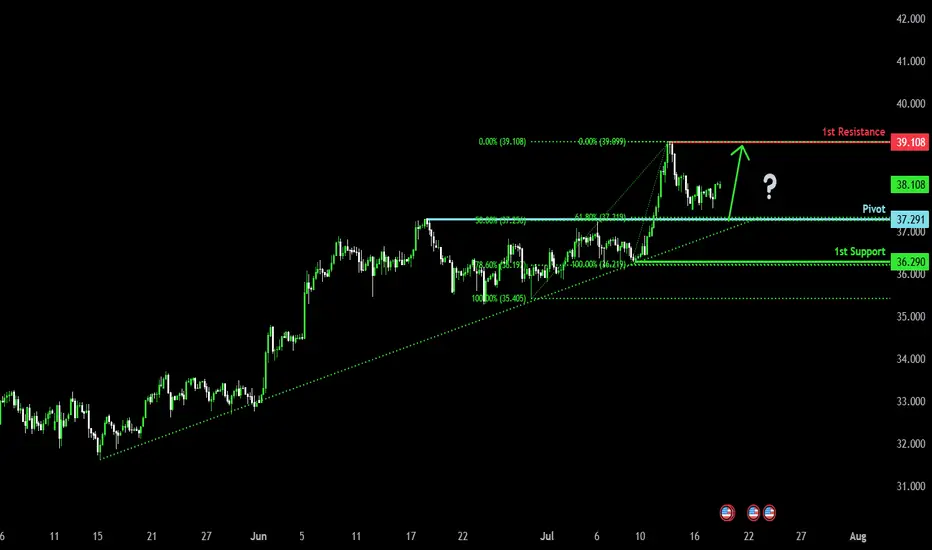
Falling towards the pullback support?The Silver (XAG/USD) is falling towards the pivot which acts as a pullback support and could bounce to the 1st resistance which is a pullback resistance.
Pivot: 37.29
1st Support: 36.29
1st Resistance: 39.10
Risk Warning:
Trading Forex and CFDs carries a high level of risk to your capital and you should only trade with money you can afford to lose. Trading Forex and CFDs may not be suitable for all investors, so please ensure that you fully understand the risks involved and seek independent advice if necessary.
Disclaimer:
The above opinions given constitute general market commentary, and do not constitute the opinion or advice of IC Markets or any form of personal or investment advice.
Any opinions, news, research, analyses, prices, other information, or links to third-party sites contained on this website are provided on an "as-is" basis, are intended only to be informative, is not an advice nor a recommendation, nor research, or a record of our trading prices, or an offer of, or solicitation for a transaction in any financial instrument and thus should not be treated as such. The information provided does not involve any specific investment objectives, financial situation and needs of any specific person who may receive it. Please be aware, that past performance is not a reliable indicator of future performance and/or results. Past Performance or Forward-looking scenarios based upon the reasonable beliefs of the third-party provider are not a guarantee of future performance. Actual results may differ materially from those anticipated in forward-looking or past performance statements. IC Markets makes no representation or warranty and assumes no liability as to the accuracy or completeness of the information provided, nor any loss arising from any investment based on a recommendation, forecast or any information supplied by any third-party.