XAGUSDB wave looks cooked — rejection off the 0.618 zone. As long as 38.25 holds, C wave down to 35.80 → 34.50’s is in play. Break above = plan invalid.
#XAGUSD #Silver #WaveAnalysis
XAGUSD01 trade ideas

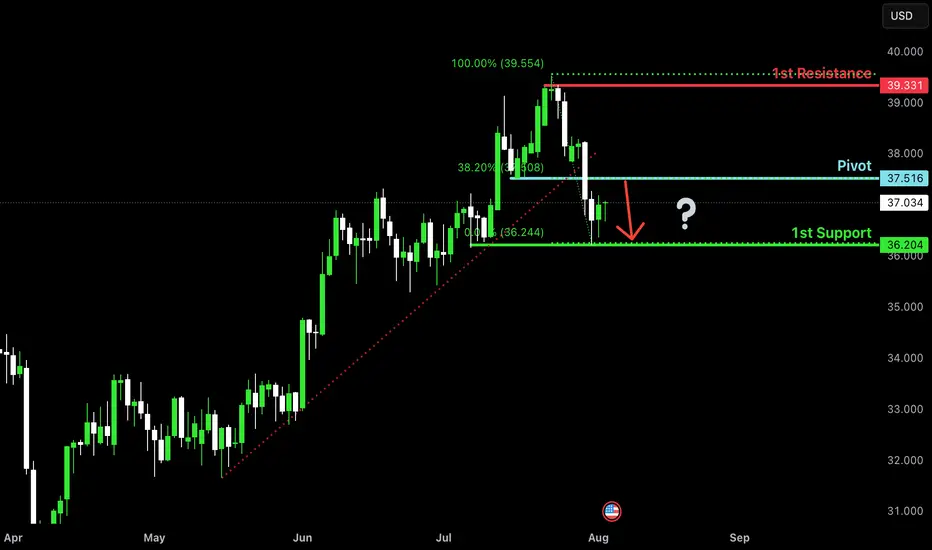
Bearish reversal for the Silver?The price is rising towards the pivot and could reverse to the pullback support.
Pivot: 37.51
1st Support: 36.20
1st Resistance: 39.33
Risk Warning:
Trading Forex and CFDs carries a high level of risk to your capital and you should only trade with money you can afford to lose. Trading Forex and CFDs may not be suitable for all investors, so please ensure that you fully understand the risks involved and seek independent advice if necessary.
Disclaimer:
The above opinions given constitute general market commentary, and do not constitute the opinion or advice of IC Markets or any form of personal or investment advice.
Any opinions, news, research, analyses, prices, other information, or links to third-party sites contained on this website are provided on an "as-is" basis, are intended only to be informative, is not an advice nor a recommendation, nor research, or a record of our trading prices, or an offer of, or solicitation for a transaction in any financial instrument and thus should not be treated as such. The information provided does not involve any specific investment objectives, financial situation and needs of any specific person who may receive it. Please be aware, that past performance is not a reliable indicator of future performance and/or results. Past Performance or Forward-looking scenarios based upon the reasonable beliefs of the third-party provider are not a guarantee of future performance. Actual results may differ materially from those anticipated in forward-looking or past performance statements. IC Markets makes no representation or warranty and assumes no liability as to the accuracy or completeness of the information provided, nor any loss arising from any investment based on a recommendation, forecast or any information supplied by any third-party.
SILVER: Move Up Expected! Long!
My dear friends,
Today we will analyse SILVER together☺️
The in-trend continuation seems likely as the current long-term trend appears to be strong, and price is holding below a key level of 37.330 So a bearish continuation seems plausible, targeting the next low. We should enter on confirmation, and place a stop-loss beyond the recent swing level.
❤️Sending you lots of Love and Hugs❤️
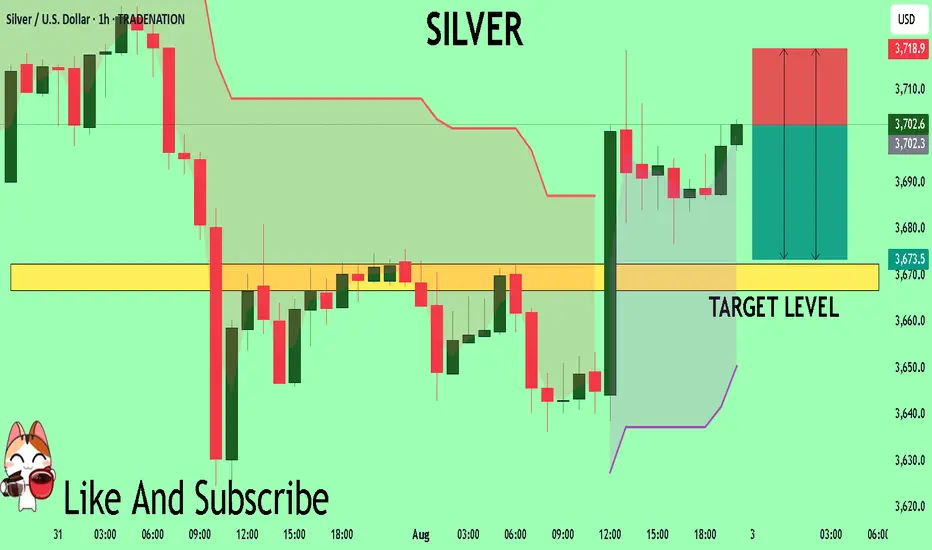
SILVER Is Going Down! Sell!
Please, check our technical outlook for SILVER.
Time Frame: 1h
Current Trend: Bearish
Sentiment: Overbought (based on 7-period RSI)
Forecast: Bearish
The market is trading around a solid horizontal structure 3,722.4.
The above observations make me that the market will inevitably achieve 3,685.7 level.
P.S
Please, note that an oversold/overbought condition can last for a long time, and therefore being oversold/overbought doesn't mean a price rally will come soon, or at all.
Disclosure: I am part of Trade Nation's Influencer program and receive a monthly fee for using their TradingView charts in my analysis.
Like and subscribe and comment my ideas if you enjoy them!

SILVER SWING POSITIONTVC:SILVER I am still holding this swing position entered last friday on silver. looks like still has room to move higher. I am trailing this.
(Updated) Silver Rebounds from Golden ZoneSilver dumped hard into the Golden Zone and reversed exactly where we marked it. Bulls stepping in? Now we watch for follow-through.
📌 Price respected the Golden Zone and reversed clean
📌 Bullish break and EMA shift underway
📌 Watching for continuation toward $38
⏱️ Timeframe: 1H
#silver #xagusd #fibonacci #reversalsetup #technicalanalysis #tradingview #quanttradingpro


Silver Bulls Unstoppable – Price Discovery Next?Silver has been on a strong uptrend, consistently making higher lows (HL) and higher highs (HH) over the past few years.
The long-term trendline, which acted as strong support for multiple retests, was finally broken to the upside. The old resistance zone has now turned into a solid support area, showing clear bullish strength.
Currently, price is hovering just below its all-time high (ATH) around $39.59. If bulls manage to break and sustain above this level, we could see fresh highs and a strong continuation of the upward momentum.
DYOR, NFA

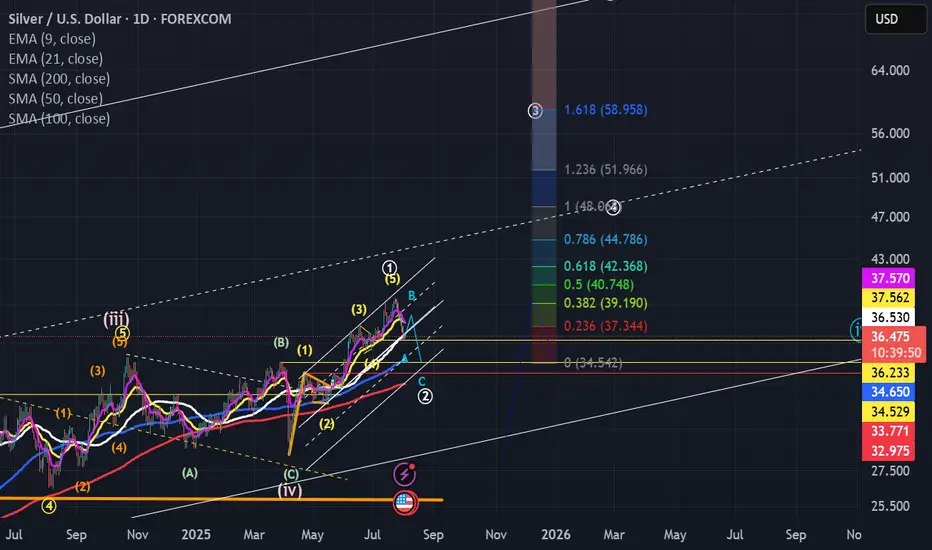
My alternate wave count for silverBelow is a slighly altered wave count for silver...it shows we have completed wave 5(yellow) which is a wave 1 (white) and are now in the process of working out wave 2 (white)...the first leg down (a) has just completed...and wave b of the ABC should start and complete over the next few days...follwed by one more low (wave c)...around the $34-$34.50 area.
I do not expect a move below $34 due to all the support on the chart at this level (look left and you will see that the $34 was a major prior resistance zone...when resistance is broken it becomes support.
If this count is the correct one (again it is my alternate to the one posted previously), it meas a bit more patience is required over the next few weeks...before we see a major move up (above $50) will start.
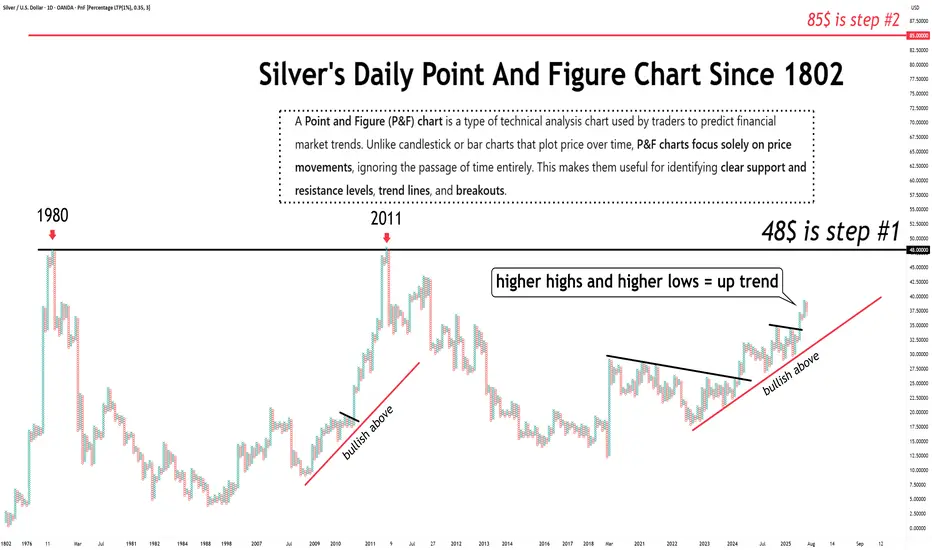
The long term prospects for silver are STILL bullish.Just so we are clear...
The long term prospects for silver are STILL bullish.
Once $48 is cleared, $85 becomes the next target.
Silver potentialSilver. previous trade SL kicked in. now their seems 3 possibilties for a downward leg. 1. high hold. 2 false break. 3. ABC - C last leg

#XAGUSD: A Strong Bullish Move, Possible Target at $45?Silver is currently experiencing a correction, but the overall price remains bullish. Analysing the data, we can see a potential price reversal in our area of interest. Following the recent higher high, price is poised to create another record high. We should closely monitor volume and price behaviour. A strong volume signal would indicate a potential bullish move in the future.
Good luck and trade safely.
Like and comment for more!
Team Setupsfx_

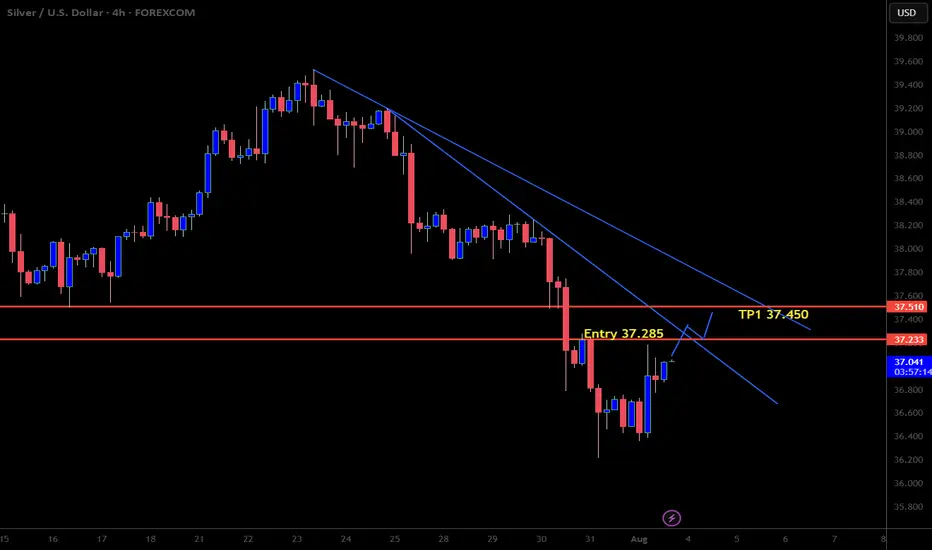
Bullish move on SilverWe have to be a little patient with this trade. I'm looking to buy XAGUSD once we get a close above 37.285 on an H4 timeframe. Should be a nice trade for the week. Happy Trading!!
SILVER Move Down Ahead! Sell!
Hello,Traders!
SILVER is about to retest
A horizontal resistance level
Of 37.21$ and its a strong
Key level so after the retest
We will be expecting a
Local pullback
Sell!
Comment and subscribe to help us grow!
Check out other forecasts below too!
Disclosure: I am part of Trade Nation's Influencer program and receive a monthly fee for using their TradingView charts in my analysis.

SILVER My Opinion! SELL!
My dear friends,
Please, find my technical outlook for SILVER below:
The price is coiling around a solid key level - 37.026
Bias - Bearish
Technical Indicators: Pivot Points Low anticipates a potential price reversal.
Super trend shows a clear sell, giving a perfect indicators' convergence.
Goal - 36.725
Safe Stop Loss - 37.189
About Used Indicators:
The pivot point itself is simply the average of the high, low and closing prices from the previous trading day.
Disclosure: I am part of Trade Nation's Influencer program and receive a monthly fee for using their TradingView charts in my analysis.
———————————
WISH YOU ALL LUCK
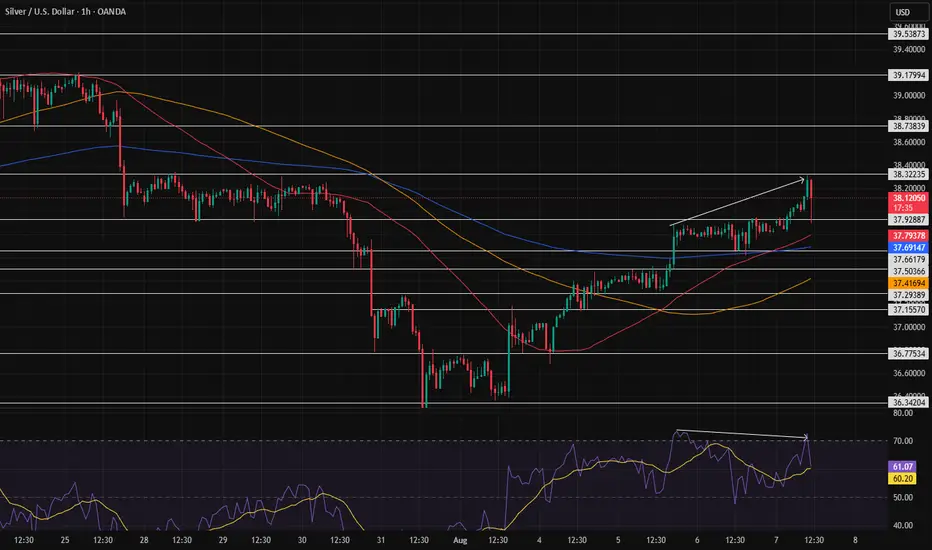
Resistance at 38.32235After the price reached the point we mentioned and got rejected, it's now trying to approach that area again. However, we're seeing a divergence, which could indicate weakness in the trend—though that's not always the case.
In any case, we have to wait and see; if it manages to break through that level, we can hope for the price to reach 39.17994.
XAG/USD Long Setup | H1 TimeframeA classic setup based on #SmartMoneyConcepts:
✅ Change of Character (CHOCH) after a liquidity sweep.
✅ Price returned to the Order Block & filled the FVG.
✅ Entry at the Point of Interest (POI) with a high R/R.
Waiting for it to reach the buy-side liquidity targets. Do you agree?

Silver Short IdeaBearish rising wedge breakout with PO of $28. Currently forming a rising wedge for the right shoulder of a head and shoulders top, not yet broken out… but we’re at the 50% retracement from the most recent multi year high.

SILVER Going Upas you have might or might not seen i have posted this Buying opportunity of Silver few days ago, and now the market have creatd a new demand + Flip zone where we are looking for a new opportunity.

Silver The Week AheadKey Support and Resistance Levels
Resistance Level 1: 3756
Resistance Level 2: 3855
Resistance Level 3: 3915
Support Level 1: 3600
Support Level 2: 3544
Support Level 3: 3480
This communication is for informational purposes only and should not be viewed as any form of recommendation as to a particular course of action or as investment advice. It is not intended as an offer or solicitation for the purchase or sale of any financial instrument or as an official confirmation of any transaction. Opinions, estimates and assumptions expressed herein are made as of the date of this communication and are subject to change without notice. This communication has been prepared based upon information, including market prices, data and other information, believed to be reliable; however, Trade Nation does not warrant its completeness or accuracy. All market prices and market data contained in or attached to this communication are indicative and subject to change without notice.

Weakness of the trendSilver, although trying hard to go up, shows a very clear weakness in the trend. If it continues to attempt rising, it will probably only reach up to around 38.73839, and then most likely we will see a correction to fix this weakness before it moves upward with more strength.

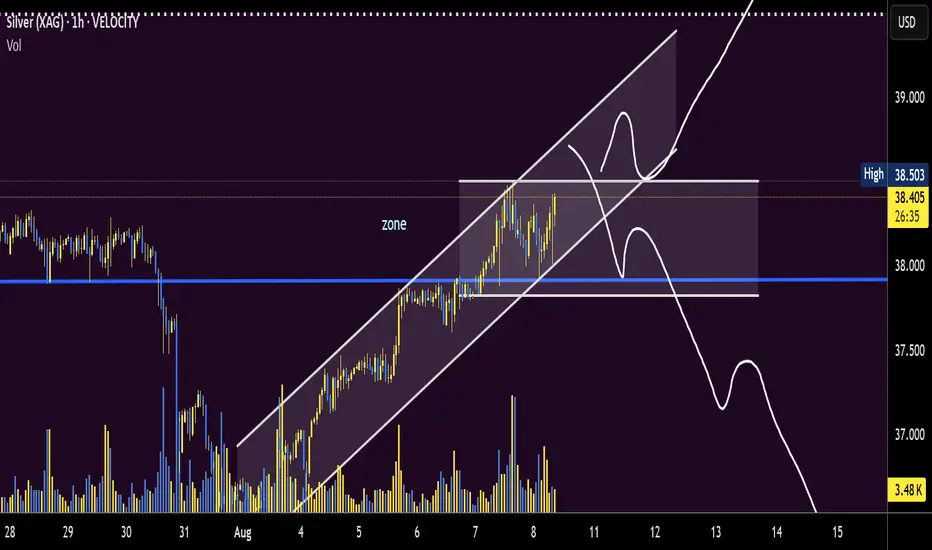
Is silver roadmap at a crossroadssilver trend has been up for ages. perhaps pushing to attack the highs of "50.000" - the trend is your...
ZONE: offers 2 roadmaps:
1.going with the trend up favours bullish entry signals - ABC complete??
2. a unusaul significant entry signal suggesting abc correction within ABC not complete another nuance.
Silver' drop opportunity.Silver has rised last days very strongly in a narrow upward channel without any significant pullbeck. In my opinion it Is only pullbeck of downward trend from the last peak of 39,5 And the price Will Soon resume Its downward correction. I only don't know if the level for finishing this upward pullbeck finishihes ať 38,5 or around 39$. I'm bearish but be carefull and wait for the price break the Channel then shorting it Is very meaningful.
