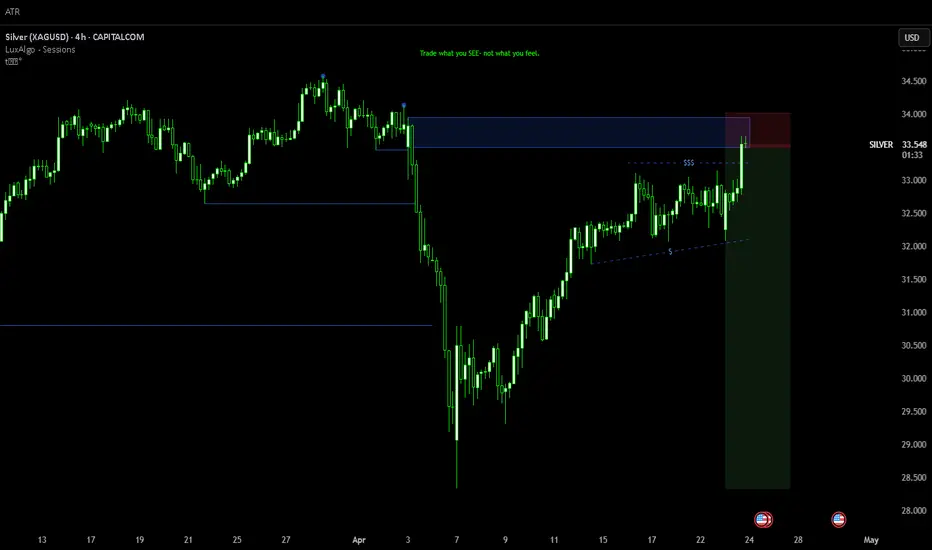
Silver : After an excellent recovery, succumb to a Red band.Silver : After an excellent recovery from the support of $ 28.33 , it seems it has succumbed to a Red Band resistance of $34.
It's in a Sell trajectory already and couldn't become a Buy, like Gold .
Support is at $28 and Resistance is at $34 as displayed on the chart .
( Not a Buy / Sell Recommendation
Do your own due diligence ,Market is subject to risks, This is my own view and for learning only .)
XAGUSD01 trade ideas

XAGUSD (Silver/US Dollar) trading idea for Monday, May 5, 2025 Trading Plan (Scenario-Based):
📌 Plan A: Bullish Breakout Play
Entry: Buy on breakout above $26.70 with strong volume confirmation.
SL: $26.20
TP1: $27.10
TP2: $27.50
RRR: ~2.5:1
📌 Plan B: Range Bounce
Entry: Buy near $25.80–26.00 support zone if price retraces.
SL: $25.50
TP1: $26.50
TP2: $26.90

SILVER: Will Start Growing! Here is Why:
Remember that we can not, and should not impose our will on the market but rather listen to its whims and make profit by following it. And thus shall be done today on the SILVER pair which is likely to be pushed down by the bears so we will sell!
Disclosure: I am part of Trade Nation's Influencer program and receive a monthly fee for using their TradingView charts in my analysis.
❤️ Please, support our work with like & comment! ❤️

Silver uptrend channelSilver respecting this uptrend channel very nicely. maybe a retest of the lows before a nice move to the upper level.

SILVER: Target Is Up! Long!
My dear friends,
Today we will analyse SILVER together☺️
The market is at an inflection zone and price has now reached an area around 32.356 where previous reversals or breakouts have occurred.And a price reaction that we are seeing on multiple timeframes here could signal the next move up so we can enter on confirmation, and target the next key level of 32.538.Stop-loss is recommended beyond the inflection zone.
❤️Sending you lots of Love and Hugs❤️

SILVER INTRADAY consolidation supported at 3200Key Support and Resistance Levels
Resistance Level 1: 3300
Resistance Level 2: 3364
Resistance Level 3: 3405
Support Level 1: 3200
Support Level 2: 3136
Support Level 3: 3095
This communication is for informational purposes only and should not be viewed as any form of recommendation as to a particular course of action or as investment advice. It is not intended as an offer or solicitation for the purchase or sale of any financial instrument or as an official confirmation of any transaction. Opinions, estimates and assumptions expressed herein are made as of the date of this communication and are subject to change without notice. This communication has been prepared based upon information, including market prices, data and other information, believed to be reliable; however, Trade Nation does not warrant its completeness or accuracy. All market prices and market data contained in or attached to this communication are indicative and subject to change without notice.

Probability of Bullrun Engine Gear Movement with Crab.The previous silver bull run lacked sufficient momentum to be sustained.
We anticipate that the second crab market phase will provide the catalyst necessary to ignite a more robust and enduring bull run.

Silver Slips on Trade Optimism and Weak Economic Data Silver prices dropped over 1% on Thursday, slipping to around $32 per ounce, dragged by reduced safe-haven demand following Trump's optimistic remarks on potential trade deals with China, India, Japan, and South Korea.
Weak economic data further pressured prices, with the U.S. economy contracting by 0.3% and China’s manufacturing PMI falling to a 16-month low, raising concerns about industrial demand.
Today, silver is showing signs of recovery amid improved risk appetite, with the market focus on the $34.90–$35.00 resistance zone as a key technical level.
Narrow Range: $31.30 – $33.70
Wide Range: $28.50 – $34.90/35.00

Silver H4 I Bearish Reversal Based on the H4 chart analysis, we can see that the price is rising toward our sell entry at 32.73, which is a pullback resistance aligning with the 61.8% Fibo retracement.
Our take profit will be at 31.90, an overlap support level.
The stop loss will be placed at 33.62, an overlap resistance level.
High Risk Investment Warning
Trading Forex/CFDs on margin carries a high level of risk and may not be suitable for all investors. Leverage can work against you.
Stratos Markets Limited (tradu.com/uk):
CFDs are complex instruments and come with a high risk of losing money rapidly due to leverage. 63% of retail investor accounts lose money when trading CFDs with this provider. You should consider whether you understand how CFDs work and whether you can afford to take the high risk of losing your money.
Stratos Europe Ltd (tradu.com/eu):
CFDs are complex instruments and come with a high risk of losing money rapidly due to leverage. 63% of retail investor accounts lose money when trading CFDs with this provider. You should consider whether you understand how CFDs work and whether you can afford to take the high risk of losing your money.
Stratos Global LLC (tradu.com/en):
Losses can exceed deposits.
Please be advised that the information presented on TradingView is provided to Tradu (‘Company’, ‘we’) by a third-party provider (‘TFA Global Pte Ltd’). Please be reminded that you are solely responsible for the trading decisions on your account. There is a very high degree of risk involved in trading. Any information and/or content is intended entirely for research, educational and informational purposes only and does not constitute investment or consultation advice or investment strategy. The information is not tailored to the investment needs of any specific person and therefore does not involve a consideration of any of the investment objectives, financial situation or needs of any viewer that may receive it. Kindly also note that past performance is not a reliable indicator of future results. Actual results may differ materially from those anticipated in forward-looking or past performance statements. We assume no liability as to the accuracy or completeness of any of the information and/or content provided herein and the Company cannot be held responsible for any omission, mistake nor for any loss or damage including without limitation to any loss of profit which may arise from reliance on any information supplied by TFA Global Pte Ltd.
The speaker(s) is neither an employee, agent nor representative of Tradu and is therefore acting independently. The opinions given are their own, constitute general market commentary, and do not constitute the opinion or advice of Tradu or any form of personal or investment advice. Tradu neither endorses nor guarantees offerings of third-party speakers, nor is Tradu responsible for the content, veracity or opinions of third-party speakers, presenters or participants.

Fri 2nd May 2025 XAG/USD Daily Forex Chart Sell SetupGood morning fellow traders. On my Daily Forex charts using the High Probability & Divergence trading methods from my books, I have identified a new trade setup this morning. As usual, you can read my notes on the chart for my thoughts on this setup. The trade being a XAG/USD Sell. Enjoy the day all. Cheers. Jim

Silver short.Market structure has shifted- in silver-
correlated pair - gold is overextended- due for correction.
Liquidity buildup below OB.
Sell placed with partial profit at opp side liq.
Full TP at Low.
XAG/USD For Bearishwait for pull-back near by entry point and then go short
general trend is down trend
current phase is pull-back
have fun :)

SILVER: Bears Are Winning! Short!
My dear friends,
Today we will analyse SILVER together☺️
The recent price action suggests a shift in mid-term momentum. A break below the current local range around 32.154 will confirm the new direction downwards with the target being the next key level of 31.906.and a reconvened placement of a stop-loss beyond the range.
❤️Sending you lots of Love and Hugs❤️

SILVER Is Very Bearish! Sell!
Here is our detailed technical review for SILVER.
Time Frame: 4h
Current Trend: Bearish
Sentiment: Overbought (based on 7-period RSI)
Forecast: Bearish
The market is trading around a solid horizontal structure 3,304.4.
The above observations make me that the market will inevitably achieve 3,212.0 level.
P.S
We determine oversold/overbought condition with RSI indicator.
When it drops below 30 - the market is considered to be oversold.
When it bounces above 70 - the market is considered to be overbought.
Disclosure: I am part of Trade Nation's Influencer program and receive a monthly fee for using their TradingView charts in my analysis.
Like and subscribe and comment my ideas if you enjoy them!

SILVER H4 IdeaPotential for a bearish pullback on the XAGUSD H4 which could lead to a price movement towards the support level at 30.600. SELL levels from 33.600

XAGUSD - SILVERSupport and Resistance clearly defined in the chart.
2 Scenarios on my mind is as follows:
Short Term:
Silver Drops to 32 (rounding), where there is a strong long time support for that area. and Target 1 "T1" is at 33.677 (33.600)
Where Long Term due to the lagging effect from gold, long term outlook is heading towards the 34.134 "T2" and 34.578 "T3" and settle there till it moves up again.

SILVER - BEARISH SCENARIOHello Traders !
The Silver price failed to create a new higher high !
Let's expect the bearish scenario:
If the market breaks the higher low and closes below that,
We will see a bearish move📉
TARGET: 31.23🎯

Silver Holds Above Key Breakout Zone: Bullish Momentum ContinuesSilver is trading above the former resistance zone of 32.65–32.80. As long as the price remains above this area, I will be considering only long positions.
Overall, I expect the upward movement to continue. The chart structure is very harmonious, with strong buying from the lows, a supportive broader market sentiment for commodities, and a clear uptrend on higher timeframes.

Silver Breakdown: Waiting for the next Buy ZoneWe've confidently broken through the support levels at 32.40 and 32. The chart looks strongly bearish, and there's a high probability that the downward move will continue. I expect the price to reach the 30.80–31 area, where I'll be watching the consolidation to consider a potential long position.
Overall, I remain very optimistic about the commodities market this year. Silver has yet to fully realize its growth potential, so after these broad pullbacks, it’s likely to continue pushing toward higher levels.
For now, it’s too early to go long, and I won’t be participating in the short move.
📝Trading plan:
Waiting for a lower price to continue buying.

1 Hour Silver Bearish Trend Inverted Hammer SpottedTrade idea with TP and Stop Loss:
1 Hour Silver Bearish Trend Inverted Hammer Spotted

Evening Star Pattern on XAGUSD – Downtrend Ahead?Last week, XAGUSD managed to break above the 33.15 resistance level, making a local high at 33.70.
However, the price quickly reversed and formed an Evening Star candlestick pattern, signaling selling pressure.
At the time of writing, the price is hovering around 33.00 – a key pivot point for the next move.
The bias leans toward a downside continuation:
- A clear break below 33.00 opens the way for a further drop toward 32.00,
- With a potential final target at 31.00.
Disclosure: I am part of Trade Nation's Influencer program and receive a monthly fee for using their TradingView charts in my analyses and educational articles.

XAGUSDA quick one silver here. XAG is Bearish on the HTF, aligning with the HTF structure.
I am looking forward to go short on Silver from this point.
All data are clearly shown on the chart.

silver vs spxHello.
Silver it's your time but against all.
x70 against SPX. Possible ?
Yes in 2040. If we have a W pattern.
10 YEARS MA (PURPLE) Lead the move. Not yet happen.
I will update this in 2026 or BEFORE IF MA is break.
