Silver (XAGUSD) might have launched into the next leg higherSilver (XAGUSD) has hit a key turning point after dropping from its October 23, 2024 peak. This decline unfolded in three distinct swings, following a zigzag pattern known as an Elliott Wave structure. Starting from that high, the first drop (wave A) landed at 29.68, followed by a bounce (wave B) to 34.58. Then, the final slide (wave C) bottomed out at 28.328, as seen on the hourly chart. This marked the end of a larger correction phase, called wave (4). Silver found its footing in a critical support zone between 24.86 and 28.56—a range calculated using Fibonacci tools, stretching 100% to 161.8% of the drop from the October high.
Now, silver is climbing again in what’s labeled wave (5). To confirm this upward trend, it needs to break past the prior peak of 34.86 from wave (3); otherwise, it might face another dip. Since bottoming out on April 7, 2025, at 28.328, silver rose to 30.81 (wave (i)), then eased back to 29.31 (wave (ii)). For now, as long as the 28.32 level holds firm, silver seems set to keep rising in the short term, offering hope for bullish traders.
XAGUSD01 trade ideas

SILVER Risky Short! Sell!
Hello,Traders!
SILVER is surging up again
But is about to enter a wide
Supply area around 31.40$
From where a local bearish
Correction is likely to take place
Sell!
Comment and subscribe to help us grow!
Check out other forecasts below too!
Disclosure: I am part of Trade Nation's Influencer program and receive a monthly fee for using their TradingView charts in my analysis.

XAGUSD - SilverExpecting a bullish breakout from the local low of Silver.
Orange lines being the decision confirmation prices.
There are 2 fake structure zones, which I believe will act as local demand zones.

Get Ready for the Silver Surge!🚀 Get Ready for the Silver Surge! 🚀
Hey there, silver enthusiasts! 🌟
We're diving into an exciting trend that’s shaping up right at the golden crab level—yes, we’re talking about that sweet spot of **$28.5!**
This is your chance to capitalize on the impending rise in silver prices! With all indicators pointing upwards, now's the perfect time to consider adding some silver to your portfolio.

SILVER: The Market Is Looking Down! Short!
My dear friends,
Today we will analyse SILVER together☺️
The in-trend continuation seems likely as the current long-term trend appears to be strong, and price is holding below a key level of 30.436 So a bearish continuation seems plausible, targeting the next low. We should enter on confirmation, and place a stop-loss beyond the recent swing level.
❤️Sending you lots of Love and Hugs❤️

XAG/USD For Bullishyou can go long now
or
wait for pull-back near entry point and then go long
general trend is up trend
have fun :)

Yields and Trade Wars Induce Silver InstabilitySilver dropped below $30 per ounce, hitting $29.57 on April 4, its lowest since mid-January, as rising U.S. Treasury yields made non-yielding assets less attractive. The U.S. announced a 104% tariff on Chinese imports starting at midnight, intensifying trade war concerns. Although over 70 countries have reportedly requested tariff relief, market sentiment remains cautious. The EU’s retaliatory tariff plans further fueled risk aversion, pressuring industrial metals. Still, expectations of Fed rate cuts and safe-haven demand offer some support.
Technically, the first resistance level is located at 30.90. In case of its breach, 31.40 and 32.50 could be monitored respectively. On the downside, first support is at 29.00. 28.40 and 27.50 would become the next support levels if this level is passed.

XAGUSD Trade Plan: 1D Support, Liquidity Grab, & Bullish Setup!Silver (XAGUSD) is currently exhibiting signs of being overextended, as evidenced by its recent price action on the daily and 4-hour timeframes. The metal has traded into a critical support zone, marked by previous lows on the daily chart. This zone represents a significant area of interest, as it has historically acted as a key level for buyers to step in. However, the current price action has dipped below these lows, eating into sell-side liquidity in the form of stop-loss orders placed beneath this level. This liquidity grab is a classic move often seen in markets before a potential reversal.
On the 15-minute timeframe, the price is consolidating within a range, suggesting a possible accumulation. A break above this range, accompanied by a bullish market structure shift, could signal the beginning of a reversal and provide a compelling buy opportunity. This aligns with the idea of a "spring" in Wyckoff theory, where price manipulates liquidity before reversing direction.
Traders should remain patient and wait for confirmation of a bullish breakout on the lower timeframe before entering long positions. Key factors to monitor include strong bullish momentum, a clear break of the range, and the formation of higher highs and higher lows. Until these conditions are met, caution is advised, as the current downtrend could persist. 📉➡️📈
Key Levels to Watch:
Support Zone: Previous daily lows (now acting as a liquidity zone).
Resistance Zone: The upper boundary of the current 15-minute range.
Trading Plan:
Wait for a break of the 15-minute range to the upside. 🚀
Look for a bullish market structure shift (higher highs and higher lows). 📊
Enter long positions with a tight stop-loss below the range low. 🛡️
Target key resistance levels on the 4-hour and daily timeframes for potential take-profit zones. 🎯
This analysis highlights the importance of patience and discipline in trading. While the current setup is promising, confirmation is key to avoid premature entries. As always, this is not financial advice, and traders should conduct their own due diligence before making any decisions. ⚠️

Silver: The Return of Sound MoneyIn times when the world makes no sense, the world has to go back to what's concrete.

A weekly look at the 200 year silver chart! Ummm, do you see what I see?
I would encourage you to keep buying every time silver dips into the 20s.
Your children will appreciate it :)
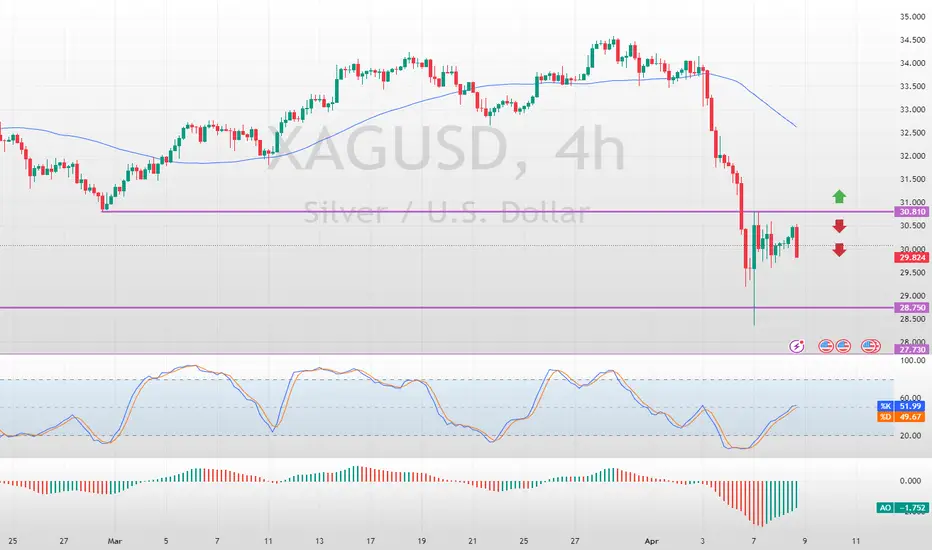
Silver Tested Key Resistance LevelFenzoFx—Silver tested the $30.81 resistance level today. If this holds, the downtrend may resume, targeting $28.75 and possibly $27.73 if selling pressure persists.
A bullish reversal could occur if XAG/USD exceeds and stabilizes above $30.81.
>>> Trade XAG/USD at FenzoFx Decentralized Forex Broker.
SILVER: Move Up Expected! Long!
My dear friends,
Today we will analyse SILVER together☺️
The market is at an inflection zone and price has now reached an area around 29.921 where previous reversals or breakouts have occurred. And a price reaction that we are seeing on multiple timeframes here could signal the next move up so we can enter on confirmation, and target the next key level of 30.271.Stop-loss is recommended beyond the inflection zone.
❤️Sending you lots of Love and Hugs❤️

buy silver now and holdI see silver as under value and I think in the next year or in the coming months we can see this grow at a real good rate. to me this is the time to buy before we see a real value of silver. I'm curtly holding 4 oz of silver and every week I plan to spend 100 so about 3 oz a week
my main goal is to hold but seek at least 5% gain in total value each month

Silver Holds Ground as Markets Eye Fed CutsSilver hovered around $30 per ounce on Monday, staying volatile as markets reacted to Trump’s escalating trade war. The metal dropped 16% over three sessions as recession fears sparked a broad selloff, with traders liquidating metals to cover losses. China retaliated with tariffs after the US imposed levies on all countries, with others expected to follow. Trump’s tariffs excluded copper, gold, energy, and certain minerals. Despite the slump, silver may regain support as markets bet on more Fed rate cuts this year.
Technically first resistance level is located at 30.90. In case of its breach 31.40 and 32.50 could be monitored respectively. On the downside, the first support is at 29.00. 28.40 and 27.50 would become the next support levels if this level is passed.

Reaction of Gold and Silver to the Increasing Fear FactorBy Ion Jauregui – ActivTrades Analyst
Gold, historically relegated to the background of investment strategies, is now emerging as a first-rate asset. This change is due to factors such as rising inflation, the implementation of aggressive tariff measures, and the geopolitical tensions that have intensified in recent years. The war in Ukraine and the consolidation of strategic alliances among Russia, China, and the BRICS countries have contributed to placing gold at the center of attention, demonstrating that its safe-haven nature is more necessary than ever.
One of the key elements in this transformation is the adoption of Basel Three regulations. This agreement, by classifying gold as a “tier one” asset, equates its value and security with that of US Treasury bonds. It is expected that, after its implementation in Europe in 2026, the same measure will be extended to US banks in 2027, which will increase institutional demand and further consolidate gold as a secure reserve in times of uncertainty.
Tariff policies, driven in part by decisions such as those of the Trump administration, generate inflation and increase economic uncertainty. Such a scenario forces banks and large investors to rethink their strategies, seeking in gold a refuge against the devaluation of other assets. The convergence of these factors suggests that the price of gold could reach, or even exceed, levels of $4,000 – it is even projected to reach $4,500 – as the increasing money supply pushes the valuation of the metal.
The Duality of Silver: Industry and Investment
Unlike gold, silver possesses a duality that makes it both an essential raw material for industry and an investment asset. While approximately 70% of annual silver production is allocated to industrial and manufacturing processes, the remainder is used in bars, coins, and ETFs. This characteristic creates inherent volatility, as movements in the economy directly affect its industrial demand.
During periods known as “fear trades,” when economic uncertainty spikes, silver tends to behave as a proxy for gold. Historically, compressions in the Gold/Silver Ratio (GSR) have been observed during these episodes, which in some cases have driven silver to experience abrupt price movements. Furthermore, the growing concern about market scarcity—due to a deficit between production and demand that could exceed 200 million ounces this year—adds another layer of complexity to the scenario.
Regulatory uncertainty exacerbates the situation: faced with the possibility of governmental interventions to “normalize” prices—for example, by banning ETFs or other forms of investment—silver could experience temporary declines. However, these interventions could be offset in the medium term by accumulated demand from investors eager to protect their assets in an environment of increasing instability.
Investor Strategy: The Pyramid Approach
There are a variety of experts who suggest that the strategy to navigate this volatile environment is the pyramid approach in investments in precious metals. At the base of this pyramid are the physical assets: the acquisition of gold and silver in the form of bars or coins represents the first line of defense against uncertainty and inflation. Gold, due to its role as a store of value, offers stability, while silver—with all its potential for revaluation in “fear trades”—adds dynamism to the portfolio. On top of this base, investment is complemented by mutual funds, ETFs, and stocks of mining producers and developers. Solid producers have historically generated the majority of returns, while developers, with high growth margins, offer opportunities to leverage market movements. This diversified structure helps manage risk and capitalize on both the stability of gold and the explosive potential of silver in times of tension.
Speculative Strategy
As throughout history there have always been speculators in the market, and derivatives trading is just one way to speculate, this type of trading obviously has a shorter time frame than that of the investor, but it facilitates quick entry and exit in the metals market. It clearly minimizes the risk of prolonged exposure, and the potential profits tend to be higher as well as the risks, due to leverage when trading with derivatives.
Silver Analysis (Ticker AT: SILVER)
Observing the silver chart, since Valentine’s Day, in February of last year, the asset has been climbing its price until October 2024, when its ascent stalled. Later, in the last week of March, the asset attempted to push its price above the highs established at $34,845 without success. After the “Trumpazo” tariff move triggered last Friday, its value fell back to $28,314, and this week we see how it has held the support at $28,768 and seems to have halted its decline. At this moment, the RSI is highly oversold at 33.38%, its current Point of Control (POC) is located around $30,556—a price it touched in yesterday’s session. The crossover of the 50-day moving average above the 100-day moving average occurred on January 31 on the daily chart, so if this trend does not change, it will continue supporting this expansion over the 200-day average. It is very likely that the precious metal will return to a recovery path, but this is highly dependent on the situation that may arise with gold as a reserve asset. If this price is not supported and the averages cross downward, we could see a correction to the price zone of $27,198. However, it should be noted that this support has been touched twice and it could be tested again at some point if the downward pressure continues.
Conclusion: Fear as the Driving Force of the Market
The current environment, marked by geopolitical and economic uncertainty, has turned fear into a determining factor for the behavior of precious metals. Gold, now considered a first-rate asset and backed by measures such as Basel Three, is emerging as a safe haven with projections that could exceed $4,000. On the other hand, silver, despite its volatility and industrial use, acts as a proxy for gold during “fear trades,” where its abrupt movements offer opportunities for investors. In short, this context underscores the importance of a diversified strategy—combining physical assets and derivatives trading—to protect wealth and take advantage of potential revaluations when fear drives the market.
*******************************************************************************************
The information provided does not constitute investment research. The material has not been prepared in accordance with the legal requirements designed to promote the independence of investment research and such should be considered a marketing communication.
All information has been prepared by ActivTrades ("AT"). The information does not contain a record of AT's prices, or an offer of or solicitation for a transaction in any financial instrument. No representation or warranty is given as to the accuracy or completeness of this information.
Any material provided does not have regard to the specific investment objective and financial situation of any person who may receive it. Past performance is not reliable indicator of future performance. AT provides an execution-only service. Consequently, any person acing on the information provided does so at their own risk.

Silver under pressureSilver, like many other assets, is stabilizing after last week’s sharp decline.
On the weekly chart, the uptrend has been broken. It appears that the big money and major players have capitulated from this market. Also, cycle analysis suggests that the metal will remain under pressure through the end of April. Overall, silver is clearly struggling to maintain its bullish momentum.
I expect further downside, with potential targets at $27.90 and $26.50 as final levels for this correction.
For now, I will continue to trade from the short side.
If price moves above $30.80 and consolidates there, we could start talking about long positions. But at this point, there’s no objective reason to do so.
