"I remember this chart pattern in 2020.. Just before the big.."This one is going to be epic..this coming economic collapse is
going to make people rich and sadly the middle class poor
Believe it or not.I remember this chart pattern in 2020..
Just before the big market crash.
They say the poor can not get poorer
but its the middle class that gets poor
This means the average young people are
going to lose their jobs or decide to get a second job,
Capitalism is a factor of production
and having buying power
is the best feeling in the world
because i have been unemployed for a long time.
Capitalism is the only place i call home.
Even in the difficult times.
Capital markets have been my food and drink.
My hopes and dreams.
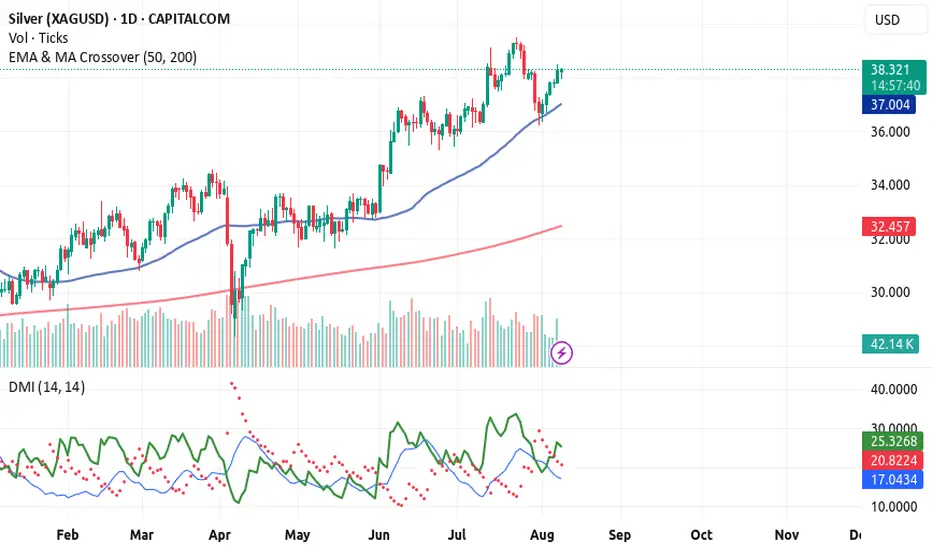
The silver TVC:SILVER price is going up because
it is following the rocket booster strategy
So what is the rocket booster strategy?
This strategy has 3 steps:
1-The price has to be above the 50 EMA
2-The price has to be above the 200 EMA
3-The price should gap up
That last step is very important
because you can see the gap from the
ADX indicator below
That trend line [ green line ]
shows that buyers are gaining strength
and running the market
But that line [ Blue line below the red line and green line]
also shows that a BIG move is coming
this big move is going to be Massive..
You will hear about it in the news by the time
it hits its peak this is going to be like 2020...
Just watch out anyway buy silver now.
Rocket boost this content to learn more.
Disclaimer:Trading is risky please
learn risk management and profit taking strategies.Feel free to use a simulation trading account before you trade with real money.
XAGUSD01 trade ideas
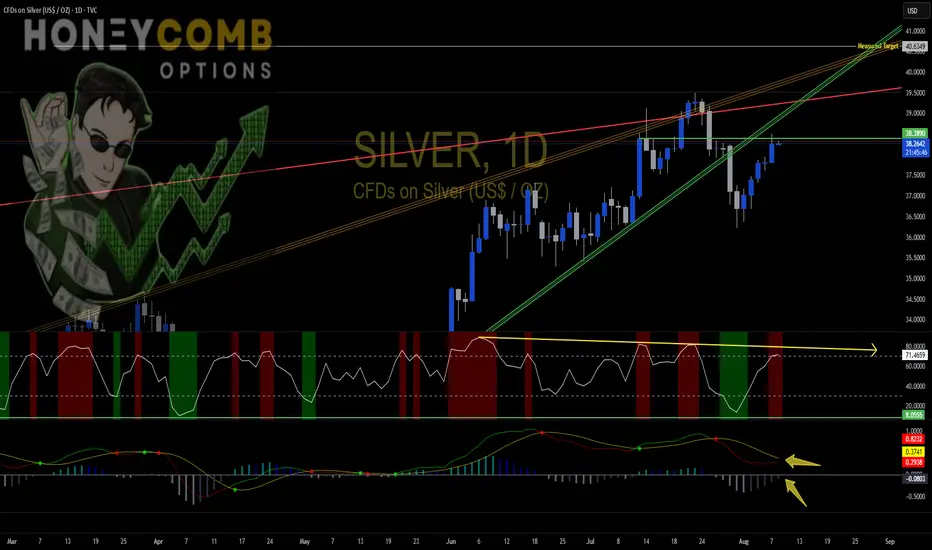
Will trade tensions drive silver prices higher?Silver prices extended their rally this week, buoyed by growing expectations of Fed rate cuts as recent US labor market data pointed to a slowdown. Weaker job numbers have added to the case for a dovish shift in monetary policy, pressuring the US dollar and making non-yielding assets like silver more attractive.
Geopolitical tensions also boosted safe-haven demand. US President Trump's move to double tariffs on Indian goods, in response to India's continued imports of Russian oil, has heightened uncertainty in global trade. Reports that Trump may meet Russia's President Putin next week to discuss ending the Russia-Ukraine conflict have only added to the geopolitical premium in silver prices.
Meanwhile, political speculation around Fed leadership is beginning to influence sentiment. Trump is expected to nominate a replacement for outgoing Fed Governor Adriana Kugler and is reportedly shortlisting candidates to succeed Jerome Powell when his term is over. The prospect of a more dovish Fed under new leadership has weakened the dollar and offered further support to silver.
From a technical perspective, XAGUSD rebounded above the lower bound of its ascending channel, suggesting the bullish momentum is intact. If the price continues to climb, a break above the 39.50 resistance could open the door to an extended move toward 41.50, which aligns with the channel's upper bound and the 127.2% Fibonacci extension. However, if prices break below key support at 36.00, this would suggest fading momentum and could trigger a deeper retracement toward 34.50.

Silver Welling opportunity.Silver Welling opportunity. Now it seems that silver Is forming symetrical triangle pattern and next one leg down is in the game soon. My TP is 35-35,50.

SILVER: Target Is Up! Long!
My dear friends,
Today we will analyse SILVER together☺️
The price is near a wide key level
and the pair is approaching a significant decision level of 37.822 Therefore, a strong bullish reaction here could determine the next move up.We will watch for a confirmation candle, and then target the next key level of 37.912.Recommend Stop-loss is beyond the current level.
❤️Sending you lots of Love and Hugs❤️

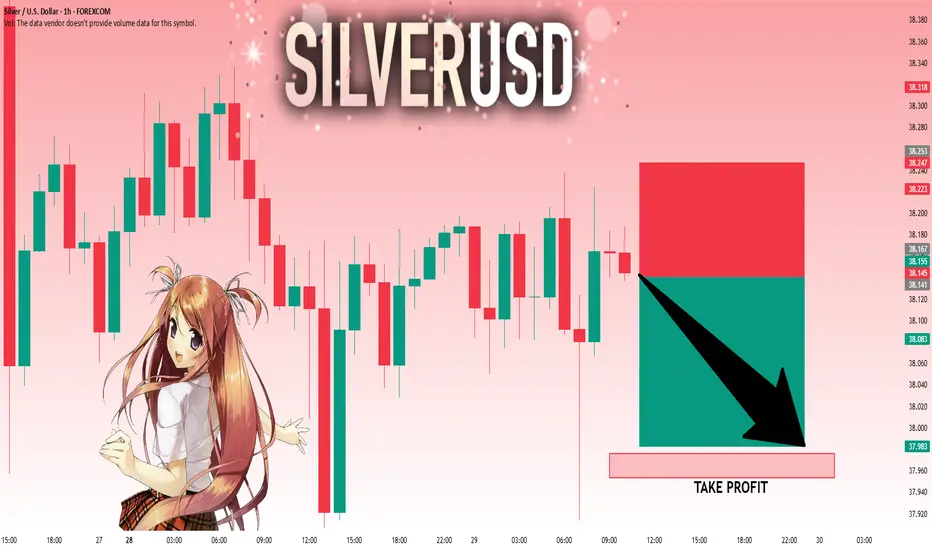
SILVER BEARS WILL DOMINATE THE MARKET|SHORT
SILVER SIGNAL
Trade Direction: short
Entry Level: 3,781.0
Target Level: 3,556.1
Stop Loss: 3,930.5
RISK PROFILE
Risk level: medium
Suggested risk: 1%
Timeframe: 1D
Disclosure: I am part of Trade Nation's Influencer program and receive a monthly fee for using their TradingView charts in my analysis.
✅LIKE AND COMMENT MY IDEAS✅

Silver (XAG/USD) Technical Analysis:Silver maintains a short-term bullish trend and is currently testing the $38.00 resistance zone.
🔹 Bearish Scenario:
If price rejects this level and closes below $37.60, we may see a decline toward $37.30, and possibly $37.00.
🔹 Bullish Scenario:
If price breaks above $38.00 and holds, upside momentum could extend toward $38.30 and $38.80.
⚠️ Disclaimer:
This analysis is not financial advice. It is recommended to monitor the markets and carefully analyze the data before making any investment decisions.

Silver bullish breakout supported at 3600The Silver remains in a bullish trend, with recent price action showing signs of a corrective pullback within the broader uptrend.
Support Zone: 3600 – a key level from previous consolidation. Price is currently testing or approaching this level.
A bullish rebound from 3600 would confirm ongoing upside momentum, with potential targets at:
3756 – initial resistance
3855 – psychological and structural level
3915 – extended resistance on the longer-term chart
Bearish Scenario:
A confirmed break and daily close below 3600 would weaken the bullish outlook and suggest deeper downside risk toward:
3544 – minor support
3480 – stronger support and potential demand zone
Outlook:
Bullish bias remains intact while the silver holds above 3600. A sustained break below this level could shift momentum to the downside in the short term.
This communication is for informational purposes only and should not be viewed as any form of recommendation as to a particular course of action or as investment advice. It is not intended as an offer or solicitation for the purchase or sale of any financial instrument or as an official confirmation of any transaction. Opinions, estimates and assumptions expressed herein are made as of the date of this communication and are subject to change without notice. This communication has been prepared based upon information, including market prices, data and other information, believed to be reliable; however, Trade Nation does not warrant its completeness or accuracy. All market prices and market data contained in or attached to this communication are indicative and subject to change without notice.

Silver is in the Bearish trend after testing ResistanceHello Traders
In This Chart XAGUSD HOURLY Forex Forecast By FOREX PLANET
today XAGUSD analysis 👆
🟢This Chart includes_ (XAGUSD market update)
🟢What is The Next Opportunity on XAGUSD Market
🟢how to Enter to the Valid Entry With Assurance Profit
This CHART is For Trader's that Want to Improve Their Technical Analysis Skills and Their Trading By Understanding How To Analyze The Market Using Multiple Timeframes and Understanding The Bigger Picture on the Charts

SILVER: The Market Is Looking Down! Short!
My dear friends,
Today we will analyse SILVER together☺️
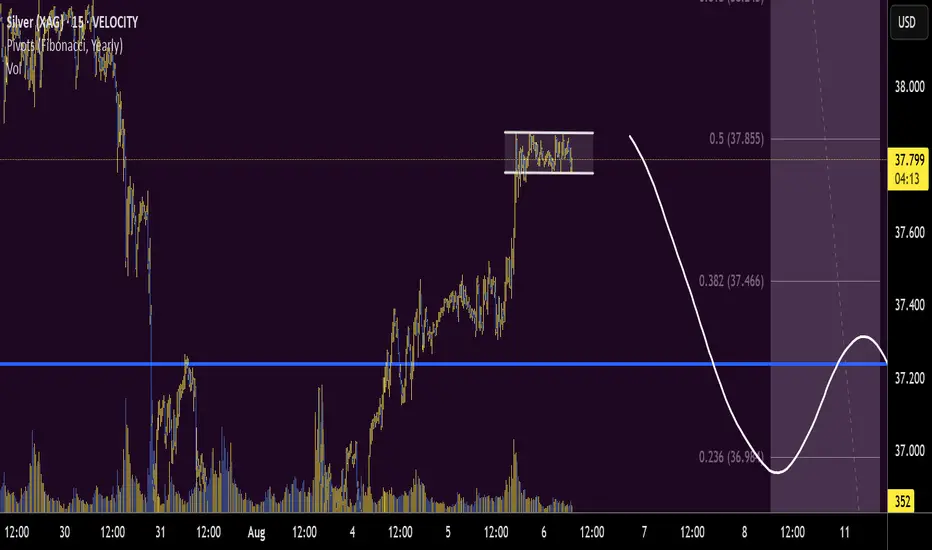
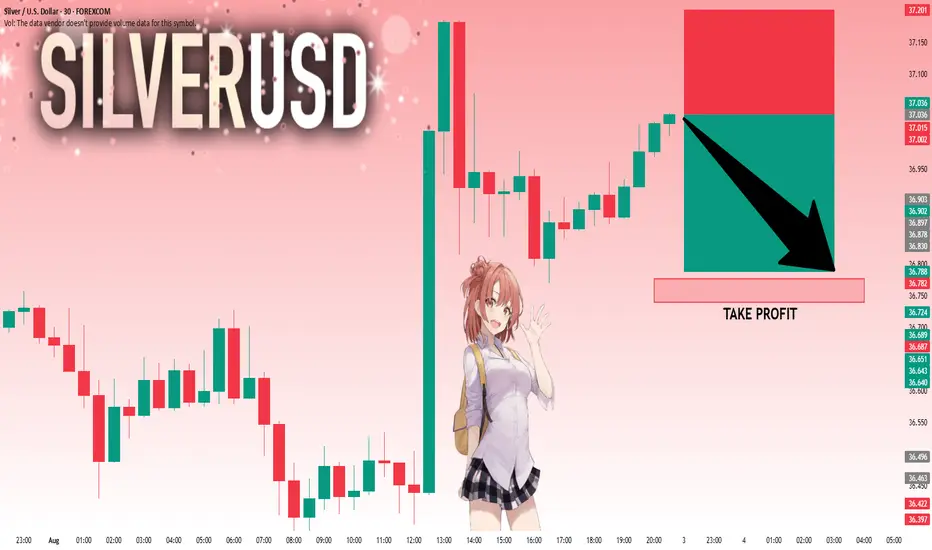
The market is at an inflection zone and price has now reached an area around 37.036 where previous reversals or breakouts have occurred.And a price reaction that we are seeing on multiple timeframes here could signal the next move down so we can enter on confirmation, and target the next key level of 36.788..Stop-loss is recommended beyond the inflection zone.
❤️Sending you lots of Love and Hugs❤️
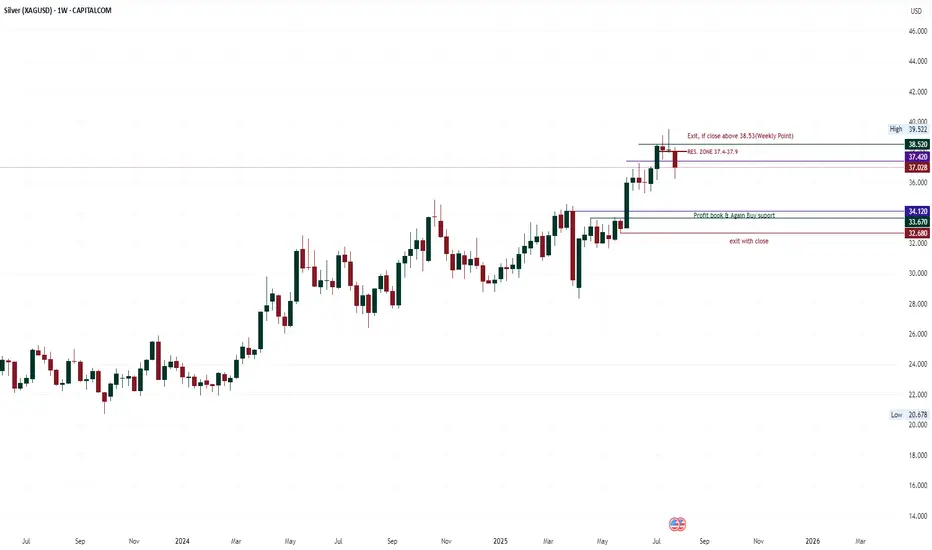
silver correction patternThere has been no close above 38.52 in the last 4 weeks, i.e. every weekend has closed below 38.52. The weekend candle of 7 July is an important candle, apart from this this week's candle has also closed below the low of 14 July, which also indicates a down sign, over all a resistance zone is shown from 37.42 to 37.95. This pattern can go down to 34.1 or 33.67. But use a strict weekend Stop loss of 38.52.
SILVER WILL FALL|SHORT|
✅SILVER is going up now
But a strong resistance level is ahead at 37,60$
Thus I am expecting a pullback
And a move down towards the target of 36,69$
SHORT🔥
✅Like and subscribe to never miss a new idea!✅
Disclosure: I am part of Trade Nation's Influencer program and receive a monthly fee for using their TradingView charts in my analysis.

SILVER: Move Up Expected! Long!
My dear friends,
Today we will analyse SILVER together☺️
The recent price action suggests a shift in mid-term momentum. A break above the current local range around 38.054 will confirm the new direction upwards with the target being the next key level of 38.107 and a reconvened placement of a stop-loss beyond the range.
❤️Sending you lots of Love and Hugs❤️

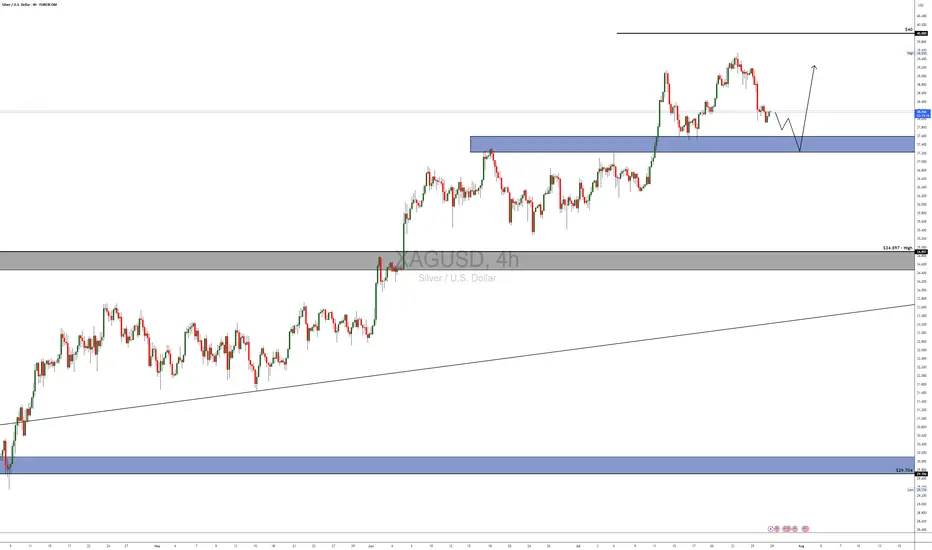
XAGUSD | Silver Rebounds from 37.50 After 39.50 RejectionSilver pulled back sharply after failing at the 39.50 resistance zone. Price is currently consolidating just above the 37.50 support area, which has held firm on the initial retest.
Support at: 37.50 / 37.00 🔽
Resistance at: 39.50 🔼
🔎 Bias:
🔼 Bullish: A clean breakout above 39.50 could resume the uptrend.
🔽 Bearish: A break below 37.50 opens room toward 37.00 and 36.00.
📛 Disclaimer: This is not financial advice. Trade at your own risk.

Do you agree with me for XAGUSD?
Hi my friends
Do you think silver is still bullish?
I think it is bullish for now. Shall we go buy together?

XAGUSD LONG SETUP Silver price is still in a falling wedge pattern after creating the minor Ascending wedge and couldn't breakout further, so still consolidating in the wedge, so will see to which side proce decides to break.

SILVER: The Market Is Looking Down! Short!
My dear friends,
Today we will analyse SILVER together☺️
The recent price action suggests a shift in mid-term momentum. A break below the current local range around 38.167 will confirm the new direction downwards with the target being the next key level of 37.976 .and a reconvened placement of a stop-loss beyond the range.
❤️Sending you lots of Love and Hugs❤️
SILVER Will Grow! Buy!
Please, check our technical outlook for SILVER.
Time Frame: 8h
Current Trend: Bullish
Sentiment: Oversold (based on 7-period RSI)
Forecast: Bullish
The market is approaching a significant support area 3,817.6.
The underlined horizontal cluster clearly indicates a highly probable bullish movement with target 3,930.1 level.
P.S
The term oversold refers to a condition where an asset has traded lower in price and has the potential for a price bounce.
Overbought refers to market scenarios where the instrument is traded considerably higher than its fair value. Overvaluation is caused by market sentiments when there is positive news.
Disclosure: I am part of Trade Nation's Influencer program and receive a monthly fee for using their TradingView charts in my analysis.
Like and subscribe and comment my ideas if you enjoy them!


BUY TRADE SETUP ON XAGUSDCheck this buy trade setup i got on SILVER.
Anticipate a retest of the demands zone at 37.45 zone and plan for a buy entry there.
A Swing Trade Plan.
SILVER: Strong Growth Ahead! Long!
My dear friends,
Today we will analyse SILVER together☺️
The in-trend continuation seems likely as the current long-term trend appears to be strong, and price is holding above a key level of 38.099 So a bullish continuation seems plausible, targeting the next high. We should enter on confirmation, and place a stop-loss beyond the recent swing level.
❤️Sending you lots of Love and Hugs❤️
