Silver Market Recap: Q2 2025 HighlightsSilver prices hit a 14-year peak in Q2 of 25 due to global uncertainties and a tight supply-demand balance. Although it shares some similar drivers with gold, silver has carved its own path, which one charged by robust industrial demand and its safe-haven appeal amid economic and geopolitical turbulence.
Silver’s Price Journey
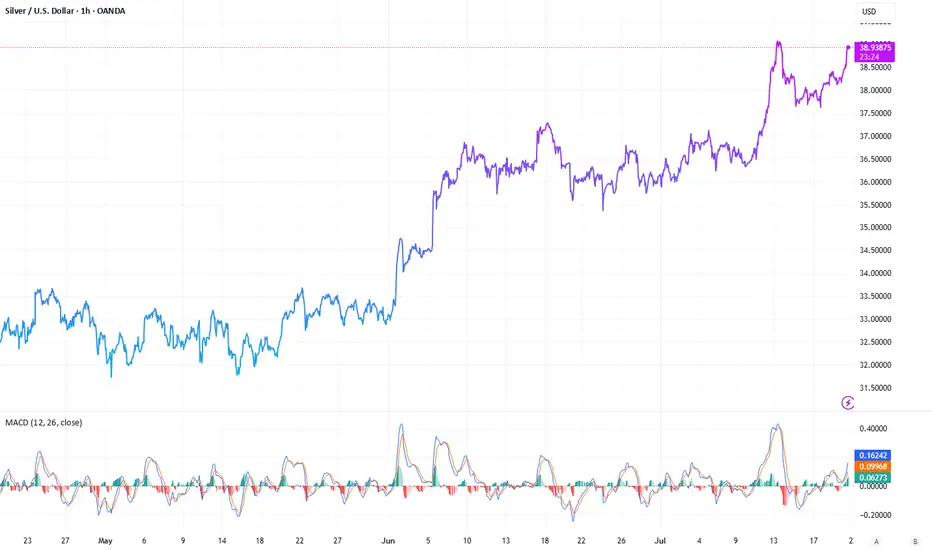
The quarter kicked off with a dip, silver fell from $33.77 per ounce on April 2 to $29.57 by April 4. But then, it quickly regained traction, crossing $30 by April 9 and peaking at $33.63 on April 23. May brought volatility, with prices swinging between $32.05 on May 2 and $33.46 on May 23. June marked a turning point: silver surging to $36.76 by June 9 and reaching a year-to-date high of $37.12 on June 17. By the quarter’s end, prices stabilized between $36 and $37, holding strong into July.
Supply Squeeze Meets Rising Demand
Silver’s rally was underpinned by a persistent supply deficit. The Silver Institute’s World Silver Survey (April 16, 2025) reported record demand of 680.5 million ounces in 2024, driven by industries like solar energy, artificial intelligence, and electric vehicles. Meanwhile, mine production lagged, creating a 148.9-million-ounce shortfall-the fourth consecutive year of deficits. Some experts may say that we’re seeing flat supply and demand outpacing it by nearly 20%. Aboveground stockpiles have dwindled by 800 million ounces over four years-equivalent to a full year’s mine output. They call it a “perfect storm” for silver’s price trajectory.
Geopolitical and Economic Catalysts
Global tensions are having a very noticeable impact on the dynamics of silver. Escalating conflicts, including Israel’s June 12 and June 21 strikes on Iranian nuclear sites, heightened fears of disrupted trade and energy flows, just boosting this way silver’s safe-haven appeal. Meanwhile, the BRICS bloc’s push to reduce reliance on the U.S. dollar, including Russia’s proposal for a precious metals exchange, added further momentum. U.S. trade policies, particularly President Trump’s fluctuating tariffs, introduced volatility. The April 2 “Liberation Day” tariff announcement sparked fears of a recession, briefly pushing silver prices down due to its industrial exposure. I guess that any recession-driven dip would be short-lived, with silver buoyed by broader precious metals strength and a weaker U.S. dollar.
Industrial Demand in the Spotlight
Unlike gold, silver’s industrial role amplified its price movements. Its use in photovoltaics, military components, and energy infrastructure has surged, with national security priorities in the U.S. and elsewhere driving demand. Economist Dr. Nomi Prins states the following: “Silver’s industrial applications-especially in energy and defense-are outpacing supply. Geopolitical shifts are cementing its role beyond a traditional safe-haven asset.”
What’s Next for Silver?
Looking ahead, analysts remain optimistic. Some predicts, that silver will hold above $35, potentially reaching $40 by year-end, with a stronger dollar as a possible headwind. Speaking about long-term, they see the gold-silver ratio (currently 92:1, compared to a 50-year average of 60:1) narrowing to 40:1 or lower, potentially pushing silver past $100 per ounce in the next few years. Although a global recession could temper industrial demand, safe-haven buying and ongoing supply constraints are expected to provide support. Geopolitical tensions and trade disputes, particularly between the U.S. and China, are unlikely to fade, which will only increase the attractiveness of silver.
Silver's performance reflects the dynamic interplay between industrial demand, supply shortages, and global uncertainties. With favorable fundamentals and geopolitical conditions, silver is poised for continued strength in the second half of 2025, assuming recession risks remain manageable.
XAGUSD01 trade ideas
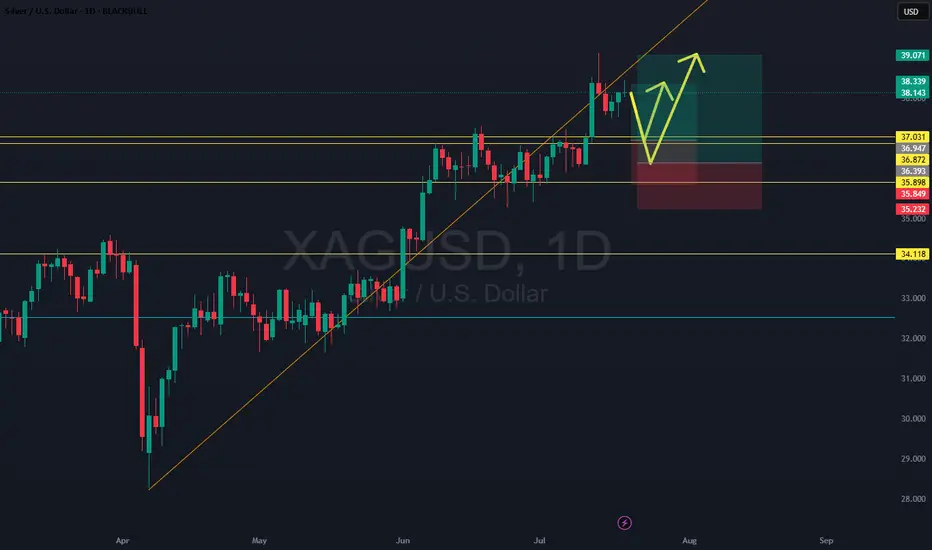
XAGUSD Holding Trendline With Support From Key Demand Zones📈 XAGUSD Holding Trendline Support, Eyes on Breakout
Silver continues to trade within a strong bullish structure, holding above a rising trendline and building pressure near recent highs. With support clearly defined and momentum intact, bulls are eyeing a potential breakout continuation. This update outlines the trend context, support zones, and fundamental backdrop.
🔍 Technical Analysis:
XAGUSD is respecting a steep ascending trendline from mid-June, holding structure despite multiple retests. Price recently bounced cleanly from trend support and is now pushing toward prior highs.
The bullish trend remains valid as long as this structure is defended. A close above recent resistance could unlock further upside potential.
🛡️ Support Zones (if pullback occurs):
🟢 Daily Support – Good Entry
Clearly respected zone labeled on your chart. Strong daily demand.
🟡 Weekly Support – Great Entry
Macro support area from prior consolidation. Viewed as a strong swing entry zone.
🔼 Resistance Zone:
🔴 Local High / Recent Resistance
No breakout yet — bulls must reclaim this zone to confirm continuation.
🧭 Outlook:
Bullish Case:
Holding the rising trendline + reclaiming highs would likely trigger further upside movement.
Bearish Case:
Break of the trendline + loss of daily support would open the door to deeper correction.
Bias:
Bullish while structure holds and daily/weekly support levels remain intact.
🌍 Fundamental Insight:
Silver is benefiting from firm industrial demand and a softening U.S. Dollar. Inflation hedging and ETF inflows also continue to support the bullish case. However, upcoming Fed commentary and CPI releases may trigger volatility, especially near resistance.
✅ Conclusion:
XAGUSD is maintaining its bullish trend, supported by well-defined daily and weekly demand zones. As long as the ascending trendline holds, the momentum favors further upside. Bears only take control if structure breaks and demand zones fail.
Not financial advice. Like & follow for more structured market updates.

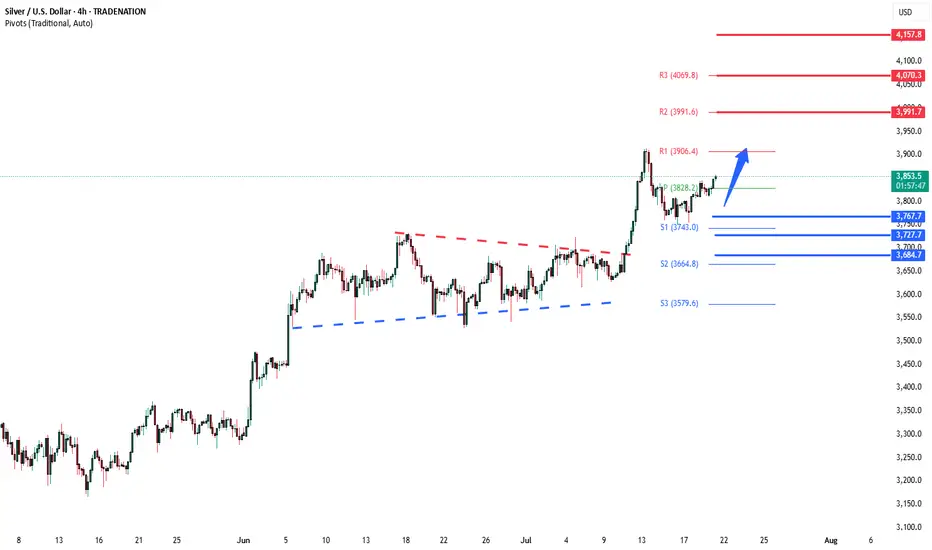
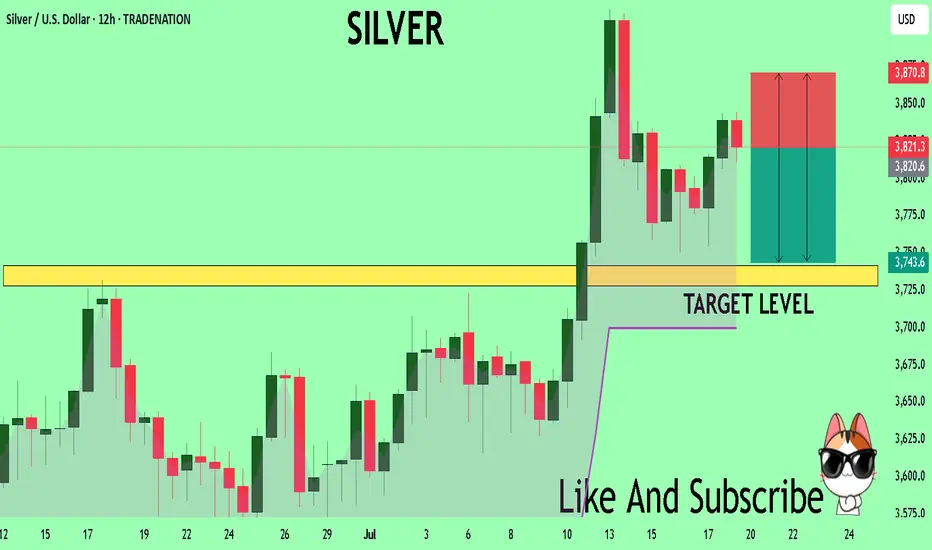
Silver Bullish continuation breakout supported at 3686The Silver remains in a bullish trend, with recent price action showing signs of a continuation breakout within the broader uptrend.
Support Zone: 3686 – a key level from previous consolidation. Price is currently testing or approaching this level.
A bullish rebound from 3686 would confirm ongoing upside momentum, with potential targets at:
3814 – initial resistance
3865 – psychological and structural level
3920 – extended resistance on the longer-term chart
Bearish Scenario:
A confirmed break and daily close below 3686 would weaken the bullish outlook and suggest deeper downside risk toward:
3645 – minor support
3590 – stronger support and potential demand zone
Outlook:
Bullish bias remains intact while the Silver holds above 3686. A sustained break below this level could shift momentum to the downside in the short term.
This communication is for informational purposes only and should not be viewed as any form of recommendation as to a particular course of action or as investment advice. It is not intended as an offer or solicitation for the purchase or sale of any financial instrument or as an official confirmation of any transaction. Opinions, estimates and assumptions expressed herein are made as of the date of this communication and are subject to change without notice. This communication has been prepared based upon information, including market prices, data and other information, believed to be reliable; however, Trade Nation does not warrant its completeness or accuracy. All market prices and market data contained in or attached to this communication are indicative and subject to change without notice.
Silver Holds Near $38.40 with Bullish MomentumAs of July 21, 2025, silver (XAG/USD) trades between $38.20 and $38.40, maintaining its upward trend. Key resistance is at $38.50; a break above could lead to $39.10–$40.00. Strong support is at $37.00 and $36.80. The RSI is nearing overbought, suggesting a possible short-term correction.
Upcoming U.S. CPI and PPI data may raise Fed rate cut expectations, supporting silver. Geopolitical risks and U.S. trade policies are supporting safe-haven demand, while strong industrial use in renewable energy and electronics also supports prices. The medium-term outlook remains positive.
Silver faces resistance at 38.50, with higher levels at 39.50 and 40.10. Support is found at 37.20, followed by 36.85 and 35.50.
SILVER SELLERS WILL DOMINATE THE MARKET|SHORT
SILVER SIGNAL
Trade Direction: short
Entry Level: 3,612.8
Target Level: 3,572.6
Stop Loss: 3,639.3
RISK PROFILE
Risk level: medium
Suggested risk: 1%
Timeframe: 2h
Disclosure: I am part of Trade Nation's Influencer program and receive a monthly fee for using their TradingView charts in my analysis.
✅LIKE AND COMMENT MY IDEAS✅

XAGUSD in Uptrend ContinuationBuy Limit
Entry Price 38.10
Stop Loss 37.86
Risk 1%
Lot Size 0.21
TP (1RR) 38.34
TP (4RR) 39.06

Final Phase of Circle Wave 3 XAG/USDFXOPEN:XAGUSD
We’re currently in the final stages of Circle Wave 3, which has developed through a series of 1–2–3 structures and internal ABC corrections.
Right now, we’re within the yellow count, moving from Wave 4 to Wave 5 – typically unfolding as an ABC structure.
🟡 Zooming In: Current Setup
✅ Wave A (of 4→5) is already complete – it formed as its own ABC
🔄 We’re currently transitioning from A → B
📈 A short-term move up is likely before a short entry targeting the final Wave C of 5
📏 Key Fibonacci Confluence Zone
I’ve marked the 71% extension level in green – it aligns perfectly with my broader Fibonacci target zone, where we could see the highest volume come in
My personal limit sell is at 37,700, inside this confluence zone
🛑 Stop-loss: 37,500 (below Wave 4)
🎯 Take-profit: Around 39,260, though this area could extend higher depending on momentum
💡 Trade Idea Summary
A clean, simple setup:
Look for upside push (Wave B)
Set limit short in the Fib zone (green area)
Watch for reversal into Wave C to complete Circle Wave 3
After that, I’ll be looking for mid- to long-term short setups 🔽

Silver Breakout: Retest & Launch? Two Entries, One Bullish BiasSilver’s uptrend is alive and kicking—with the daily breakout confirming bullish momentum. Price looks primed for a retest before a potential aggressive push toward new highs. We’re eyeing two entry scenarios: a conservative play with higher fill probability and a more aggressive setup with better structural protection but less chance of triggering. Both setups align with the same core thesis—momentum is strong, and this breakout could accelerate.
SILVER ( XAGUSD ): Still Bullish! Take The Buy Setups!In this Weekly Market Forecast, we will analyze the XAGUSD (SILVER) for the week of July 21-25th.
Silver remains a Strong Buy rating. There is no technical reason to look for shorts. Only buys right now, until we see a bearish break of structure. Then sells can be considered.
That having been said, like Gold, there is a 4H +FVG that we are watching. If it holds, higher prices will ensue. If it fails, the lows become the draw on liquidity.
We'll soon see how it plays out.
Enjoy!
May profits be upon you.
Leave any questions or comments in the comment section.
I appreciate any feedback from my viewers!
Like and/or subscribe if you want more accurate analysis.
Thank you so much!
Disclaimer:
I do not provide personal investment advice and I am not a qualified licensed investment advisor.
All information found here, including any ideas, opinions, views, predictions, forecasts, commentaries, suggestions, expressed or implied herein, are for informational, entertainment or educational purposes only and should not be construed as personal investment advice. While the information provided is believed to be accurate, it may include errors or inaccuracies.
I will not and cannot be held liable for any actions you take as a result of anything you read here.
Conduct your own due diligence, or consult a licensed financial advisor or broker before making any and all investment decisions. Any investments, trades, speculations, or decisions made on the basis of any information found on this channel, expressed or implied herein, are committed at your own risk, financial or otherwise.

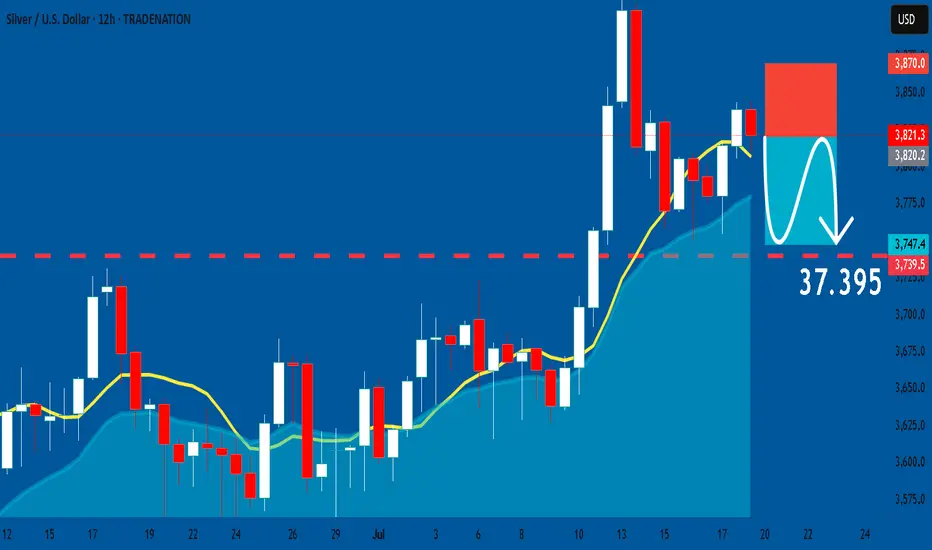
SILVER: Short Trade with Entry/SL/TP
SILVER
- Classic bearish setup
- Our team expects bearish continuation
SUGGESTED TRADE:
Swing Trade
Short SILVER
Entry Point - 38.213
Stop Loss - 38.700
Take Profit - 37.395
Our Risk - 1%
Start protection of your profits from lower levels
Disclosure: I am part of Trade Nation's Influencer program and receive a monthly fee for using their TradingView charts in my analysis.
❤️ Please, support our work with like & comment! ❤️

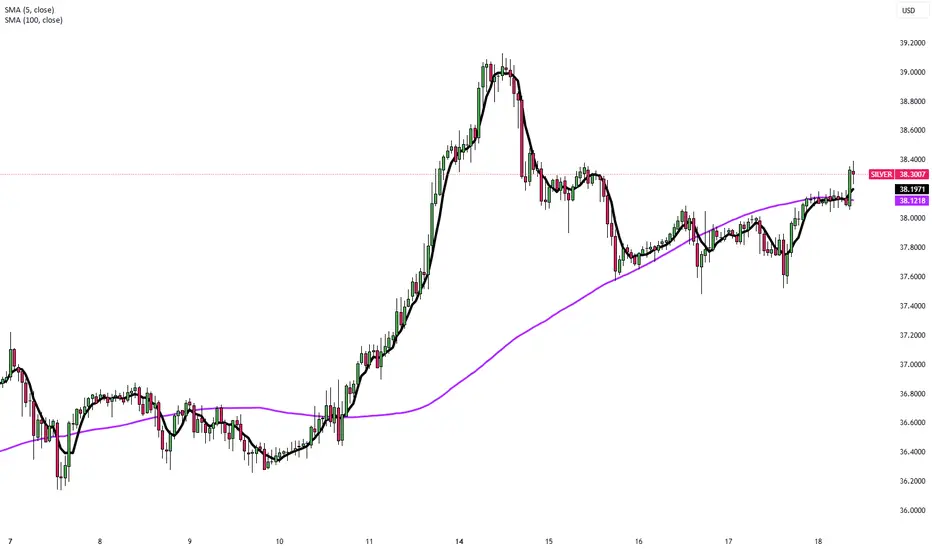
Bullish Daily Chore Strategy Entry on SilverFirst time I've spoken about this strategy here (as I don't personally trade it myself), but the "Daily Chore" is a very popular one amongst the traders I work with.
Essentially what we're looking for is for price action to be on the correct side of our 3 EMA's (8, 20 & 50), and for those EMA's to be running in the correct order.
If so, we are then looking for a pullback into the EMA's and for a pin bar rejection candles to give us a sign for entry.
This is a very difficult strategy to figure out as it requires a lot of testing and tweaks to optimize, but it also allows for a lot for freedom as it only requires a few minutes a day to check up on.
Please leave any questions or comments below and make sure to give me a follow so you don't miss my next shared trading idea.
Akil

SILVER Massive Short! SELL!
My dear subscribers,
SILVER looks like it will make a good move, and here are the details:
The market is trading on 38.213 pivot level.
Bias - Bearish
My Stop Loss - 38.708
Technical Indicators: Both Super Trend & Pivot HL indicate a highly probable Bearish continuation.
Target - 37.413
About Used Indicators:
The average true range (ATR) plays an important role in 'Supertrend' as the indicator uses ATR to calculate its value. The ATR indicator signals the degree of price volatility.
Disclosure: I am part of Trade Nation's Influencer program and receive a monthly fee for using their TradingView charts in my analysis.
———————————
WISH YOU ALL LUCK

SILVER: Strong Bullish Sentiment! Long!
My dear friends,
Today we will analyse SILVER together☺️
The in-trend continuation seems likely as the current long-term trend appears to be strong, and price is holding above a key level of 38.281 So a bullish continuation seems plausible, targeting the next high. We should enter on confirmation, and place a stop-loss beyond the recent swing level.
❤️Sending you lots of Love and Hugs❤️

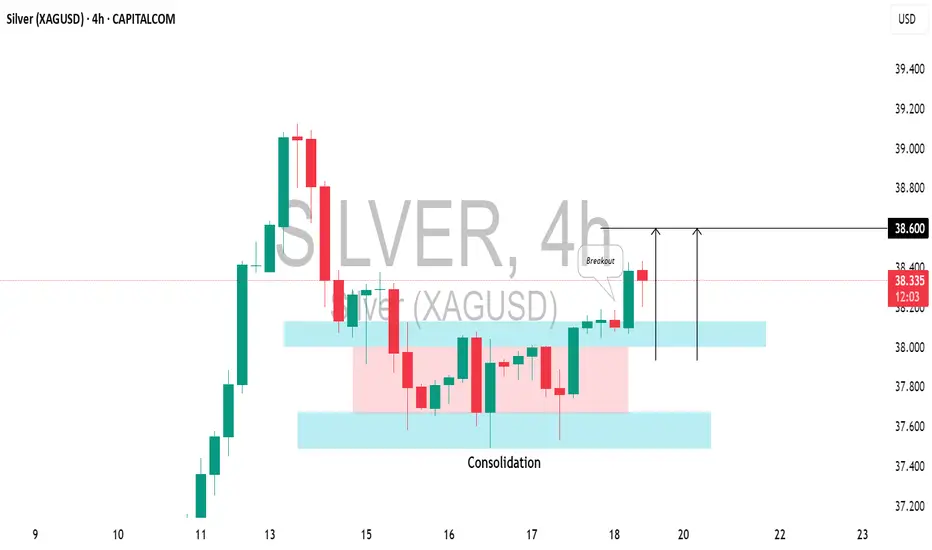
SILVER (XAGUSD): Bullish Move ConfirmedIt appears that the local correction on 📈SILVER has completed, and the pair is shifting back to a bullish trend.
Today's US economic data caused the pair to break through a resistance level within a narrow consolidation range on the 4-hour chart.
The price is expected to rise to the 38.60 level.
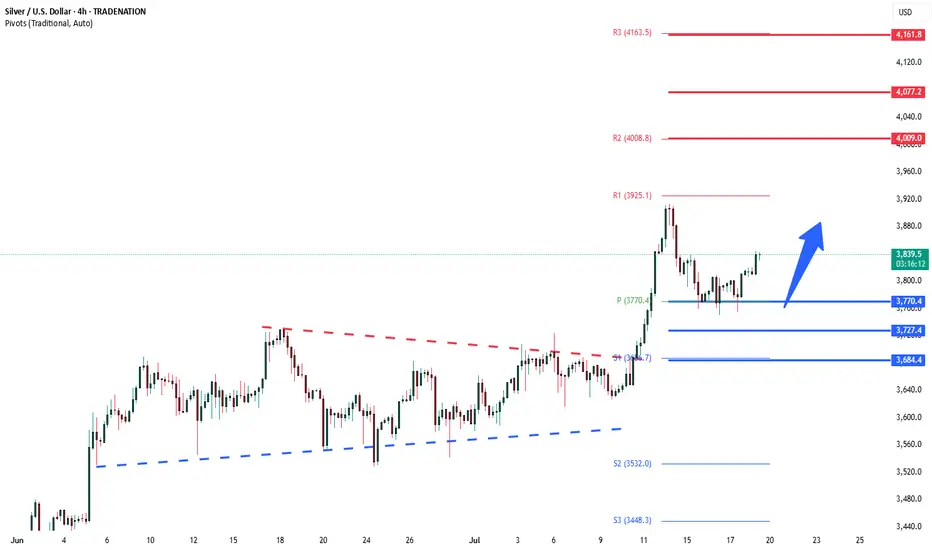
Silver bullish above 3770The Silver remains in a bullish trend, with recent price action showing signs of a continuation breakout within the broader uptrend.
Support Zone: 3770 – a key level from previous consolidation. Price is currently testing or approaching this level.
A bullish rebound from 3770 would confirm ongoing upside momentum, with potential targets at:
4000 – initial resistance
4077 – psychological and structural level
4160 – extended resistance on the longer-term chart
Bearish Scenario:
A confirmed break and daily close below 3770 would weaken the bullish outlook and suggest deeper downside risk toward:
3727 – minor support
3685 – stronger support and potential demand zone
Outlook:
Bullish bias remains intact while the Silver holds above 3770. A sustained break below this level could shift momentum to the downside in the short term.
This communication is for informational purposes only and should not be viewed as any form of recommendation as to a particular course of action or as investment advice. It is not intended as an offer or solicitation for the purchase or sale of any financial instrument or as an official confirmation of any transaction. Opinions, estimates and assumptions expressed herein are made as of the date of this communication and are subject to change without notice. This communication has been prepared based upon information, including market prices, data and other information, believed to be reliable; however, Trade Nation does not warrant its completeness or accuracy. All market prices and market data contained in or attached to this communication are indicative and subject to change without notice.
SILVER - NEW BREAKOUT !Hello Traders !
The Silver price formed a bullish descending triangle!
Currently, the resistance level (37.50 - 36.50) is broken!
This key level becomes new support level!
So, I expect a new bullish move🚀
______________
TARGET: 41.50🎯

Silver Rebounds Toward $38 as Dollar EasesSilver rebounded toward $38 per ounce on Friday, recovering from a two-day decline as the U.S. dollar and Treasury yields eased. The move reflected shifting sentiment on Fed policy and trade conditions after earlier losses sparked by inflation data that reduced hopes for near-term rate cuts.
U.S. stock futures edged higher following record closes for the S&P 500 and Nasdaq, driven by strong retail sales, lower jobless claims, and optimism in AI-related tech stocks after Taiwan Semiconductor’s positive forecast. On monetary policy, Fed officials remain divided: Mary Daly expects two rate cuts this year, while Adriana Kugler urges caution due to tariff-driven inflation. President Trump reinforced trade tensions by sending letters to over 20 partners setting new tariffs between 20% and 40%.
In corporate updates, United Airlines expects stronger earnings in the second half of 2025, and Chevron signaled higher future cash flow as production in its top U.S. oil field nears a plateau.
Resistance is at 38.50, while support holds at 37.20.
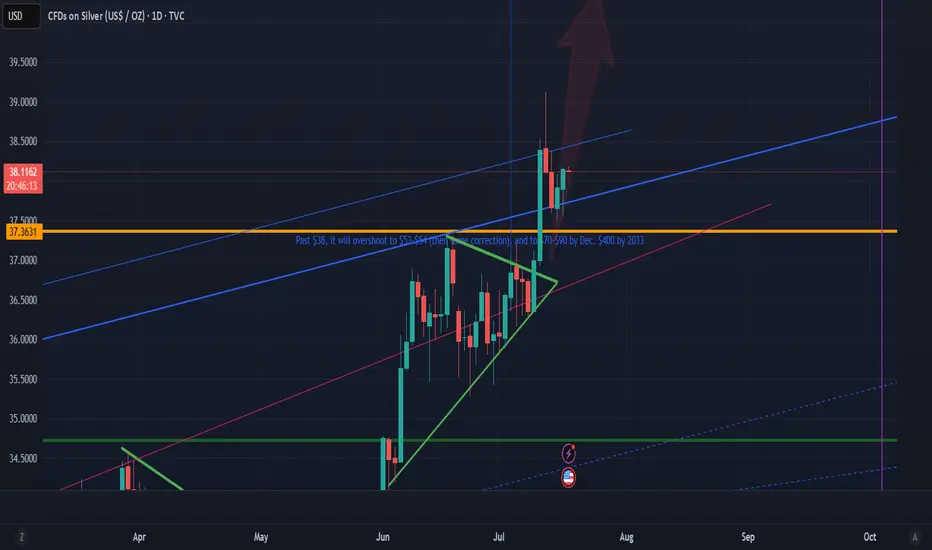
Vertical spike to blow past 50 is imminent Vertical spike to blow past 50 is imminent. It may not stop maybe until $70. Banks is running out of SLV stocks to short silver. Get ready.... This moment will never happen again. Position position NOW.
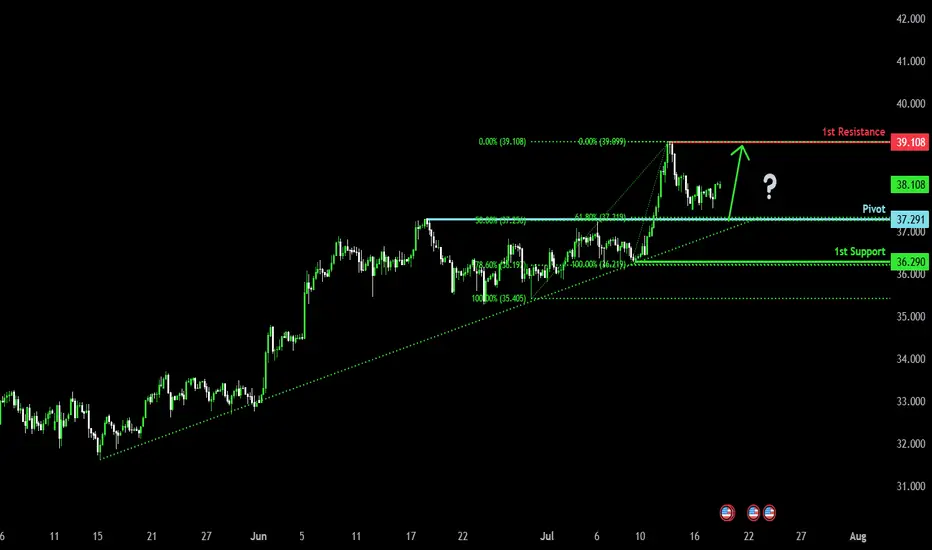
Bullish continuation?The Silver (XAG/USD) is falling towards the pivot and could bounce to the 1st resistance which has been identified as a pullback resistance.
pivot: 37.29
1st Support: 36.29
1st Resistance: 39.10
Risk Warning:
Trading Forex and CFDs carries a high level of risk to your capital and you should only trade with money you can afford to lose. Trading Forex and CFDs may not be suitable for all investors, so please ensure that you fully understand the risks involved and seek independent advice if necessary.
Disclaimer:
The above opinions given constitute general market commentary, and do not constitute the opinion or advice of IC Markets or any form of personal or investment advice.
Any opinions, news, research, analyses, prices, other information, or links to third-party sites contained on this website are provided on an "as-is" basis, are intended only to be informative, is not an advice nor a recommendation, nor research, or a record of our trading prices, or an offer of, or solicitation for a transaction in any financial instrument and thus should not be treated as such. The information provided does not involve any specific investment objectives, financial situation and needs of any specific person who may receive it. Please be aware, that past performance is not a reliable indicator of future performance and/or results. Past Performance or Forward-looking scenarios based upon the reasonable beliefs of the third-party provider are not a guarantee of future performance. Actual results may differ materially from those anticipated in forward-looking or past performance statements. IC Markets makes no representation or warranty and assumes no liability as to the accuracy or completeness of the information provided, nor any loss arising from any investment based on a recommendation, forecast or any information supplied by any third-party.
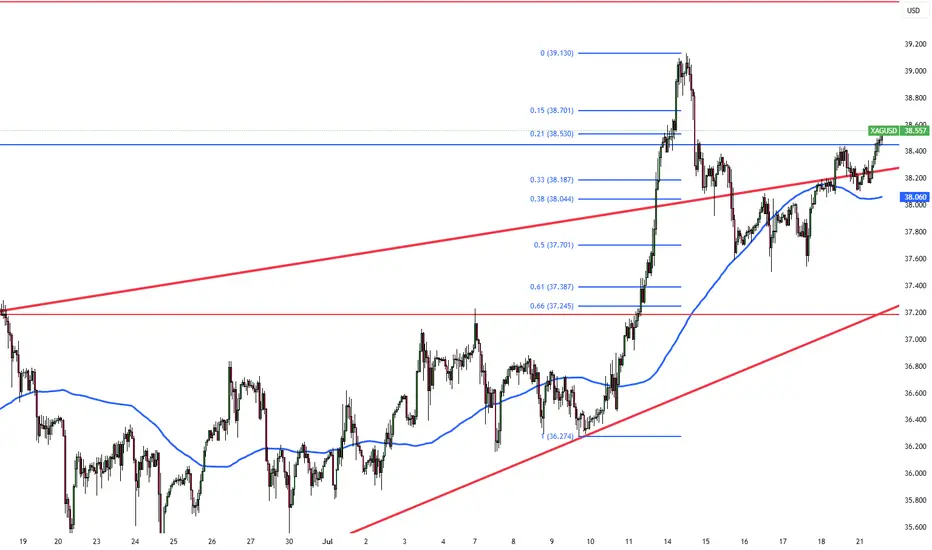
Silver (XAGUSD) – Watch for Bullish Reaction at Key Liquidity ZoDescription:
Silver is now approaching a key liquidity and structural support zone between 37.2805 and 36.8841 (marked by the bottom two blue lines on the chart). This area is likely to attract significant attention, with the potential for stop-losses of buyers below the prior structure to be triggered—a classic liquidity grab scenario.
Trading Idea:
Do NOT enter blindly at these levels.
Wait for price to dip into the 37.28–36.88 range, ideally triggering a liquidity sweep and a spike in volume.
Only consider a long entry after a clear bullish reaction in this zone—such as a strong reversal candle, a bullish engulfing, or a pronounced uptick in net volume.
For extra confirmation, look for a retest of the zone after the first reaction, to confirm that the level is holding as support.
Risk Management:
Stop-loss below the lower end of the entry zone (under 36.88) or the liquidity sweep low.
Target the next resistance levels: 37.88, 38.40, and 38.99–39.00.
Key Points:
The 37.28–36.88 area is a liquidity zone—expect increased volatility and potential for fake-outs.
Wait for confirmation and ideally a retest before considering entry.
Ignore the entry zone if price simply breaks through without a bullish reaction.
Summary:
Let price sweep liquidity and show its hand in the 37.28–36.88 zone. Only enter on clear bullish confirmation and a solid retest. Trade what you see, not what you hope for!
