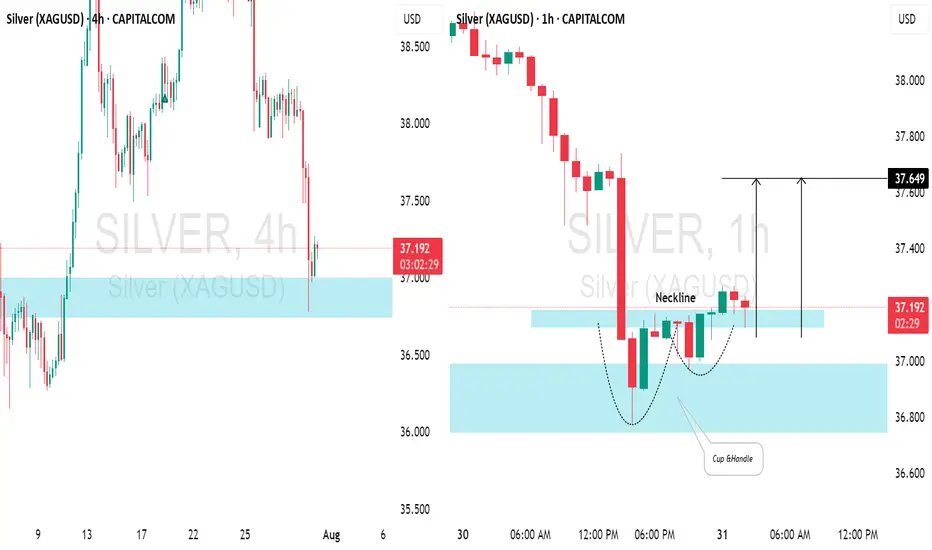
SILVER (XAGUSD): Time for Pullback📈SILVER appears to be oversold following yesterday's decline.
After testing a significant daily / intraday support level, there's a noticeable bullish reversal.
The price formed a cup & handle pattern on the hourly chart and has broken above its neckline. We can expect a pullback to at least 37.64.
XAGUSDG trade ideas
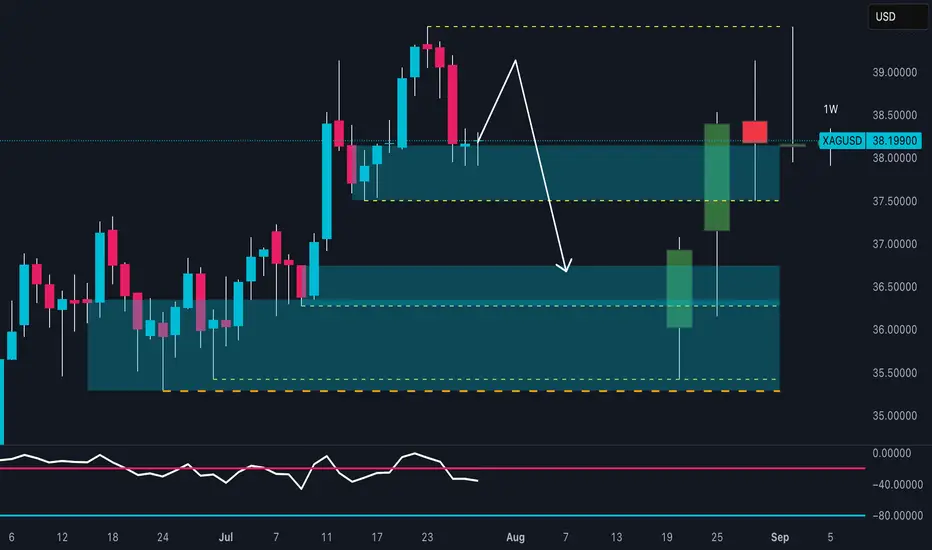
#XAGUSD: A Strong Bullish Move, Possible Target at $45?Silver is currently experiencing a correction, but the overall price remains bullish. Analysing the data, we can see a potential price reversal in our area of interest. Following the recent higher high, price is poised to create another record high. We should closely monitor volume and price behaviour. A strong volume signal would indicate a potential bullish move in the future.
Good luck and trade safely.
Like and comment for more!
Team Setupsfx_

SILVER Is About to Collapse? Watch This Critical Supply Zone!Price recently tapped a high near 39.20 before sharply rejecting from the 38.80–39.20 supply zone, confirming strong selling pressure. The current structure shows:
- Supply zone tested and rejected
- Likely return to the previous demand zone (36.50–36.00)
- RSI is turning down, confirming loss of momentum
A pullback toward 38.30–38.50, followed by a bearish continuation toward the 36.50 area, which acts as a key structural and institutional support.
🗓️ Seasonality
Historically, July is bullish for silver:
Last 5Y average: +0.89%
Last 2Y average: +2.18%
However, August–September are bearish months:
August: mildly positive, but weak
September: consistently negative across all time frames (-0.86% to -1.10%)
This increases the probability of a downward move starting in early August, in line with current price action rejection.
🪙 Commitment of Traders (COT) – July 22
Non-Commercials (speculators):
Longs: +656
Shorts: -516
Commercials (hedging):
Longs: +1,337
Shorts: +916
➡️ Commercials are increasing both long and short exposure, while non-commercials remain net long — a sign of moderate optimism.
However, long positioning is slowing down compared to previous weeks. A potential exhaustion in bullish momentum is forming.
📉 Sentiment
52% short vs 48% long
Volume: more lots on the short side (492 vs 454)
Sentiment remains neutral to slightly contrarian bullish, but not extreme. This may allow for a fake breakout before a deeper move down.
🧩 Operational Summary
Main bias: Bearish short to mid-term (starting August), supported by:
- Technical rejection at supply
- Negative seasonal tendencies ahead
- RSI showing momentum loss
- COT showing stabilization, not accumulation
XAGUSD: Correction May Be Over – Watch $37.60 BreakoutAfter reaching a local top around the $39.50 zone on July 24, Silver entered a normal corrective phase, with price dropping over 3,000 pips from top to bottom — roughly an 8% retracement.
📉 Despite the strength of the drop, the structure was clearly corrective, not impulsive. Even more, the move formed a descending broadening wedge, a pattern that often hints at a potential reversal.
📈 Yesterday, we saw a clean breakout above the wedge’s upper boundary — which may signal the end of the correction.
At the time of writing, price is trading at $37.45, right under a key horizontal resistance zone between $37.50 and $37.60.
A breakout above this level would confirm the low and likely initiate a new move toward the $38.70 resistance.
________________________________________
🎯 Summary & Plan:
• A break above $37.60 = bullish confirmation
• Target: $38.70 (first resistance)
• Invalidation: If price drops below $37, bulls lose control
As long as price holds above the $37 zone, the technical outlook remains constructive, and traders could consider setups aligned with the upside scenario. 🚀
Disclosure: I am part of TradeNation's Influencer program and receive a monthly fee for using their TradingView charts in my analyses and educational articles.

When Gold Believers Flip – Uncle Jimmy, Silver & New Safe Havens💰📉 When Gold Believers Flip – Uncle Jimmy, Silver, and the New Safe Havens 🧠🔄
Let me tell you a story that says more than any chart ever could.
📜 Meet Uncle Jimmy (from Canada) . He’s not really my uncle, but out of respect, that’s what I call him.
A true OG — early stockbroker, big mustache , 20+ apartments, a life built on commissions, charts, and one sacred truth: '' Gold never lies. ''
He's bought gold at every dip, every crisis, every whisper of war or inflation.
But now?
“I’m thinking of selling gold to buy silver.” ( WHAT?! 😳👀💥)
That’s it. That’s the moment.
📉 A gold maxi flipping into silver. A generational pivot.
And that’s the real divergence the chart doesn’t always show.
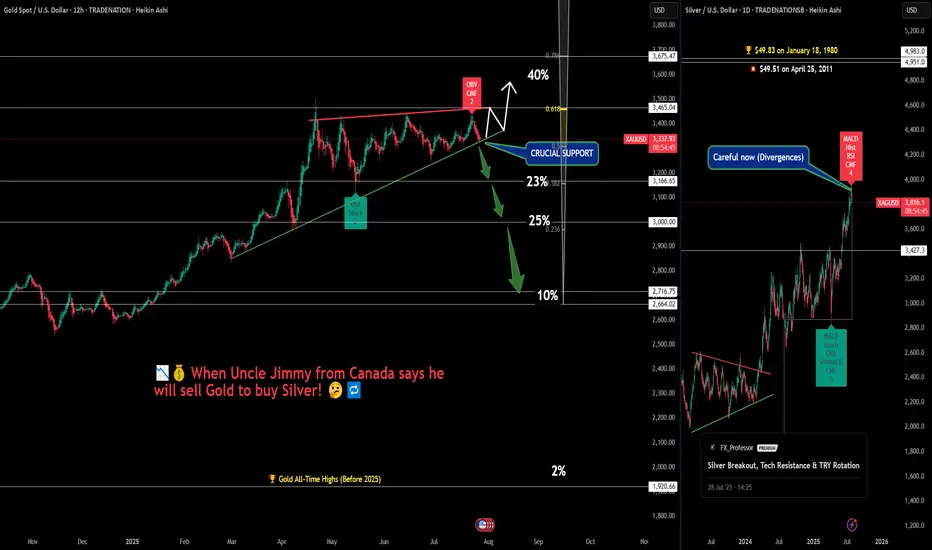
⚖️ Macro Sentiment Rotation:
📊 Gold
Sitting on crucial support. Breakout potential to $3,465+ remains — but divergences (OBV, CMF) are stacking. A breakdown? Targets stretch down to $3,000 or even $2,716.
🪙 Silver
Just hit $38.14 — now eyeing the legendary $49.83 ATH from 1980. Legacy capital rotating in. Silver’s moment? (My chart says 'wait a bit'...divergences!)
💻 NASDAQ/Tech
Some now call it the “new safe haven” — not because of bonds, but because of trust in corporate resilience vs. geopolitical chaos. When Nasdaq rises, silver often outperforms gold — risk appetite returns, and so does industrial metal demand.
₿ Bitcoin
And then there’s Bitcoin…
The safe haven that legacy minds still don’t trust.
I told Uncle Jimmy to buy it at:
→ $4,000
→ $18,000
→ $45,000
→ Even $70,000.... I stopped doing that at some point, he just wouldn't get it, or wouldn't make a move into the 'crypto unknown'. Respect!
So...He never did. Maybe Bitcoin just became what gold once was — but for the next generation. Not for Big Jimmy.
🧠 What to Watch:
Sentiment is shifting
Safe havens are evolving
Charts show structure — but stories show psychology
Whether you're long metals, crypto, or tech — the key is knowing when beliefs break and rotations begin.
Watch price. Listen to sentiment. And never underestimate Uncle Jimmy.
What would you tell Jimmy today if he was your uncle? Let me know below!
One Love,
The FX PROFESSOR 💙
Disclosure: I am happy to be part of the Trade Nation's Influencer program and receive a monthly fee for using their TradingView charts in my analysis. Awesome broker, where the trader really comes first! 🌟🤝📈
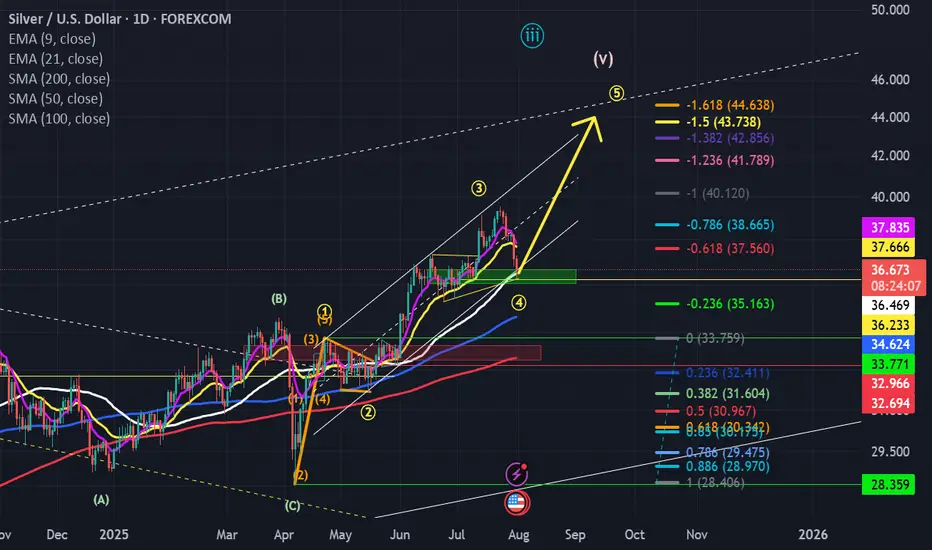
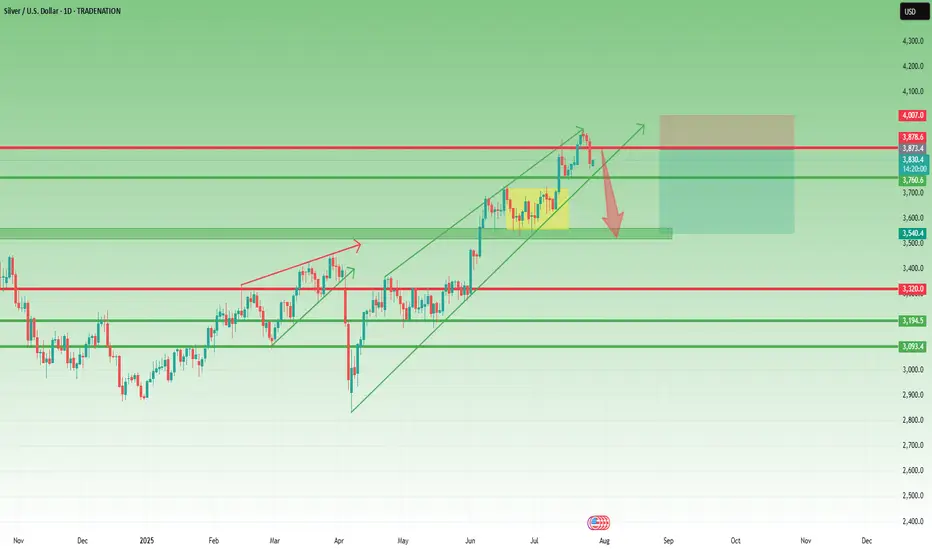
One more move up and then we should sell for now....This pb has allowed the shorts to cash in...we are at signficant support (middle of prior funnel) and the bottom of the channel...in my opinion, we resume the move up...but I think $42-$44 zone is the likely pivot pt for a significan move back down...back to mid to low $30's...This current pb is will shake off the weak hands! However, let this be a lesson...avoid leverage or you may pay dearly....
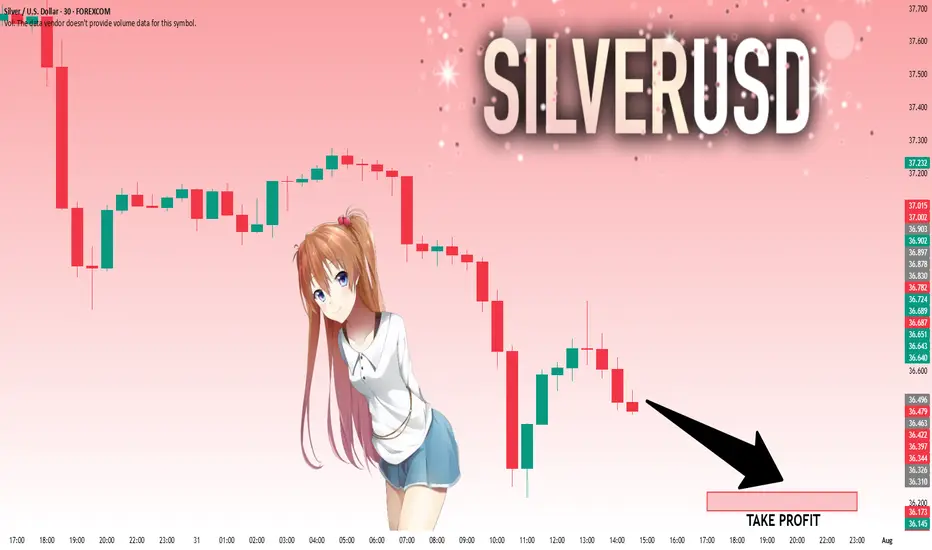
SILVER: Will Go Down! Short!
My dear friends,
Today we will analyse SILVER together☺️
The market is at an inflection zone and price has now reached an area around 36.490 where previous reversals or breakouts have occurred.And a price reaction that we are seeing on multiple timeframes here could signal the next move down so we can enter on confirmation, and target the next key level of 36.231..Stop-loss is recommended beyond the inflection zone.
❤️Sending you lots of Love and Hugs❤️
SILVER (XAGUSD): Bullish Reversal from Support Silver reacted significantly to the highlighted intraday resistance level during Friday's New York session.
I noticed a small double bottom pattern and the emergence of a bullish engulfing candle. I anticipate a pullback to the 37.72 level.

SILVER Bullish SetupSilver has been in a clear Bullish Trend Recently, and we are looking Silver to continue bullish.

XAGUSD SWING: SHORT-TERM BEARISH OPPORTUNITY Hi there,
For Silver, I am long term bullish but we have a set up for some short opportunity.
As annotated, we are primed to see lower prices... between 34 - 34.5
If this happens, I'd resume looking for massive long opportunities.
You might want to keep this on your radar.
Cheers,
Jabari
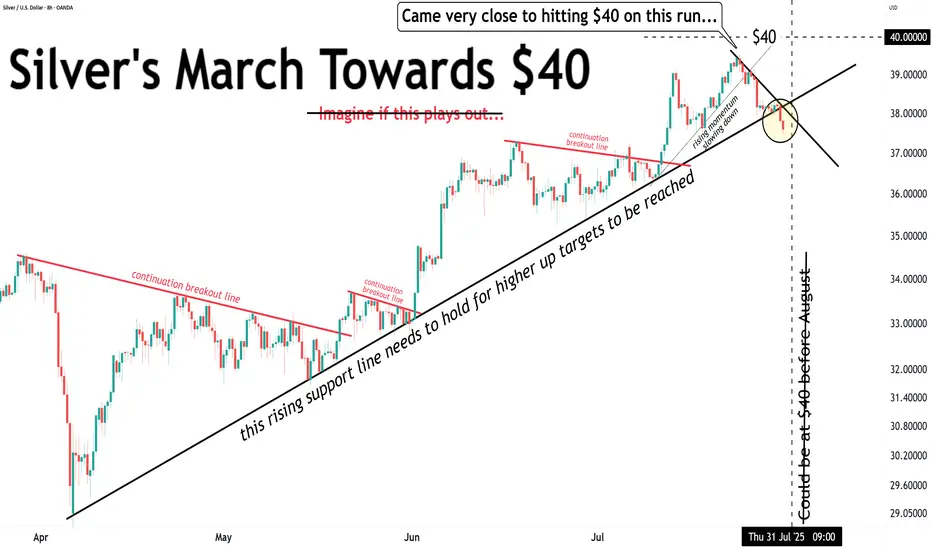
Silver came very close to the $40 target ($39.52).Silver came very close to the $40 target ($39.52).
Currently in correction mode.
Nothing to see here... for now.
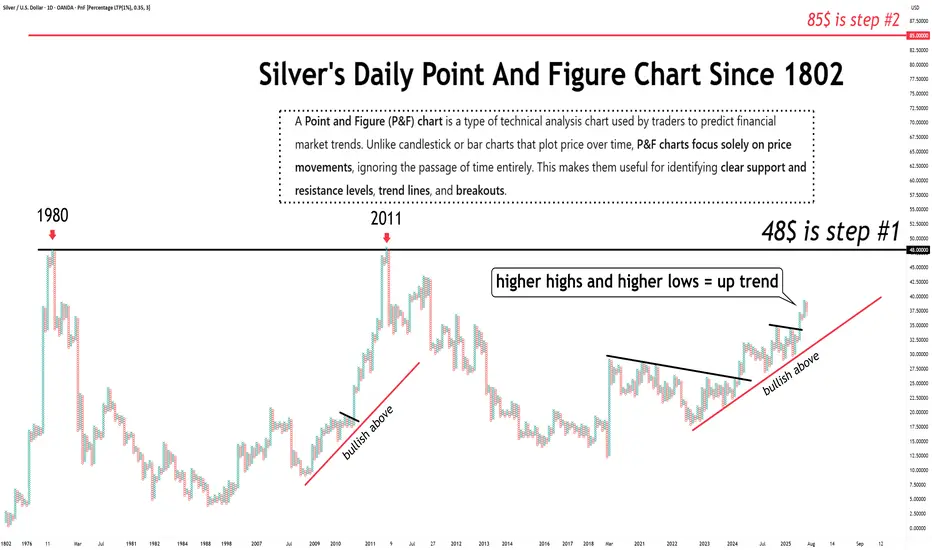
The long term prospects for silver are STILL bullish.Just so we are clear...
The long term prospects for silver are STILL bullish.
Once $48 is cleared, $85 becomes the next target.
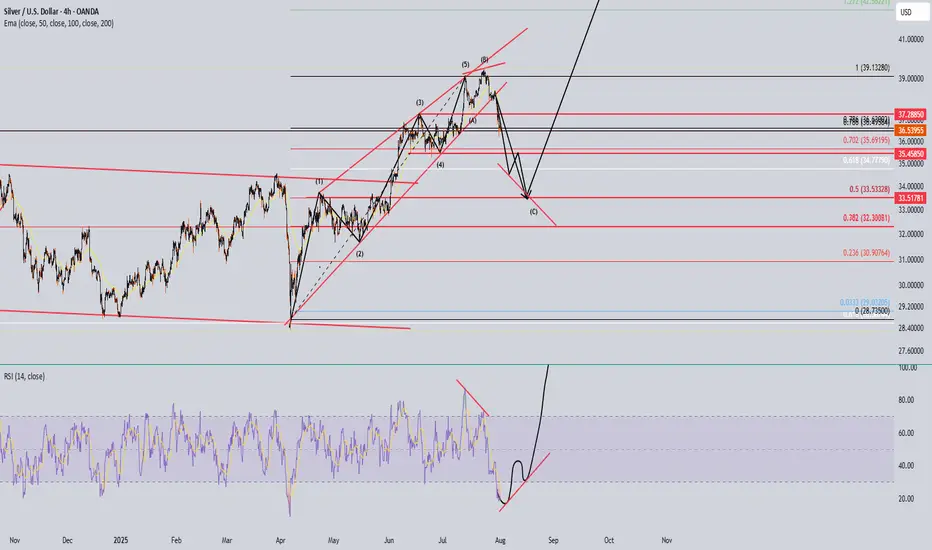
XAGUSD/SILVER LONG 1:5 RReason for entry:
1. Expanding flat structure
2. Order block reaction
3. 5th wave in play
4. 4 HR engulfing candle
Entry: 37.204
Stop loss: 36.454
Take Profit:39.073
Strategy: Wait for engulfing candle to enter
Place trade at break even at 1:2R or move stop loss to 1:1 R when in PROFIT

Silver ShortSI1! is now net short on the regression break.
Gold has not followed at this time.
I am not taking this trade directly.

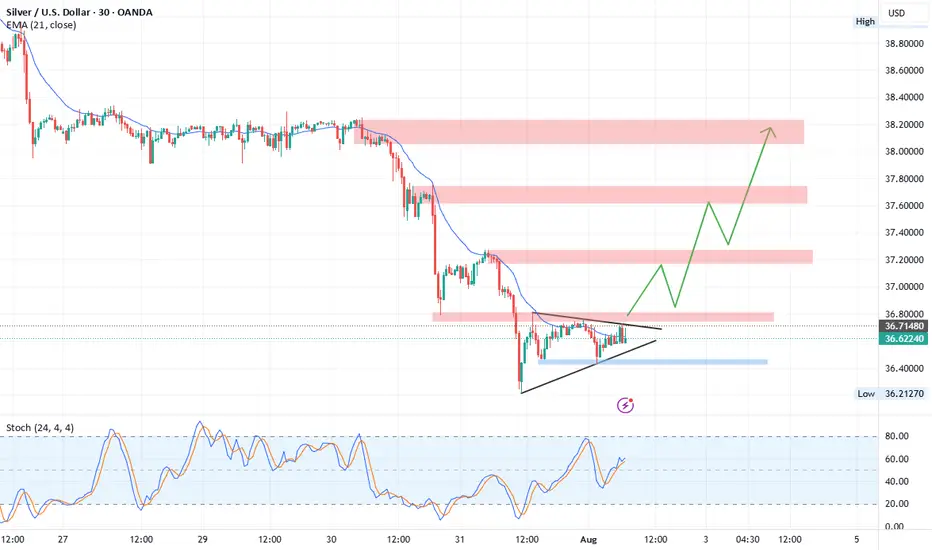
XAGUSD Technical Outlook (Silver/USD)Currently, Silver is trading inside a symmetrical triangle formation , signaling a potential breakout.
Upside Scenario:
A breakout above 36.80 resistance may trigger strong bullish momentum. The next target zone lies at 37.18 – 37.30, which is a relatively weak resistance and could potentially form a Head and Shoulders pattern . If momentum continues, Silver could extend gains toward 37.75 and 38.00 resistance levels.
Downside Scenario:
If the triangle breaks to the downside, we may see a short corrective move toward 3 6.25 – 36.20 support zone before any possible rebound.
Overall, the chart structure currently favors an upside breakout with continuation toward higher resistance zones.
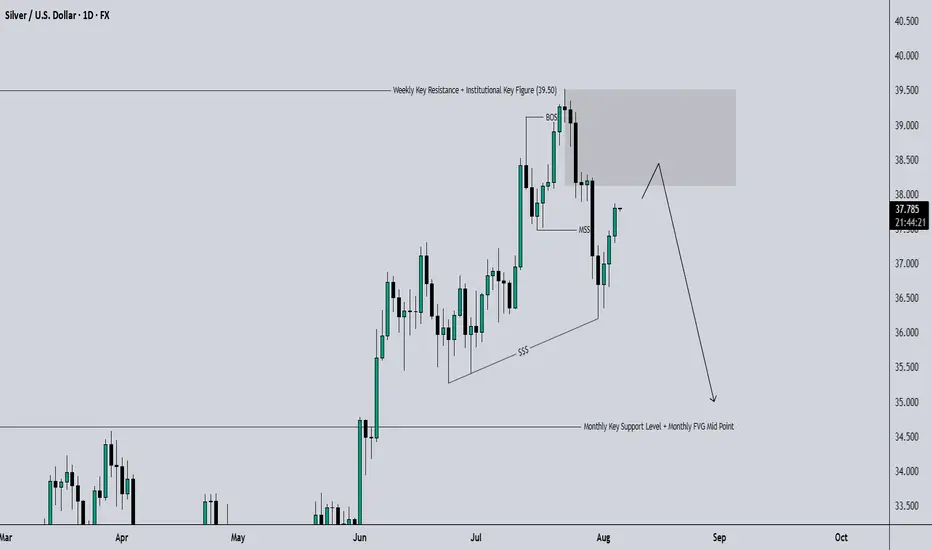
XAGUSD (SILVER): Sells For Now, Down To 35.80In this Weekly Market Forecast, we will analyze the XAGUSD (SILVER) for the week of Aug 4-8th.
Silver was strong, sweeping a 2012 high. Then sellers stepped in for the next couple of weeks, printing bearish candles. Friday say a late rally on weak job numbers, weakening the USD and allowing Silver and other asset pairs to outperform it in the short term.
Due to the bearish close of last week's candle, the indication is the rally was a market reaction, and that the slide will continue into this week.
Until there is a bullish break of market structure, buys are not a great idea. Stick with sells, down to the Monthly +FVG.
Enjoy!
May profits be upon you.
Leave any questions or comments in the comment section.
I appreciate any feedback from my viewers!
Like and/or subscribe if you want more accurate analysis.
Thank you so much!
Disclaimer:
I do not provide personal investment advice and I am not a qualified licensed investment advisor.
All information found here, including any ideas, opinions, views, predictions, forecasts, commentaries, suggestions, expressed or implied herein, are for informational, entertainment or educational purposes only and should not be construed as personal investment advice. While the information provided is believed to be accurate, it may include errors or inaccuracies.
I will not and cannot be held liable for any actions you take as a result of anything you read here.
Conduct your own due diligence, or consult a licensed financial advisor or broker before making any and all investment decisions. Any investments, trades, speculations, or decisions made on the basis of any information found on this channel, expressed or implied herein, are committed at your own risk, financial or otherwise.

SILVER (XAGUSD): More Growth Ahead
It looks like Silver is going to continue growing next week,
following a strong bullish reaction to a key daily horizontal support.
The next strong resistance is 3748.
It will be the next goal for the buyers.
❤️Please, support my work with like, thank you!❤️
I am part of Trade Nation's Influencer program and receive a monthly fee for using their TradingView charts in my analysis.

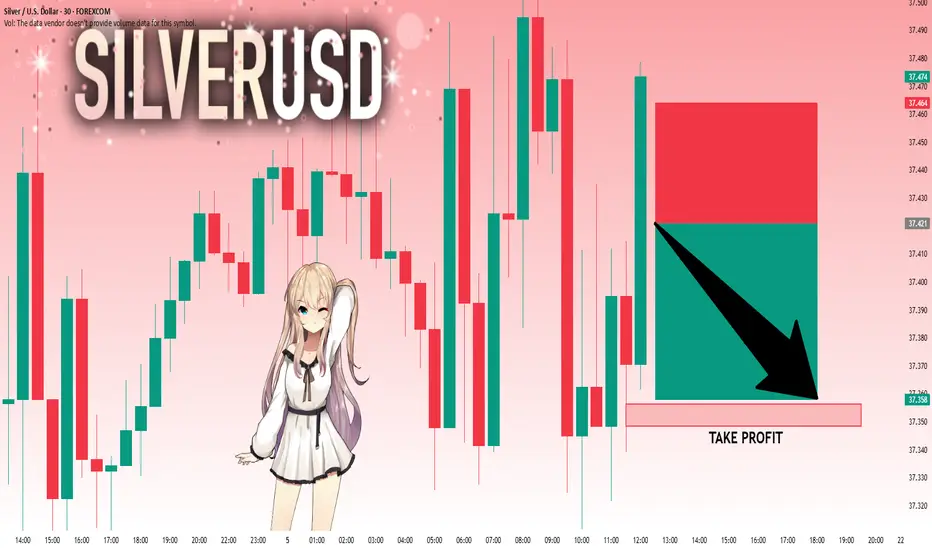
SILVER: The Market Is Looking Down! Short!
My dear friends,
Today we will analyse SILVER together☺️
The recent price action suggests a shift in mid-term momentum. A break below the current local range around 37.421 will confirm the new direction downwards with the target being the next key level of 37.356.and a reconvened placement of a stop-loss beyond the range.
❤️Sending you lots of Love and Hugs❤️
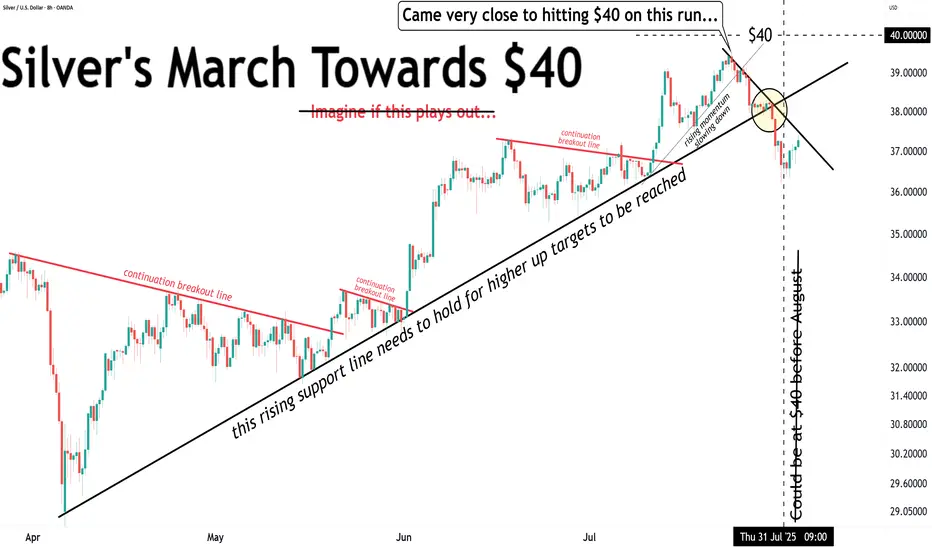
Silver came very close to $40… but lost steam.That’s it, folks.
Silver came very close to $40… but lost steam.
We’ve now closed below the rising support line.
Momentum has broken.
The correction deepens.
Wait SIlverLook at the RSI to form something like this in combine with the last 2 waves down. Then hopefully that power move to the 600?? Macro on the monthly its forming a cup and handle. If plays out silver will be super pricy
Silver XAGUSD is forming a bullish IB pattern The market of silver XAGUSD is in Up trend
it formed a correction wave
near the previous levels of multi bullish price action between 36 and 36,30
this market is forming an IB pattern
buy stop order must be place at the HH of the MB at the price 37.35
SL 36
TP 39

XAGUSD – Reversal Signs After the Run Toward $40Lately, I’ve been a strong advocate for a Silver rally toward $40, and indeed, we got a solid move, with price reaching as high as $39.50, not touching 40 though...
Just like with Gold, the last 3 days of last week turned bearish, and now it looks like we may be entering the early stage of a correction.
📉 Current Setup:
- The rejection from $39.50, right below the psychological $40 level, is significant
- I’ll be monitoring for a possible short entry if we get a rebound into the $38.80–$39.00 zone
- A new high above $39.50 would invalidate this setup
📌 On the downside, if price breaks below the confluence support at $37.70–$38.00, that would confirm the reversal and could lead to an acceleration toward $35.50 support
Conclusion:
The bullish narrative on Silver is pausing here. Until a new high is made, I’m looking to sell the bounce and follow the momentum if the breakdown under support is confirmed.
Let’s see how this plays out this week. 🧭
Disclosure: I am part of TradeNation's Influencer program and receive a monthly fee for using their TradingView charts in my analyses and educational articles.
Silver short term potential correction within a bull marketSilver short term potential correction within a bull market. Either way...
Don't leverage. Buy ETF or physical, and hold.
