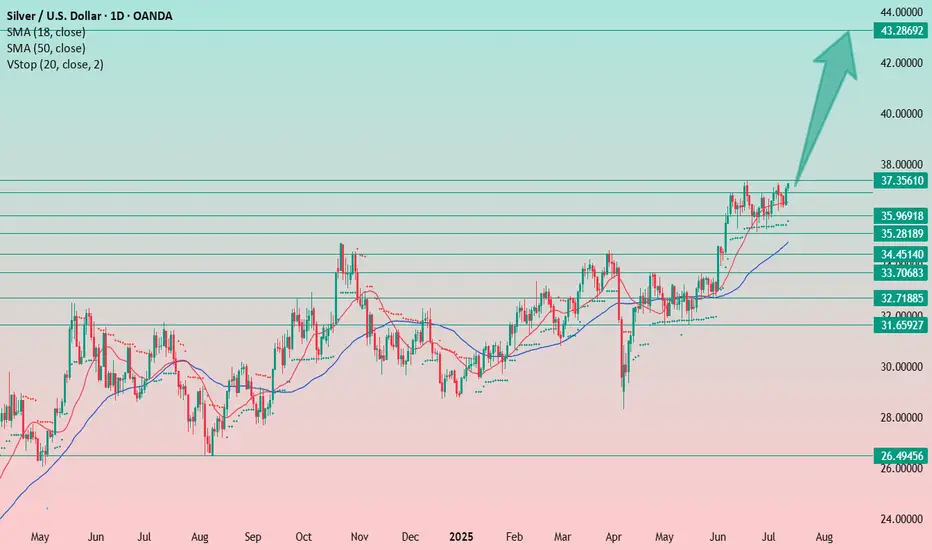
SILVER (XAGUSD): Correction is Over?!
It looks like Silver has finally completed a consolidation within
a wide horizontal parallel channel on a daily.
A new higher high formation today indicates coming growth.
Because if its Friday, I suggest looking for trend-following buy from Monday.
Let the market close above the underlined resistance to let it set a Higher Close
as well.
Look for buying after a pullback, aiming at 38.0 as the first goal.
❤️Please, support my work with like, thank you!❤️
XAGUSDG trade ideas

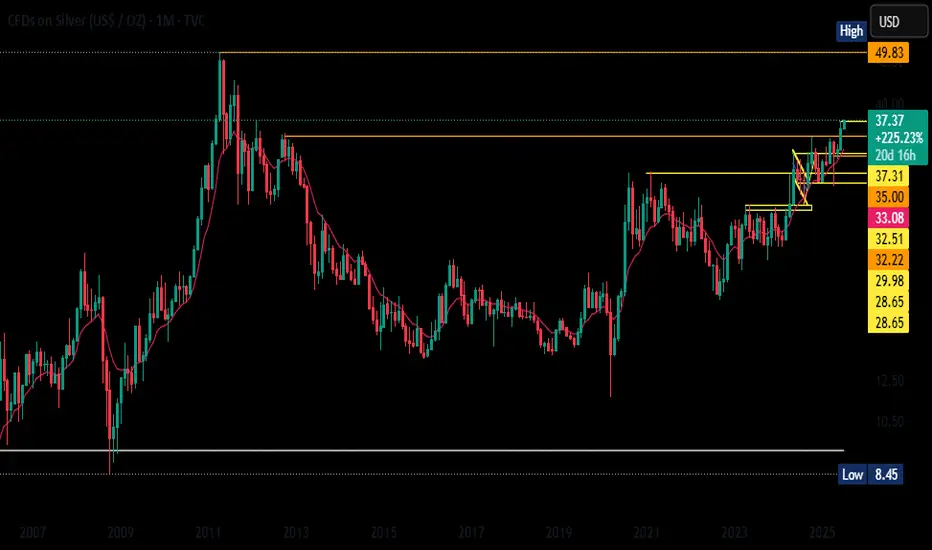
Final call before take offLook at the monthly chart of Silver (CFDs in USD/OZ), the longterm trend is clearly bullish. After spending over a decade consolidating below the $30–35 zone, The breakout above this historical resistance is significant and shows strong momentum, especially with price holding well above the 10-month EMA. We’re currently testing the $37.31 level, and if that gets taken out cleanly, the next major target is the all-time high at $49.83 from 2011. The recent structure even resembles a cup-and-handle or ascending triangle pattern, adding more weight to the bullish case. Support zones are now layered at $35, $33.06, and $32.51—key levels that were previous resistances. If there's any dip back to those zones, it may offer a solid buy-on-dips opportunity. As long as Silver holds above $35 on the monthly chart, I stay bullish with eyes on a move toward the $49.83 zone.
Silver Shows Promising Growth – It’s Not Too Late to JoinSilver is showing a pretty solid upward movement. It’s a harmonious and steady growth. I believe we’re just at the beginning of the trend, so it’s not too late to buy even now.
If you don’t have a position yet, you can still take advantage of this opportunity.
Set your stop-loss just below today’s low — at 36.90.
XAG/USD (Silver) - Triangle Breakout (09.07.2025)The XAG/USD (Silver) pair on the M30 timeframe presents a Potential Buying Opportunity due to a recent Formation of a Wedge Breakout Pattern. This suggests a shift in momentum towards the upside and a higher likelihood of further advances in the coming hours.
Possible Long Trade:
Entry: Consider Entering A Long Position around Trendline Of The Pattern.
Target Levels:
1st Resistance – 3749
2nd Resistance – 3781
🎁 Please hit the like button and
🎁 Leave a comment to support for My Post !
Your likes and comments are incredibly motivating and will encourage me to share more analysis with you.
Best Regards, KABHI_TA_TRADING
Thank you.
Disclosure: I am part of Trade Nation's Influencer program and receive a monthly fee for using their TradingView charts in my analysis

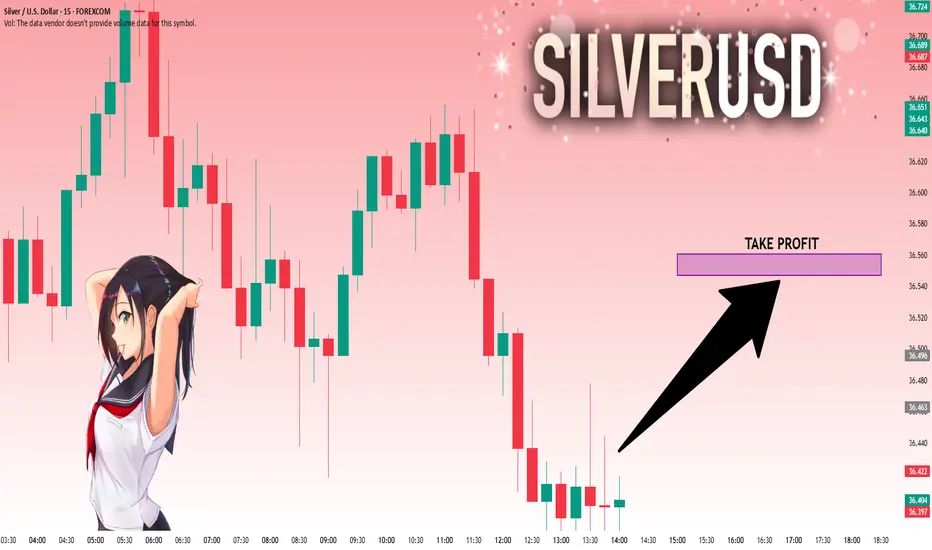
XAG USD LONGSilver Price held the Ascending support Trendline and created and broke out of a minor pennant indicating more movement to the upside, which was why I placed the long setup, and it moved just as Predicted but only missing the high Order block where TP was placed.
Still closed as a B.Even trade though.
Better Setups To Come 😉💪💯
_THE_KLASSIC_TRADER_.🔥

Silver is Again in the Bullish directionHello Traders
In This Chart XAGUSD HOURLY Forex Forecast By FOREX PLANET
today XAGUSD analysis 👆
🟢This Chart includes_ (XAGUSD market update)
🟢What is The Next Opportunity on XAGUSD Market
🟢how to Enter to the Valid Entry With Assurance Profit
This CHART is For Trader's that Want to Improve Their Technical Analysis Skills and Their Trading By Understanding How To Analyze The Market Using Multiple Timeframes and Understanding The Bigger Picture on the Charts

Silver Spot to $136/oz then $477/ozThis could take multiple years to play out, my gold call 2-3 years ago was dead on. All I'm using are multi-fib confluences and the assumption that currency debasement and global liquidity will continue to increase over time. I am riding silver for the long haul. Watch Gold and for DXY bottoming pattern. Silver and Crypto move when DXY enters a momentum shift to the upside. Silver to $136-150 then $477-500 eventually.
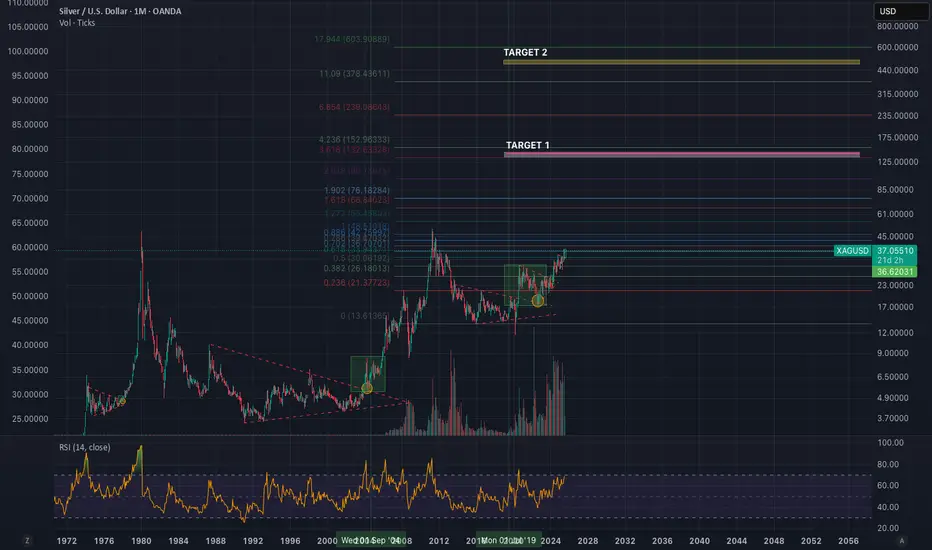
XAGUSD ~750 USD!?Hello. SILVER is approaching the cap of a multi-decade 'cup and handle' pattern. The measured move from that pattern reaches ~750USD/oz. GOLD has already reached the capping line of the 'cup and handle' and has continued up. Silver is known to lag Gold and outperform in the end. Position wisely my brothers and sisters.
$XAGUSD: Silver lagging Copper, not for long...OANDA:XAGUSD lagging OANDA:XCUUSD in this move...
Daily up trend signal flashed today in Silver, seems like a good trade to play catch up vs Copper next.
Best of luck!
Cheers,
Ivan Labrie.

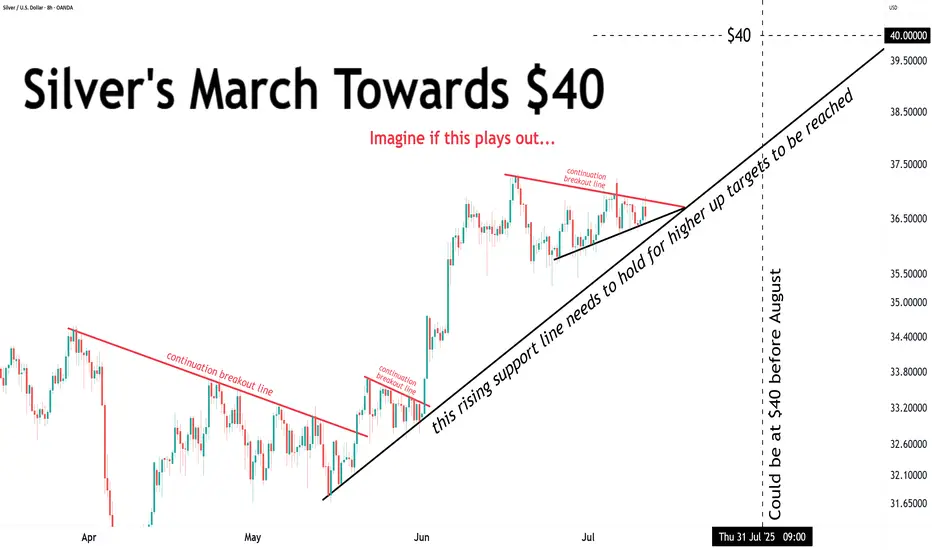
The anvil is tightening... The anvil is tightening...
Approaching a resolution which will answer the question:
"Will silver hit $40 before August?"
SILVER: Will Go Down! Short!
My dear friends,
Today we will analyse SILVER together☺️
The recent price action suggests a shift in mid-term momentum. A break below the current local range around 36.619 will confirm the new direction downwards with the target being the next key level of 36.530 .and a reconvened placement of a stop-loss beyond the range.
❤️Sending you lots of Love and Hugs❤️

XAGUSD Analysis : Squeeze + Curved Support Break + Bearish SetupThe XAGUSD 4-hour timeframe presents a structurally rich bullish setup, displaying signs of smart money accumulation and directional bias toward a potential breakout. Price action is currently compressing beneath a major horizontal resistance, supported dynamically by a Black Mind Curve, indicating progressive demand absorption by larger players.
This structure — characterized by rounded, ascending support and multiple rejections off a flat resistance — resembles a re-accumulation cup-like formation beneath a key supply level. These conditions often precede high-probability breakouts, driven by liquidity engineering and retail trap setups.
🔍 Key Technical Elements:
🟢 1. Black Mind Curve Support (Dynamic Demand Zone)
The curved trendline support represents an institutionally significant accumulation level, respected over multiple sessions. Note the price’s consistent reaction at this curved support, producing long lower wicks and bullish engulfing candles — both signs of liquidity grabs followed by strong buyer commitment.
This curve essentially acts as a visual footprint of algorithmic buying interest — creating a controlled, higher-low structure leading into the resistance wall.
🔵 2. Major Horizontal Resistance Zone (~37.20–37.40)
This level has served as a historical sell-side liquidity pool, having rejected multiple attempts to break higher over the past weeks. Each approach has been met with selling pressure, but the gradual compression of price against this zone hints at an impending breakout. Repeated testing of resistance with higher lows builds pressure — a classic ascending re-test model.
🟡 3. Break of Structure (BOS) Levels: Confirmation Zones
Minor BOS (~36.20): Confirmed. Indicates bullish intent and short-term trend shift.
Major BOS (~35.80): The ultimate invalidation level. If broken, the bullish thesis is compromised, and price may re-enter the lower consolidation zone.
A bullish BOS above 37.40 would mark a true breakout and open the door to 38.00+ levels.
🔴 4. Liquidity & Smart Money Behavior
The long wicks and deep retests into the Black Mind Curve suggest stop-loss hunts and liquidity inducement. Institutions often use such zones to trap breakout traders early, accumulate orders below swing lows, and then reverse the move. The price action around July 3–10 reflects this behavior clearly.
⚫ 5. Volume & Momentum Consideration
While not shown in the chart, volume confirmation is critical here. A breakout above resistance should ideally be supported by increased volume and momentum divergence on RSI/MACD. A failure to confirm could indicate a fakeout trap, which is not uncommon in commodity markets like Silver.
📌 Strategic Trade Scenarios:
🟢 Bullish Continuation Setup:
Trigger: Break and 4H candle close above 37.40 resistance
Retest Entry: Wait for price to retest broken resistance (now support) with bullish confirmation (engulfing, pin bar, etc.)
Targets:
TP1: 38.00 (psychological round number)
TP2: 38.60–38.90 (measured move target from structure base)
TP3: 39.50 (extension target)
Invalidation: Break below 36.00 with strong bearish volume
🔻 Bearish Rejection Scenario:
Trigger: Sharp rejection from resistance zone followed by breakdown below the Black Mind Curve and BOS levels
Confirmation: Close below 36.20 with high volume
Targets:
TP1: 35.80
TP2: 35.20 (curve base)
TP3: 34.80 (range bottom liquidity zone)
Invalidation: Return above 36.80 after rejection
📘 Market Context & Professional Insight:
This is a high-probability continuation pattern in a bullish macro context. With interest rates stabilizing and commodity demand remaining firm, silver often trails gold in performance but catches up with volatility. Traders must watch the behavior around the resistance level, as that’s where smart money will show their hand.
Institutional traders typically accumulate below resistance and engineer a breakout with controlled price action — and this chart is a textbook display of that setup. The Mind Curve structure mimics Wyckoffian schematics in the re-accumulation phase.
Timing is crucial — breakout traders should be patient and disciplined, avoiding premature entries before a valid confirmation of strength.
✅ Conclusion:
Silver (XAGUSD) is approaching a critical juncture. The chart structure suggests an imminent breakout above major resistance, supported by institutional behavior along the Black Mind Curve Support. However, traders must remain agile — watch for breakout confirmation or signs of a false move followed by distribution.
This chart embodies a calculated bullish bias, and offers a great risk-to-reward opportunity for both trend followers and breakout traders.

Silver $38-$40 by the end of July, then OTW to $50Silver bull. It's ready to break to $38-$40. Anytime soon in July. Get ready

XAGUSD
Silver Outlook: Bullish with Potential Upside
Current Price: $30.24
Anticipated Targets: $33.00 - $36.00 - $39.00 - $40.00+++
Rationale:
Silver (XAG/USD) appears poised for significant upside potential in the coming months. Several technical indicators support this bullish view. The Relative Strength Index (RSI) has shown a strong uptrend, indicating increasing buying momentum. Additionally, the Moving Average Convergence Divergence (MACD) has crossed over into bullish territory, further affirming positive sentiment.
Risk Disclaimer:
Trading Forex and commodities involves substantial risk and may not be suitable for all investors. Past performance is not indicative of future results. It's important to carefully consider your financial situation and consult with a qualified financial advisor before making any investment decisions.
Conclusion:
Given the technical indicators and current market sentiment, I believe silver is positioned for a potential rally towards $33.00, $36.00, $39.00, and possibly beyond $40.00 in the coming months. Traders should monitor price action closely and manage risk appropriately.

SILVER, BULLISH MACD and RSI CROSS!Once in 23 year opportunity to jump on the silver train before it leaves the station.
Every single time we have seen this MACD and RSI bullish cross, silver has outperformed the SPX by 400-500%+!
This is happening without a current bear market in equities, reflecting the inflationary environment.
Happy stacking!

SILVER: Bulls Are Winning! Long!
My dear friends,
Today we will analyse SILVER together☺️
The price is near a wide key level
and the pair is approaching a significant decision level of 36.433 Therefore, a strong bullish reaction here could determine the next move up.We will watch for a confirmation candle, and then target the next key level of 36.547.Recommend Stop-loss is beyond the current level.
❤️Sending you lots of Love and Hugs❤️
Silver set to break Higher? chart patterns suggest big moveSilver has been stuck in a sideways range for nearly a month, but a breakout may be near. A large ascending triangle hints at a possible move toward 41.37. Depending on how the market reacts, traders could aim for short-term targets with a 2.75 to 5.87 reward ratio or ride it longer for a potential 9.54. Classic markets are messy, so timing matters. Here's how I’d trade it and where I'd place stops. Let me know what you think in the comments.

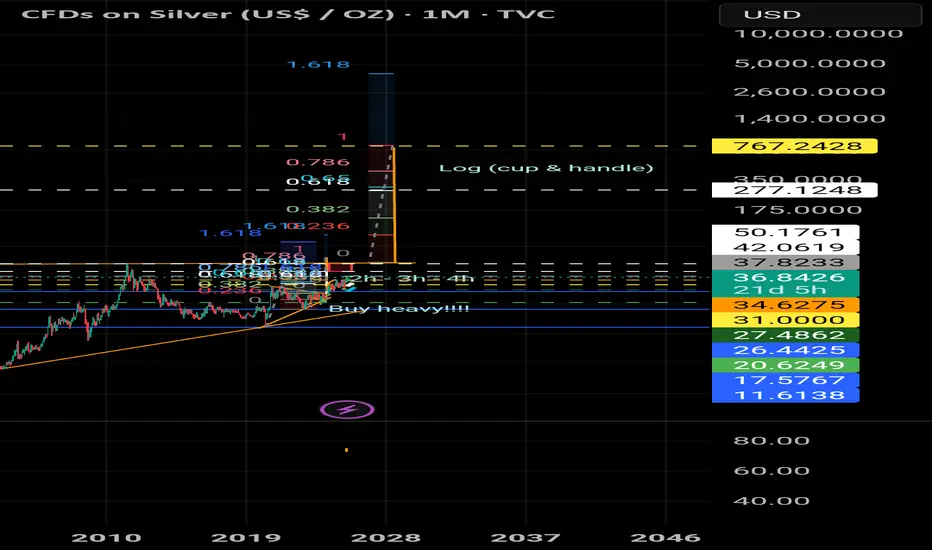
Silver’s Gateway to $100 and Beyond!Silver’s Gateway to $100 and Beyond!
🚨 A Once-in-a-Lifetime Chart is Unfolding 🚨
A rare setup backed by years of technical, cycles & market psychology.
Triple digits are in play once a breakout is confirmed.

Long SilverExpecting Silver to do a little bit of consolidation before going up higher. Price is just for reference. Please do your own due diligence before trading. Also please manage your risk as well. Trade safe everyone. God bless.

SILVER: Local Bearish Bias! Short!
My dear friends,
Today we will analyse SILVER together☺️
The price is near a wide key level
and the pair is approaching a significant decision level of 36.435 Therefore, a strong bearish reaction here could determine the next move down.We will watch for a confirmation candle, and then target the next key level of 36.336..Recommend Stop-loss is beyond the current level.
❤️Sending you lots of Love and Hugs❤️

XAG/USD elliot wave countFXOPEN:XAGUSD
📊 Silver – Elliott Wave Analysis (Overview)
🔹 Macro Structure:
We’ve already completed the larger Wave 3 and are now transitioning into Wave 4.
🔹 Corrective Structure – Wave 4:
The A wave of the correction is already completed.
The B wave has also been completed.
We are now in the process of building the C wave, which will complete Wave 4.
🔹 Internal Structure of Wave C:
From the end of Wave B, we’ve already formed a (1) and (2) (in brackets).
Within this move, another smaller (1) and (2) have now unfolded, and we are currently on the way to the (3) of C.
🔹 Market Context:
Target zones and entry zones are already marked on the chart.
These zones can still be adjusted, depending on how price action develops in the coming days.

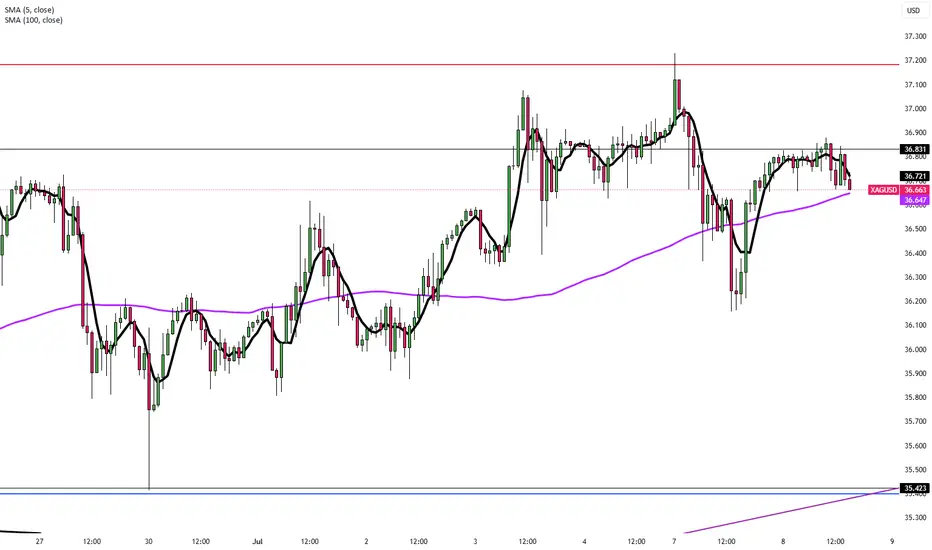
Silver Holds Near $36.80 on Tariff FearsSilver remains steady just below $37.00, hovering around $36.80 in Tuesday’s Asian session after a sharp rebound from the $36.15 level seen late Monday. The metal continues to trade in a tight range as conflicting market signals keep traders cautious.
Global trade tensions and geopolitical uncertainties, fueled by the U.S.’s upcoming tariffs on multiple countries and its hardline stance against BRICS-aligned nations, have elevated market risk perception. This has sparked a modest uptick in safe-haven demand, offering limited support to silver.
The strength of the U.S. Dollar and uncertainty surrounding future interest rate decisions are capping silver’s upside potential. Market participants remain focused on incoming economic data and central bank signals for clearer direction.
In the near term, silver is expected to stay volatile and highly reactive to geopolitical and economic headlines.
Resistance is at 37.50, while support holds at 35.40.
Silver Rectangle Price Target $40Silver H & S continuation target met.
Trend has resumed in an up channel with a rectangle price target of 40.6.
